
International Journal of Automation, Control and Intelligent Systems, Vol. 1, No. 1, May 2015 Publish Date: May 13, 2015 Pages: 9-15
Ontology Similarity Measuring and Ontology Mapping Algorithms Based on Graph-Constrained Elastic-Net
Yun Gao1, *, Li Liang2, Wei Gao2
1Department of Editorial, Yunnan Normal University, Kunming, China
2School of Information Science and Technology, Yunnan Normal University, Kunming China
Abstract
Ontology similarity calculation is important research topics in information retrieval and widely used in science and engineering. By analyzing the technology of GraphNet, we propose the new algorithm for ontology similarity measure and ontology mapping. Via the ontology sparse vector learning, the ontology graph is mapped into a line consists of real numbers. The similarity between two concepts then can be measured by comparing the difference between their corresponding real numbers. The experiment results show that the proposed new algorithm has high accuracy and efficiency on ontology similarity calculation and ontology mapping.
Keywords
Ontology, Similarity Measure, Ontology Mapping, Sparse Vector, Graph-Constrained Elastic-Net
Received: April 4, 2015 / Accepted: April 17, 2015 / Published online: May 8, 2015
@ 2015 The Authors. Published by American Institute of Science. This Open Access article is under the CC BY-NC license. http://creativecommons.org/licenses/by-nc/4.0/
1. Introduction
As a conceptual shared and knowledge representation model, ontology has been used in knowledge management, image retrieval and information retrieval search extension. Furthermore, acted as an effective concept semantic model, ontology is employed in other fields except computer science, including medical science, social science, pharmacology science, geography science and biology science (see Przydzial et al., [1], Koehler et al., [2], Ivanovic and Budimac [3], Hristoskova et al., [4], and Kabir et al., [5] for more detail).
The ontology model is a graph G=(V,E) such that each vertex v expresses a concept and each directed edge e=vivj denote a relationship between concepts vi and vj. The aim of ontology similarity measure is to get a similarity function Sim: V×V ![]()
![]()
![]() {0} such that each pair of vertices is mapped to a non-negative real number. Moreover, the aim of ontology mapping is to obtain the link between two or more ontologies. In more applications, the key of ontology mapping is to get a similarity function S to determine the similarity between vertices from different ontologies.
{0} such that each pair of vertices is mapped to a non-negative real number. Moreover, the aim of ontology mapping is to obtain the link between two or more ontologies. In more applications, the key of ontology mapping is to get a similarity function S to determine the similarity between vertices from different ontologies.
In recent years, ontology similarity-based technologies were employed in many applications. By virtue of technology for stable semantic measurement, a graph derivation representation based trick for stable semantic measurement is presented by Ma et al., [6]. Li et al., [7] determined an ontology representation method which can be used in online shopping customer knowledge with enterprise information. A creative ontology matching system is proposed by Santodomingo et al., [8] such that the complex correspondences are deduced by processing expert knowledge with external domain ontologies and in view of novel matching technologies. The main features of the food ontology and several examples of application for traceability aims were reported by Pizzuti et al., [9]. Lasierra et al., [10] pointed out that ontologies can be employed in designing architecture for taking care of patients at home. More ontology learning algorithms can refer to [11-22].
In this paper, we present the new ontology similarity computation and ontology mapping algorithms relied on the GraphNet technology which was proposed in Grosenick et al., [23]. In terms of the sparse vector, the ontology graph is mapped into a real line and vertices are mapped into real numbers. Then the similarity between vertices is measured by the difference between their corresponding real numbers.
2. Basic Idea
Let V be an instance space. For any vertex in ontology graph G, its information (including its attribute, instance, structure, name and semantic information of the concept which is corresponding to the vertex and that is contained in its vector) is denoted by a vector with p dimension. Let v=![]() be a vector which is corresponding to a vertex v. For facilitating the expression, we slightly confuse the notations and denote v both the ontology vertex and its corresponding vector. The purpose of ontology learning algorithms is to get an optimal ontology function f: V
be a vector which is corresponding to a vertex v. For facilitating the expression, we slightly confuse the notations and denote v both the ontology vertex and its corresponding vector. The purpose of ontology learning algorithms is to get an optimal ontology function f: V![]()
![]() , then the similarity between two vertices is determined by the difference between two real numbers which they correspond to. The essence of such algorithm is dimensionality reduction, that is to say, use one dimension vector to represent p dimension vector. From this point of view, an ontology function f can be regarded as a dimensionality reduction map f:
, then the similarity between two vertices is determined by the difference between two real numbers which they correspond to. The essence of such algorithm is dimensionality reduction, that is to say, use one dimension vector to represent p dimension vector. From this point of view, an ontology function f can be regarded as a dimensionality reduction map f: ![]()
![]()
![]() .
.
3. Main Ontology Algorithms
In this section, we present our main ontology sparse vector learning algorithms for ontology similarity measuring and ontology mapping by virtue of graph-constrained elastic-net. .
In the real implement, the sparse ontology function can be denoted as
![]() =
= , (1)
, (1)
where ![]() =
=![]() is a sparse vector. For determining the ontology function f, we should get the sparse vector
is a sparse vector. For determining the ontology function f, we should get the sparse vector ![]() first.
first.
The simplest model to learn the ontology sparse vector can be denoted as
![]() =
=![]()
=![]() , (2)
, (2)
where V is information matrix and y is the target vector. By adding a penalty term ![]() , the optimal model (1) can be expressed as
, the optimal model (1) can be expressed as
![]() =
=![]() (3)
(3)
where ![]()
![]()
![]() is a parameter that trades off least squares goodness-of-fit with the penalty on the model coefficients.
is a parameter that trades off least squares goodness-of-fit with the penalty on the model coefficients.
In graph-constrained elastic-net (GraphNet) setting, it uses a mixture ![]() - and
- and ![]() -norm regularization, and (3) can be written as
-norm regularization, and (3) can be written as
![]() =
=![]()
![]() , (4)
, (4)
where ![]() and
and ![]() are balance parameters.
are balance parameters.
The GraphNet model with modification ![]() -norm penalty term is described by
-norm penalty term is described by
![]() =
=![]()
![]()
![]() =
=![]() =
=![]() , (5)
, (5)
where H is a sparse graph. Note that if H=I is the identity matrix, then the GraphNet is just the Elastic-Net. Hence, the Elastic-Net is a special situation of GraphNet and we can replicate the effects of increasing an Elastic-Net penalty via adding a scaled version of the identity matrix ![]() to H (for
to H (for ![]() >0).
>0).
If H=L (graph Laplacian matrix), then ![]() has the appealingly simple representation
has the appealingly simple representation
![]() =
=![]() ,
,
where ![]() is the set of index pairs that share an edge in graph H (i.e. have a nonzero entry in the adjacency matrix A).
is the set of index pairs that share an edge in graph H (i.e. have a nonzero entry in the adjacency matrix A).
Furthermore, the adaptive GraphNet model with an adaptive penalty is denoted as
![]() =
=![]()
![]() ,
,
where ![]() =
=![]() and
and ![]() is a real number.
is a real number.
More generally, we can formulate the penalized ontology problem of interest as minimizing the penalized empirical risk ![]() as a function of the coefficients, so that
as a function of the coefficients, so that
![]() =
=![]()
=![]() , (6)
, (6)
where ![]() is the estimate of response variable y (denote
is the estimate of response variable y (denote ![]() =
=![]() in the linear models we consider) and
in the linear models we consider) and ![]() =
= is the average of the ontology loss function over the training data of the loss function
 ![]() that penalizes differences between the estimated and true values of y at the i-th observation. For example,
that penalizes differences between the estimated and true values of y at the i-th observation. For example,
![]() =
=![]() =
=![]() .
.
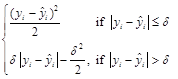
Outlying data points are an important consideration when modeling special data, in which a variety of factors ranging from residual motion artifacts to field inhomogeneities can cause some observations to fall far from the sample mean. In the case of standard squared-error loss, a standard solution is to use a robust ontology loss function, such as the Huber loss function
![]() =
= , (7)
, (7)
where
![]() =
=
Since GraphNet uses squared-error loss, it can be modified to include a robust penalty like the Huber loss. Replacing the squared error ontology loss function with the loss function gets
![]() =
= . (8)
. (8)
Next, we use the technology called infimal convolution, and is defined as
![]() =
=![]() ,(9)
,(9)
where f and g are two functions of ![]() . Thus, we can re-express the i-th term in the Huber loss function (7) the infimal convolution of the squared and absolute-value functions applied to the i-th residual
. Thus, we can re-express the i-th term in the Huber loss function (7) the infimal convolution of the squared and absolute-value functions applied to the i-th residual ![]() :
:
![]()
![]() =
=![]() , (10)
, (10)
where ![]() =
=![]() . This deduced the augmented estimation ontology problem
. This deduced the augmented estimation ontology problem
![]() =
=![]()
![]() (11)
(11)
where ![]() are auxiliary variables. Considering the residuals
are auxiliary variables. Considering the residuals ![]() , the first term in the objective of (11) can be denoted as
, the first term in the objective of (11) can be denoted as ![]() =
=![]() and thus each
and thus each ![]() can directly reduce the residual sum of squares corresponding to a single observation by taking a value close to
can directly reduce the residual sum of squares corresponding to a single observation by taking a value close to ![]() . Furthermore, (11) can be rewrite as
. Furthermore, (11) can be rewrite as
![]() =
=![]()
![]() , (12)
, (12)
Z=![]() ,
, ![]() =
=![]() ,
,
![]() =
=![]() ,
,
![]() =
=![]()
![]()
![]() ,
,
where ![]() is the set of positive semidefinite
is the set of positive semidefinite ![]() matrices.
matrices.
The GraphNet ontology problem expressed in (5) obtains from a constrained maximum likelihood problem, and this is a constrained convex optimization ontology problem
![]() (13)
(13)
s. t. ![]() ,
, ![]() , (14)
, (14)
where ![]()
![]()
![]() and
and ![]()
![]()
![]() set hard bounds on the size of the coefficients on the
set hard bounds on the size of the coefficients on the ![]() and
and ![]() norms, respectively. A standard approach for solving such ontology problems is to relax the hard constraints to linear penalties and consider just those terms containing
norms, respectively. A standard approach for solving such ontology problems is to relax the hard constraints to linear penalties and consider just those terms containing![]() , giving the Lagrangian form of the GraphNet problem
, giving the Lagrangian form of the GraphNet problem
![]() =
=![]()
![]() ,
, ![]() ,
,![]()
![]()
![]() . (15)
. (15)
Ontology problem (15) can also be arrived at from a Bayesian perspective as a maximum a posteriori estimator. In this situation, the form of the penalty ![]() is related to one's prior beliefs about the structure of the coefficients. For instance, the Elastic-Net penalty corresponds to the prior
is related to one's prior beliefs about the structure of the coefficients. For instance, the Elastic-Net penalty corresponds to the prior
![]()
![]()
![]() .
.
The GraphNet penalty thus corresponds to the prior distribution
![]()
![]()
![]()
![]()
![]() , (16)
, (16)
where ![]() denotes that vertex i in the graph H is adjacent to vertex j.
denotes that vertex i in the graph H is adjacent to vertex j.
Coordinate-wise descent is guaranteed to converge for GraphNet methods since they are all of the form
![]() =
=![]() , (17)
, (17)
where ![]() is a convex, differentiable function, and where each
is a convex, differentiable function, and where each ![]() is a convex function. We consider the coordinate-wise updates for the standard GraphNet problem given in (5). Letting
is a convex function. We consider the coordinate-wise updates for the standard GraphNet problem given in (5). Letting ![]() =
=![]() (where
(where ![]() =
=![]() is the matrix V with the j-th column removed, and
is the matrix V with the j-th column removed, and ![]() =
=![]() the coefficient vector with the j-th coefficient removed), then the subdifferential of the risk with respect to only the j-th coefficient is
the coefficient vector with the j-th coefficient removed), then the subdifferential of the risk with respect to only the j-th coefficient is
![]() =
=![]()
![]() , (18)
, (18)
where the set-valued function ![]() =-1 if
=-1 if![]() <0,
<0, ![]() =1 if
=1 if ![]() >0 and
>0 and ![]()
![]() [−1,1] if
[−1,1] if ![]() =0. If we let
=0. If we let ![]() =
=![]() in (18), then the coordinate update iteration for the j-th coefficient estimate is
in (18), then the coordinate update iteration for the j-th coefficient estimate is
![]()
![]()
 , (19)
where
![]() =
=![]() (20)
(20)
is the elementwise soft-thresholding function.
Now, we present main ontology sparse vector learning algorithm, which is a modification of algorithm in Grosenick et al., [23]"
Step 1. Fixed a set of data and parameters ![]() =
=![]() , previous coefficient estimates
, previous coefficient estimates![]() ,
,![]() , and
, and ![]() positive semidefinite constraint graph H
positive semidefinite constraint graph H![]()
![]() , let
, let
![]() =
=![]() ,
,
Z=![]() .
.
Step 2. Select coordinate j using essentially cyclic rule and fix![]() =
=![]() ,
, ![]() =
= ![]() ,
, ![]() =
=![]() .
.
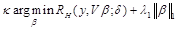
Step 3. Update ![]() by virtue of
by virtue of
![]()
![]()
where ![]() is the element-wise soft-thresholding operator in (20), and where
is the element-wise soft-thresholding operator in (20), and where ![]() is the appropriately augmented H given in (12).
is the appropriately augmented H given in (12).
Step 4. Repeat steps (1)–(3) cyclically for all j![]() {1,…, p+n} until convergence.
{1,…, p+n} until convergence.
Step 5. Optional: rescale resulting estimates.
For a particular coordinate j, we are interested in the estimates
![]() =
=![]()
![]()
if ![]() ,
,
![]() =
=![]()
![]() if
if ![]() .
.
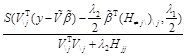
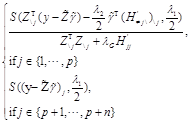
Using coordinate-wise descent and active set methods, this yields the coordinate-wise updates
![]()
![]()
if ![]() ,
,
![]()
![]()
if ![]() .
.
where ![]() is the element-wise soft-thresholding operator in (20).
is the element-wise soft-thresholding operator in (20).
4. Experiments
Two simulation experiments on ontology similarity measure and ontology mapping are designed in this section. For detail implement, we first obtain the optimal sparse vector using the algorithm raised in our paper, and then the ontology function is yielded by (1).
4.1. Experiment on Biology Data
The "Go" ontology O1 was constructed by http: //www. geneontology. org. (Fig. 1 presents the graph structure of O1). We use P@N (defined by Craswell and Hawking [24]) to determine the equality of the experiment result.
Beside our ontology algorithm, ontology algorithms in Huang et al., [12], Gao and Liang [13] and Gao and Gao [14] are also acted to "Go" ontology. Then, we compare the precision ratio which we have deduced from the four tricks. Some parts of experiment results can be seen in Table 1.
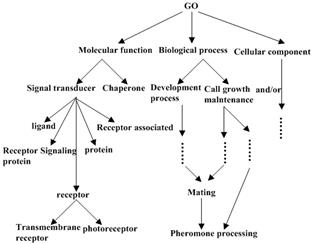
Figure 1. "Go" ontology.
Table 1. The experiment data for ontology similarity measure.
| P@3 average precision ratio | P@5 average precision ratio | P@10 average precision ratio | P@20 average precision ratio | |
| Our Algorithm | 47.02% | 53.97% | 64.05% | 82.45% |
| Algorithm in [12] | 46.38% | 53.48% | 62.34% | 74.59% |
| Algorithm in [13] | 43.56% | 49.38% | 56.47% | 71.94% |
| Algorithm in [14] | 42.13% | 51.83% | 60.19% | 72.39% |
As we can see in the Figure 1, when N= 3, 5, 10 or 20, the precision ratio in view of our algorithm is higher than that got by tricks which has been determined in Huang et al., [12], Gao and Liang [13] and Gao and Gao [14].
4.2. Experiment on Physical Education Data
For our second experiment, we use physical education ontologies O2 and O3 (the graph structures of O2 and O3 are raised in Fig. 2 and Fig. 3 respectively). The purpose of this experiment is to construct the ontology mapping between O2 and O3. Again, P@N criterion is applied to measure the equality of the experiment results.
Furthermore, ontology technologies in Huang et al., [12], Gao and Liang [13] and Gao et al., [16] are employed to "physical education" ontology. At last, we compare the precision ratio that we have obtained from four tricks. Table 2 present several results for this experiment.
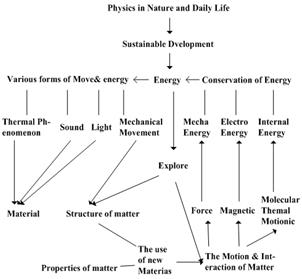
Figure 2. "Physical Education" Ontology O2.
Figure 3. "Physical Education" Ontology O3.
Table 2. The experiment data for ontology mapping.
| P@1 average precision ratio | P@3 average precision ratio | P@5 average precision ratio | |
| Our Algorithm | 69.13% | 78.49% | 90.97% |
| Algorithm in [12] | 61.29% | 73.12% | 79.35% |
| Algorithm in [13] | 69.13% | 75.56% | 84.52% |
| Algorithm in [16] | 67.74% | 77.42% | 89.68% |
From what we have obtained in Table 2, we find it more efficient to use our Algorithm than algorithms determined by Huang et al., [12], Gao and Liang [13] and Gao et al., [16], especially where N is sufficiently large.
5. Conclusions
In our article, a new algorithm for ontology similarity measure and ontology mapping application is presented by virtue of GraphNet. Furthermore, experiment results reveal that our new algorithm has high efficiency in both biology and physics education. The ontology algorithm presented in our paper illustrates the promising application prospects for ontology use.
Acknowledgment
We thank the reviewers for their constructive comments in improving the quality of this paper. The research is financed by: NSFC (No.11401519), and the PhD initial funding of the second author.
References
- J. M. Przydzial, B. Bhhatarai, and A. Koleti, GPCR ontology: development and application of a G protein-coupled receptor pharmacology knowledge framework. Bioinformatics, 29(24) (2013) 3211-3219.
- S. Koehler, S. C. Doelken, and C. J. Mungall, The human phenotype ontology project: linking molecular biology and disease through phenotype data. Nucleic Acids Research, 42(D1)(2014) 966-974.
- M. Ivanovic and Z. Budimac, An overview of ontologies and data resources in medical domains. Expert Systerms and Applications, 41(11)(2014) 5158-15166.
- A. Hristoskova, V. Sakkalis, and G. Zacharioudakis, Ontology-driven monitoring of patient's vital signs enabling personalized medical detection and alert. Sensors, 14(1)(2014) 1598-1628.
- M. A. Kabir, J. Han, and J. Yu, User-centric social context information management: an ontology-based approach and platform. Personal and Ubiquitous Computing, 18(3)(2014) 1061-1083.
- Y. L. Ma, L. Liu, K. Lu, B. H. Jin, and X. J. Liu, A graph derivation based approach for measuring and comparing structural semantics of ontologies. IEEE Transactions on Knowledge and Data Engineering, 26(3)(2014) 1039-1052.
- Z. Li, H. S. Guo, Y. S. Yuan, and L. B. Sun, Ontology representation of online shopping customers knowledge in enterprise information. Applied Mechanics and Materials, 483(2014) 603-606.
- R. Santodomingo, S., Rohjans, M. Uslar, J. A. Rodriguez-Mondejar, and M.A. Sanz-Bobi, Ontology matching system for future energy smart grids. Engineering Applications of Artificial Intelligence, 32(2014) 242-257.
- T. Pizzuti, G. Mirabelli, M. A. Sanz-Bobi, and F. Gomez-Gonzalez, Food Track & Trace ontology for helping the food traceability control. Journal of Food Engineering, 120(1)(2014) 17-30.
- N. Lasierra, A. Alesanco, and J. Garcia, Designing an architecture for monitoring patients at home: Ontologies and web services for clinical and technical management integration. IEEE Journal of Biomedical and Health Informatics, 18(3)(2014) 896-906.
- Y. Y.Wang, W. Gao, Y. G. Zhang, and Y. Gao,Ontology similarity computation use ranking learning Method.The 3rd International Conference on Computational Intelligence and Industrial Application,Wuhan, China, 2010, pp.20-22.
- X.Huang, T. W. Xu, W. Gao, and Z. Y. Jia,Ontology similarity measure and ontology mapping via fast ranking method.International Journal of Applied Physics and Mathematics, 1(2011)54-59.
- W.Gao, and L.Liang,Ontology similarity measure by optimizing NDCG measure and application in physics education.Future Communication, Computing, Control and Management,142(2011)415-421.
- Y.Gao,and W.Gao,Ontology similarity measure and ontology mapping via learning optimization similarity function.International Journal of Machine Learning and Computing,2(2)(2012)107-112.
- X.Huang, T. W.Xu,W.Gao,and S.Gong,Ontology similarity measure and ontology mapping using half transductive ranking.In Proceedings of 2011 4th IEEE international conference on computer science and Information technology, Chengdu, China,2011, pp.571-574.
- W. Gao, Y. Gao, and L. Liang, Diffusion and harmonic analysis on hypergraph and application in ontology similarity measure and ontology mapping. Journal of Chemical and Pharmaceutical Research, 5(9)(2013) 592-598.
- W. Gao and L. Shi, Ontology similarity measure algorithm with operational cost and application in biology science. BioTechnology: An Indian Journal, 8(11)(2013) 1572-1577.
- W. Gao and T. W. Xu, Ontology similarity measuring and ontology mapping algorithm based on MEE criterion. Energy Education Science and Technology Part A: Energy Science and Research, 32(3)(2014) 3793-3806.
- W.Gao, Y. Gao, and Y. G. Zhang,Strong and weak stability of k-partite ranking algorithm.Information,15(11A)(2012)4585-4590.
- W.Gaoand T. W. Xu, Stability analysis of learning algorithms for ontology similarity computation.Abstract and Applied Analysis, 2013, 9 pages, http://dx.doi.org/10.1155/2013/174802.
- W. Gao and L. L. Zhu, Gradient learning algorithms for ontology computing. Computational Intelligence and Neuroscience, 2014, 12 pages, http://dx.doi.org/10.1155/2014/438291.
- W.Gao,L. Yan, and L. Liang,Piecewisefunctionapproximationand vertexpartitioningschemes formulti-dividingontologyalgorithm in AUCcriterionsetting (I).International Journal of Computer Applications in Technology, 50 (3/4)(2014)226-231.
- L. Grosenick, B. Klingenberg, K. Katovich, B. Knutson, J. E. Taylor, Interpretable whole-brain prediction analysis with GraphNet, Neuroimage, 2013, 72: 304-321.
- N. Craswell and D. Hawking, Overview of the TREC 2003 web track. Proceeding of the Twelfth Text Retrieval Conference, Gaithersburg, Maryland, NIST Special Publication, 2003, pp. 78-92.


