
Journal of Numerical Analysis and Applied Mathematics, Vol. 1, No. 2, November 2016 Publish Date: Oct. 19, 2016 Pages: 30-34
Mathematical Modelling of Blood Flow in Aneurysm of Large Artery
Mohammed Musad*
Oil and Minerals Faculty, University of Ade, Aden, Yemen
Abstract
In this research paper a mathematical models have been developed to study the effect of aneurysm on blood flow. The artery under consideration for the development of model is cylindrical with an axially symmetric aneurysm and fully of blood. The blood assumed to be Newtonian fluid with constant viscosity µ and constant density![]() . The results indicated that the size of aneurysm has directly proportional relation with pressure difference, and inversely proportional relation with velocity. While the size of aneurysm has irregular relation with wall shears stress, shear rate and flow rate of blood, where every one of them has maximum value at R=1.6r.
. The results indicated that the size of aneurysm has directly proportional relation with pressure difference, and inversely proportional relation with velocity. While the size of aneurysm has irregular relation with wall shears stress, shear rate and flow rate of blood, where every one of them has maximum value at R=1.6r.
Keywords
Symmetrical Aneurysm, Wall Shear Stress, Pressure Difference, Blood Flow
Received: August 20, 2016
Accepted: September 18, 2016
Published online: October 19, 2016
@ 2016 The Authors. Published by American Institute of Science. This Open Access article is under the CC BY license.http://creativecommons.org/licenses/by/4.0/
1. Introduction
The flow of blood in large arteries considered as Newtonian flow [1]. The Newtonian approximation for blood is acceptable in modelling flow in large arteries, normally, when shear rate of flow is greater than 100-1 [2] and [3].
Newtonian flow is defined as that flow where shear stress is directly proportional to shear rate. This mean that when shear stress is plotted against shear rate at a given temperature the plot shows a straight line with a constant slop, this slop is called the viscosity of fluid, also Newtonian flow can be defined as the flow in which the coefficient of viscosity is constant [4].
Aneurysm is an enlarged the size of arteries caused by a weakening of the arteries wall. This weakening can lead to rupture of blood artery at aneurysm location, which can cause internal bleeding and stooped the blood supply. For instance, rupture an aneurysm in the artery which is supplying the blood to brain, can bring strokes, likewise rupture in abdominal artery leads to death from internal bleeding [5].The relation between the aneurysm and hemodynamic of blood flow is considered the interest subject of researchers. [6] have suggested that, irregular shear stress of wall is one of the factors which contribute to the weakening of the wall tissue. [7] have reported that low wall shear stress is related to the growth of aneurysm, and rupture.[8] have observed that the aneurysm growth occur in regions of low wall shear stress. The blood flow in the aneurysm artery was considered as Newtonian flow [9], [10], [11], [12], and [13].
There are many physical reasons, why the increase radius of aneurysm can lead to rupture. All are related to the shear stress [14].
2. Geometry of the Model
Figure (1) presents the geometry of the model which is showing an aneurysm artery. The aneurysm introduced into the geometry is made to be axis symmetrical i.e symmetrical around the axis of artery.
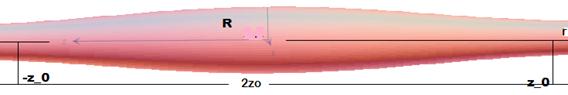
Figure 1. The geometry of aneurysm artery and coordinate system of flow.
The boundary of the aneurysm is represented by the following equation.
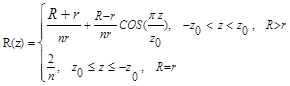 (1)
(1)
From figure (1) and equation (1), it is clear that 2z0 is the aneurysm length through which the blood flows; r is the normal radius of artery, n is integer number related to the a standard radius and R is the radius of aneurysm.
3. Developed the Model
We consider the blood flow through cylindrical with an axially symmetric aneurysm artery. The blood assumed to be Newtonian fluid and homogenous with constant viscosity µ and constant density![]() . This flow can be characterized by the following equation.
. This flow can be characterized by the following equation.
![]() , (2)
, (2)
Then based on the equations of motion in cylindrical polar coordinates, the axial velocity in aneurysm is function of R and z. and can be determined by the following equation.
![]() (3)
(3)
![]() Is constant, then Eq. (3) can be reduced to
Is constant, then Eq. (3) can be reduced to
![]() (4)
(4)
Integrate Eq. (4) with respect to r, and divided both side by r we get
![]() (5)
(5)
On the axis the velocity is finite, then c=0, Eq.(5) will written as
![]() (6)
(6)
Substitute Eq. (2) in Eq. (6) and put r = R(z) we get
![]() (7)
(7)
From Eq. (1), Eq. (7) and figure (1), it is clear that shear stress is maximum at the wall, and finite at the axis. Then at z = ±z0, R = r,![]() and shear stress
and shear stress![]() .
.
Also in case of aneurysm, wall shear stress is maximum at the wall where –z0<z<z0 and R>r. Then the wall shear stress along the aneurysm can be modelled as function of R. This can be find by remove the corresponding values of shear stress at z = ±z0 from Eq. (7). And then integrate it with respect to z as follow
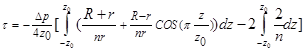 (8)
(8)
![]() (9)
(9)
From Eq.(9) it is clear![]() at R=r.
at R=r.
In case of aneurysm, a larger the radius and the concomitant larger a cross sectional area, leads to a larger pressure. Then according to Bernoulli’s equation, the blood flow needs pressure difference to drive the blood along the aneurysm ∆![]()
![]() (10)
(10)
Substitute Eq. (10) in Eq. (9) we get
![]() (11)
(11)
Equation (11) is the model of wall shear stress in case of aneurysm artery, which is function of R. Where τ is the wall shear stress, r is the normal radius of artery,![]() is the density of blood, v is the initial velocity of blood, n is integer number related to the slandered radius and R is the radius of aneurysm.
is the density of blood, v is the initial velocity of blood, n is integer number related to the slandered radius and R is the radius of aneurysm.
Also from Eq. (11), the flow rate volume of blood can be model as
![]() (12)
(12)
Equation (12) is the model of volume flow rate of blood across the section of aneurysm artery, which is function of R. Where Vstrokeis the stroke volume or the heart pumps which is equals 90 cm3 [14], M is the number of arteries which is having the same radius, r is the normal radius artery, ![]() is the density of blood, v is the initial velocity of blood, n is integer number related to the standard radius,
is the density of blood, v is the initial velocity of blood, n is integer number related to the standard radius, ![]() is the viscosity of blood and R is the radius of aneurysm.
is the viscosity of blood and R is the radius of aneurysm.
4. Results and Conclusion
Equation (11) has been solved by using mathematical software program called (Microsoft Math) for R=1.3r to R=2r. Table (1), presents the wall shear stress and pressure difference of aneurysm artery. While table (2), presents the shear rate of aneurysm artery. The results listed in tables (1-2), indicated that the wall shear stress has a maximum value at R=1.6r and shear rate so. Also it is clear that increase the radius of aneurysm from R=1.3r to R=1.6r lead to increase the wall shear stress, but increase R more than 1.6 times r leads to decrease wall shear rateand wall shear stress so. While increase the radius of aneurysm more than 1.6 of normal radius r, lead to increase pressure difference which suppresses wall shear stress and wall shear rate so.
Also to estimate flow rate volume across an aneurysm of artery, equation (12) has been solved for R=1.3r to R=2r, where initial velocity considered to be 1cm/s,![]() = 0.04 dynes/cm2, n=2,
= 0.04 dynes/cm2, n=2,![]() =1.06 g/cm3 and the total volume of blood (4950cm3) is pumped through the body every 55s or 90cm3/s. The velocity in aneurysm artery has been calculated by using the formula v2= Qt /A2. Table (3), presents the volume of flow rate and the velocity of blood for aorta in case of aneurysm, and table (4), presents the flow rate and the velocity of blood for artery in case of aneurysm. The results listed in tables (3-4) indicated that, the flow rate volume of blood has maximum value at R=1.6r and the velocity has maximum value at R=1.3r. Also it is observed that, the average of flow rate across the aneurysm sections of aorta is 119 cm3/s, which is greater than the normal flow rate 90cm3/s, this happened because of increase the average heart rate beats from 1/s to 1.3/s. While the average velocity across the aneurysm sections of aorta is 9.5cm/s, which is less than the normal velocity 18 cm/s.
=1.06 g/cm3 and the total volume of blood (4950cm3) is pumped through the body every 55s or 90cm3/s. The velocity in aneurysm artery has been calculated by using the formula v2= Qt /A2. Table (3), presents the volume of flow rate and the velocity of blood for aorta in case of aneurysm, and table (4), presents the flow rate and the velocity of blood for artery in case of aneurysm. The results listed in tables (3-4) indicated that, the flow rate volume of blood has maximum value at R=1.6r and the velocity has maximum value at R=1.3r. Also it is observed that, the average of flow rate across the aneurysm sections of aorta is 119 cm3/s, which is greater than the normal flow rate 90cm3/s, this happened because of increase the average heart rate beats from 1/s to 1.3/s. While the average velocity across the aneurysm sections of aorta is 9.5cm/s, which is less than the normal velocity 18 cm/s.
Studying the effect of aneurysm on blood flow has been performed. It is clear that the effect of aneurysm on blood flow started at R=1.3r. Where increasing the radius of aneurysm lead to increase the pressure difference and decrease the velocity. While wall shear stress, wall shear rate and flow rate of blood are irregular, and each of them have maximum value at R=1.6r. Also it is observed that, the suitable range of aneurysm radius, which maintaining the steady flow of blood along the aneurysm artery is, from R = 1.1r to R = 1.6r. But increase R more than 1.6 times the normal radius r of artery, maybe lead to change the shape of aneurysm and make it approach to spherical, and this lead to re-model the geometry shape of aneurysm and also re-model the flow of blood.
Table 1. Estimated wall shear stress and pressure difference in aneurysm artery for n = 2, r = 0.4cm, v =10cm/s and density ![]() = 1.06 g/cm3.
= 1.06 g/cm3.
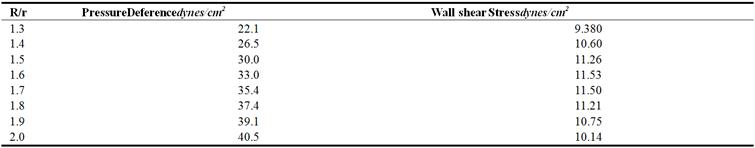
Table 2. Estimated wall shear rate![]() in aneurysm artery for viscosity
in aneurysm artery for viscosity ![]() = 0.04 dynes.s/cm2 and density
= 0.04 dynes.s/cm2 and density ![]() = 1.06 g/cm3.
= 1.06 g/cm3.![]() .
.
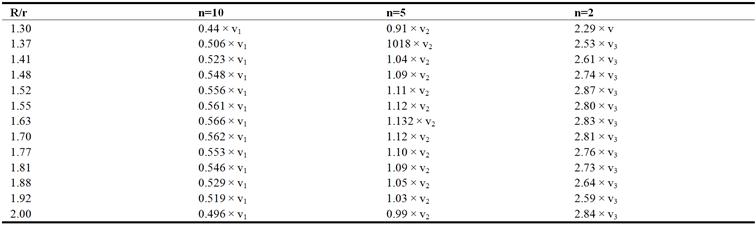
Table 3. Estimated the flow rate and velocity of blood across an aneurysm of aorta, for "Vstroke = 90 [14]", M =1, n =2, r =1.25cm, initial velocity v = 1cm/s, viscosity ![]() = 0.04 dynes.s/cm2 and density
= 0.04 dynes.s/cm2 and density ![]() = 1.06 g/cm3.
= 1.06 g/cm3.
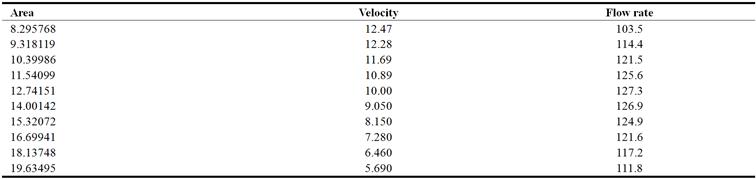
Table 4. Estimated the flow rate and velocity of blood across an aneurysm of arteries, for "Vstroke = 90 [14]", M =40, n =2, r =0.4cm, initial velocity v = 1cm/s, viscosity ![]() = 0.04 dynes.s/cm2 and density
= 0.04 dynes.s/cm2 and density ![]() = 1.06 g/cm3. v2 = Qt/A2.
= 1.06 g/cm3. v2 = Qt/A2.
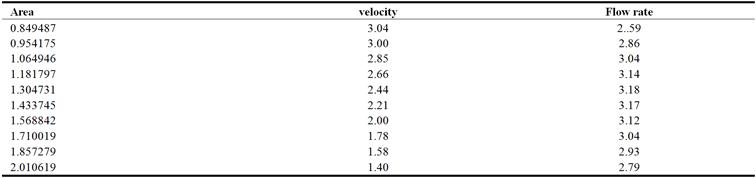
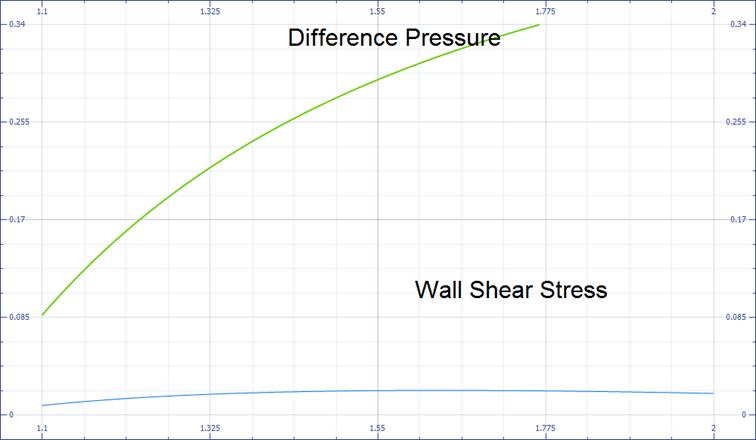
Figure 2. Graph of distribution of wall shear stress and pressure difference with respect to R.
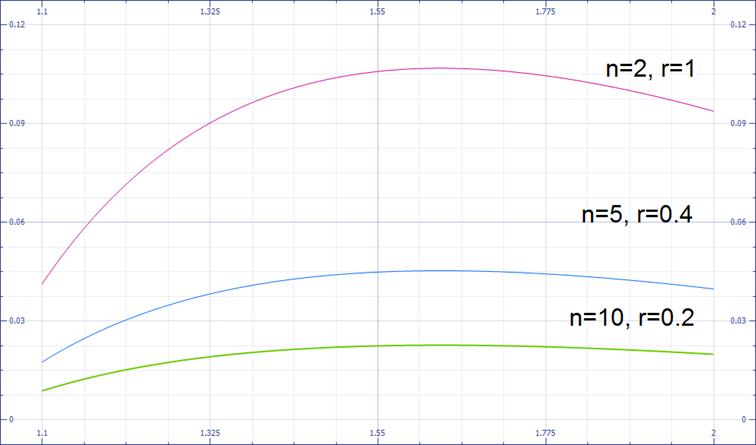
Figure 3. Graph of distribution of wall shear stress with respect to R/r, for different values of n.
References
- Hershey D, Cho S. J. (1966), Blood flow in rigid, tubes thickness and slip. Velocity of plasma film at the wall. J. Appl. Physiology. Vol. 21, 27-32.
- Fei D. Y, Thomas J. D and rittgers S. E. (1994), the effect of angle and flow rate upon hemodynamic in distal vascular graft anastomoses: a numerical model study, journal of biomechanical engineering 116: 331-336.
- Song M. H, Sato M, Ueda Y, (2000), Three dimensional simulation of coronary artery bypass grafting, with the use of computational fluid dynamics, Surg. Today 30: 993-998.
- Mohammed Musad (2012).Mathematical Modeling of Blood Flow though Stenosed Arteries, ISBN 978-3-8484-3286-8, LAP Lambert Academic Publishing GmbH & Co. KG.
- Sheard G. J, Ryan K (2008). Wall Shear Stress and Flow Stability in A model Fusiform Aneurysm,ANZIAM.J. 50:C1-C15.
- Kondo S, Hashimoto N, Kikuchi H, Hazama F, Nagata I, and Kataoka H (1997). Cerebral Aneurysm Arising at Non-branching Site. An experimental study.Stroke: 28:393-404.
- Shojima M, Oshima M, Takagi K, Torii R, Hayakawa M, Katada K, Morita A, and Kirino T (2004). Magnitude and Role of Wall Shear Stress on Cerebral Aneurysm Computational Fluid Dynamic Study of 20 Middle Cerebral Aneurysm,Stroke: 35.2500-2505.
- Loic Boussel, Vitaliy Rayz, Charles McCulloch, Alastair Martin, Gabriel, Acevedo-Bolton, Michael Lawton, Randall Higashida, Wade S. Smith, William L (2008). Aneurysm Growth Occurs at Region of Low Wall Shear Stress: Patient-Specific Correlation of Hemodynamics and Growth in a Longitudinal Study.Stroke: 3. 2997-3002.
- Hakon Osterabo (2013). The Effects of Heart Rate on Blood Flow in Intracranial Aneurysm.July.Onlinehttp://folk.uio.no/kentand/haakon_thesis.pdf.
- Vashishath Patel (2011). Impact of Geometry on Blood Flow Patterns in Abdominal Aortic Aneurysm. New Brunswick, New Jersey.
- Endar A. Fino. Amon. Crastina H (2001). Blood flow in Abdominal Aorta Aneurysm, Pulsatile Flow Hemodynamic.ASME: 123.474-484.
- M. R. Levitt, P. M. McGah, A. Aliseda, P. D. Mourad, J. D. Nerva, S. S. Vaidya, R. P. Morton, B. V. Ghodke, and L. J. Kim (2014). Cerebral Aneurysms Treated with Flow-Diverting Stents: Computational Models with Intravascular Blood Flow Measurements.AJNR Am J Neuroradiol 35:143–148.
- Chao Wang, ZhongbinTian Jian Liu, Linkai Jing, Nikhil Paliwal, Shengzhang Wang, Ying Zhang, Jianping Xiang, Adnan H. Siddiqui, HuiMeng and Xinjian Yang, (2016). Flow diverter effect of LVIS stent on cerebral aneurysm hemodynamics: a comparison with Enterprise stents and the Pipeline device. Wang et al. J Transl Med: 14:199.
- Irving. P. Herman (2007). Physics of the Human Body, Springer Berlin Heidelberg.


