
Systems Science and Applied Mathematics, Vol. 1, No. 2, October 2016 Publish Date: Sep. 23, 2016 Pages: 23-28
Mathematical Model of the Social Dissatisfaction Level for Research of Social and Economic System of Denmark
Nadezhda A. Zhuravleva1, *, Michel Yu. Dolomatov1, 2, Vitalij V. Martynov1, Elena Sh. Zakieva1, Victor I. Rycov1, Natalja V. Dzinter1, Stepan I. Ermilov1
1Department of Economic Informatics, Ufa State Aviation Technical University (USATU), Ufa, Russia
2Department of Oil and Gas Engineering, Ufa State Petroleum Technological University (USPTU), Ufa, Russia
Abstract
The article is devoted to the creation of tools for the assessment of the level of social dissatisfaction. The model of the assessment is carried out on the base of one factor (the index of social dissatisfaction based on income differentiation). The scope of application of the results of this study is to support decision-making by planning of the socio-economic development. Evaluation of methodological tools was carried out on the example of the Denmark, which showed the dynamics in the levels of social-economic dissatisfaction (2000 – 2014). Social dissatisfaction in Denmark was absent in this period.
Keywords
Mathematical Model, Assessment of the Levels of Social Dissatisfaction, Income Distribution
Received: August 15, 2016
Accepted: August 31, 2016
Published online: September 23, 2016
@ 2016 The Authors. Published by American Institute of Science. This Open Access article is under the CC BY license. http://creativecommons.org/licenses/by/4.0/
Contents
1. Introduction
Designing of mathematical models that demonstrate the level of social dissatisfaction is one of the most important goals of security services, social technologies and political science. Despite a lot of research conducted in this area, the problem in question is still of high importance due to the lack of practical application of the existing models at the governmental level.
The purpose of this work is to develop a mathematical model of social tension assessment that would serve as a means of preventing social conflicts. There are researches
The mathematical models, suggested in this research, can be utilized by various organizations and institutions, for instance, by the Security Service for designing security measures, by politicians and economists for decision-making purposes in the sphere of regulating distribution and redistribution of government revenues, as well as other professional domains, related to governmental processes. Besides, the algorithmic method proposed in the study can be useful for the organizations that specialize in conflicts studying (Center of Conflictology, Mediation Center, etc.).
Social dissatisfaction as a phenomenon exists in any group or team irrespective of its level. It may be found within an organization, a region, or at the state level. Pirogov [1] understands social dissatisfaction as a characteristic of the state of a social system, which can be described as an increase in instability due to the violation of the rights of individuals.
In other research papers, devoted to this subject [2-14], the wording of the concept of «social dissatisfaction» is replaced by the synonymous term of «social polarization», which means inequality, or fractionalization.
There are general index of polarization [11], the Hirschman-Herfindahl fractionalization index, Reynal-Querol index, The Theil inequality index. In the articles by Fusco and Silber, social polarization is understood as the distance between various social groups. Zhang and Kanbur [4] adjusted Theil 's formula in terms of intragroup and intergroup interaction.
In other studies [4, 9] the authors emphasize the distinction between the social concepts of inequality and polarization. The authors suggest using the following inequality indicators: the Gini's coefficient and the generalized entropy (GE – Generalized Entropy). The indicators of polarization (ER – Esteban-Ray index, W – Wolfson index, TW – Tsui-Wang index) are mentioned in these studies as well. In this work, the authors [9] also emphasize the difference between inequality and polarization.
Within the context of the current research, social dissatisfaction is understood as a special condition of public consciousness and interactions between the subjects, as well as a specific state of the perception of reality. In this case, social dissatisfaction is considered to be the generalized characteristic of a conflict situation; it is characterized by a high level of people’s dissatisfaction, caused by some factor.
Up to a certain point, social dissatisfaction does not constitute a threat; but there is a critical value of social dissatisfaction, the excess of which may result in conflicts, uprisings and wars. Oftentimes, dissatisfaction increases slowly, until there are particular events that act as a trigger and make a feeling of disappointment erupt outside.
Besides, for a real conflict to occur, there should be some conditions and resources necessary for the organized group activities. Lack of such resources can inhibit the emergence of open conflicts, a conflict in that case may remain latent. According to the theory of plurality of conflicts by L. Coser, the greatest threat to the dynamics of evolutionary processes in social system is connected with a growing tension level, which may result in the polarization of social groups’ interests and escalation of conflict to a higher level.
Thus, the analysis of literature has shown that no model has so far existed that was designed for the assessment of the level of social dissatisfaction according to some factor, the model that would not rely on sociological poll results and could allow the continuous monitoring of the level of social dissatisfaction to be conducted practically cost-free.
The object of the research is social dissatisfaction in society. The scope of the research did not include the study of interactions leading to open conflicts.
2. Data and Methods
The assessment of the social dissatisfaction level is one of the most important goals of Security services, organizations that focus on social technologies and political science. The results of the research may be used for the development and implementation of optimal strategies of conflict prevention. Although there is a lot of research work in the field, there emerged a necessity of designing alternative assessment techniques, for most of the existing ones are time-consuming and expensive.
Tension within society exists at different governmental levels and in the majority of the countries in the world. In view of this, it becomes important to develop a set of indicators of social dissatisfaction as part of the system of social and economic development indicators.
The model of social tension (dissatisfaction) was used in the current study: model of social dissatisfaction based on income differentiation.
The authors of the current research have developed the information system for calculations linked to the suggested model [18].
3. Model of Social Dissatisfaction Based on Income Differentiation
The core principle of the income-based social dissatisfaction research methodology relies on the Boltzmann distribution that is utilized in statistical physics. Previously, the Boltzmann distribution was used for the assessment of sustainability of social and economic systems [17]. In accordance with this principle, the equilibrium condition of a closed system is associated with maximum entropy and any deviation from equilibrium results in a non-equilibrium system, also known as social dissatisfaction. In this case, social dissatisfaction is assessed with the help of the Boltzmann principle and is calculated as the difference between the actual income level and the income based on the log-normal distribution model, which illustrates the equilibrium of a socio-economic system. The assessment model of income-based social dissatisfaction is written as:
![]() , (1)
, (1)
where ![]() is the index of social dissatisfaction, ISD, (Fig. 1);
is the index of social dissatisfaction, ISD, (Fig. 1);
![]() - frequency of empirical distribution of the population for each year in the
- frequency of empirical distribution of the population for each year in the ![]() -th income group;
-th income group;
![]() - frequency of theoretical distribution (8) of the population for each year in the
- frequency of theoretical distribution (8) of the population for each year in the ![]() -th income group.
-th income group.
The most likely distribution of household income that has a clear thermodynamic grounding and is characteristic of the equilibrium state, is a normal distribution of income, with respect to which the indicator of the level of social tension on income differentiation is calculated [19]. We will provide some examples to illustrate it later.
Consider a closed macroeconomic system with the volume of gains V, separated from the environment in which the economic agent acts. Suppose that the system interacts with the environment through the exchange of money. Let the number of agents be N. Single out from this amount those groups that have a similar ability to exchange N1, N2,... Ni, and whose share of income is C1, C2,... Ci respectively. In this case we have:
![]() , (2)
, (2)
where n is the number of groups of entities. We introduce another characteristic of complex systems, i.e. a function of the state of the entity, which denotes financial potential![]() . Given the state has a constant volume of income and entities of the economy it is a function of one variable, that is income. Obviously, changes in the income of one entity will cause correspondingly a slight change in the function of state and will amount to
. Given the state has a constant volume of income and entities of the economy it is a function of one variable, that is income. Obviously, changes in the income of one entity will cause correspondingly a slight change in the function of state and will amount to ![]() . This small amount is proportional to the share of the entity income:
. This small amount is proportional to the share of the entity income:
![]() , (3)
, (3)
where ![]() is a constant that depends on the method of measuring the financial potential (e.g. exchange rate). In further calculations, for the sake of convenience we assume
is a constant that depends on the method of measuring the financial potential (e.g. exchange rate). In further calculations, for the sake of convenience we assume ![]() = 1. Divide the variables and integrate them:
= 1. Divide the variables and integrate them:
![]() . (4)
. (4)
We have the following:
![]() . (5)
. (5)
Integrating and separating the variables, we obtain the law of normal distribution for financial potentials:
 , (6)
, (6)
where ![]() and
and ![]() are the financial potential of entities and average financial potential of all system entities;
are the financial potential of entities and average financial potential of all system entities; ![]() is dispersion of income within a macro system. Taking into account the relationship (2) we obtain from (3) the law of log-normal distribution (Pareto's law):
is dispersion of income within a macro system. Taking into account the relationship (2) we obtain from (3) the law of log-normal distribution (Pareto's law):
 . (7)
. (7)
The obtained equation is the law of lognormal distribution of income under conditions of equilibrium; a deviation from it is a measure of the economic system non-equilibrium.
In this case, the formula for calculation ![]() is as follows:
is as follows:
![]() , (8)
, (8)
where ![]() is the dispersion, and it is calculated with the help of the following formula:
is the dispersion, and it is calculated with the help of the following formula:
 , (9)
, (9)
where ![]() is the level of income within the j-th group;
is the level of income within the j-th group;
![]() is the average income level within the j-th group.
is the average income level within the j-th group.
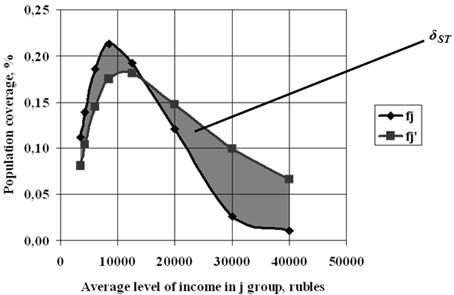
Fig. 1. Graphic sense of Index of social dissatisfaction (ISD), calculated according to income distribution.
Assessment of social dissatisfaction, illustrated by this model, is carried out with the help of the following algorithm:
1. Primary acquisition is the population’s income distribution on an annual basis. In the current study, the basic data are taken from the public domain, in particular, from the database StatBank Denmark (http://www.statbank.dk/).
2. Theoretical distribution of the population income is calculated, using the data of the actual income distribution with the help of the formula (7).
3. Eventually, the value of social dissatisfaction is calculated according to the designed model (1) (Table 3, 4; Figure 2).
The number of people who demonstrate high levels of dissatisfaction due to the deviation from equilibrium can be calculated by multiplying the index of social dissatisfaction by the population:
![]() , (10)
, (10)
where N is the number of people whose data were used in the research (in the case of social dissatisfaction at the federal level – the number of people in the country was used). For the calculation of social dissatisfaction at the regional level the researchers used the number of people in the region, whereas for the calculation of social dissatisfaction at the organizational level – the number of people in an organization was taken).
In this article the critical value of the proposed indicator is accepted to be 0.33 and is based on the studies existing in the field of research [20].
Social dissatisfaction does not present a threat up to a certain point; however, there is a critical value of social dissatisfaction the excess of which may lead to conflicts, uprisings and wars. Oftentimes, the process of dissatisfaction growth occurs slowly until there is a particular event that acts as a trigger mechanism, causing frustration.
Using this approach, the authors of the study have designed the information system of assessing social dissatisfaction level, which includes the model of assessing income-based social dissatisfaction and the model of complex assessment of social dissatisfaction [19].
4. Results
The ISD index calculation.
As a result of this study, the ISD index has been calculated. The calculations of social dissatisfaction in Denmark (Tables, Figures) were performed by means of the method developed on the basis of this study.
The primary data for ISD calculations in Denmark from 2000 to 2014 are presented in Table 1.
The primary data for ISD calculations in 2014 are presented in Table 2. For a distortion exception in calculations of ISD profitable groups, the population sum in which makes less than 5% of total number, are excluded from basic data.
Table 1. Income distribution in Denmark from 2000 to 2014.
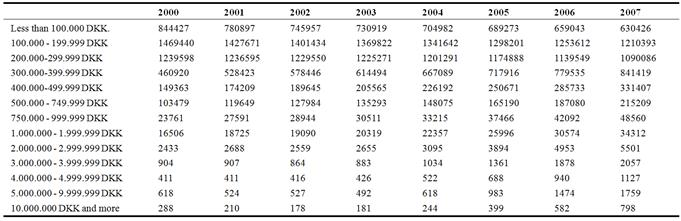
Table 1. Continue.
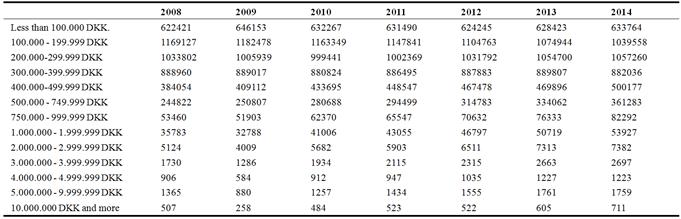
Table 2. Primary data for ISD calculation in Denmark at 2014.
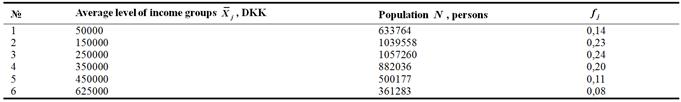
Table 3. ISD calculation in Denmark at 2014.
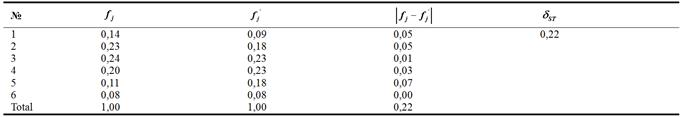
Fig. 2. Frequency of empirical (![]() ) and theoretical (
) and theoretical (![]() ) distribution for ISD calculation in Denmark in 2014.
) distribution for ISD calculation in Denmark in 2014.
Table 4. Inequality indices based on income in Denmark.
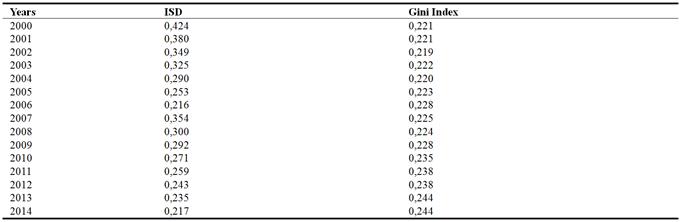
Besides the ISD values, the graph of the Gini index dynamics is shown in table 4 and in fig. 3.
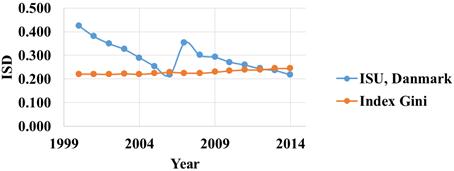
Fig. 3. Inequality indices based on income in Denmark.
5. Discussion and Implications
Since 2000 to 2007, ISD decreased. In 2007 the index has raised, as it is known in 2007 the world financial crisis has begun1. During the period from 2007 to 2014 is also observed the decrease of ISD. In spite of the fact that the measure value in some years exceeds critical value, manifestations of discontent of the population during the researched period are absent. It can be explained with the fact that excess of an index are extremely insignificant, and also high level of living of all country (http://catalog.fmb.ru/denmark2010-3.shtml). In Denmark the highest average level of a salary among EU countries, medical services are free. System of social security of Denmark - one of the most developed in Europe. Living level of people with the low income is also high and therefore the reasons to discontent are little to cause national nervousness.
Gini Index in period from 2000 to 2014 increased continuously, but very small (from 0.22 to 0.24). At the same time in 2007, 2008, the index decreased, although at 2007 and 2008 GDP in Denmark was negative, other socio-economic indicators also showed a state of crisis.
Therefore, ISD more accurately reflects the socio-economic situation.
In general, both indicators (ISD and Gini Index) can characterize social dissatisfaction levels in Denmark within the period from 2000 to 2014 as low.
Thus, the comparison of the results of the scientific analysis with the results of the theoretical and pilot experiments showed that the indicator of social dissatisfaction in the Denmark, calculated by means of the developed model, is dependent on the events that occurred within the studied period of time. The results can be characterized as adequate, and therefore they allow the trends of social dissatisfaction to be analyzed and the measures of conflict prevention to be proposed.
6. Conclusions
As a result of the current research, the mathematical model of assessing social dissatisfaction has been created for the purpose of preventing conflicts. The integrated indicators, proposed in this work, are free from political bias and objectively reflect the role of the socio-economic situation on a national and regional scale over a wide range of time.
The study uses the data from open sources issued by the Federal Statistics Agency; the poll results have not been used in the research. The social dissatisfaction assessment index calculated for the Denmark can be used to measure the probability of civil disorders or wars. The information system that represents mathematical methods proposed by this study can be used for the assessment of the socio-economic development of the Denmark based on a set of key indicators. This system may be employed by executive authorities, in organizations of statistics or other governmental structures.
Acknowledgments
This work was supported by the Ministry of Education and Science of the Russian Federation under the state contract as of 10.10.2013, № 14.514.11.4113 under the Federal Target Program "Research and Development in Priority Fields of the Science and-Technology Complex of Russia for 2007-2013".
References
- Pirogov, I. V. (2002). Social unsatisfaction: Theory, methodology and measurement methods: Dis. PhD social sciences. Moscow, 177.
- Esteban, J. & Ray, D. (1994). On the Measurement of Polarization. Econo-metrica, vol. 62 (4), 819–851.
- Esteban, J. & Ray, D. (1999). Conflict and Distribution. Journal of Economic Theory, vol. 87 (2), 379–415.
- Zhang, X. & Kanbur R. (2001). What Difference Do Polarisation Measures Make? An Application to China. The Journal of Development Studies, 37 (3), 85-98. doi: 10.1080/00220380412331321981.
- Biancotti, C. (2006). A polarization of inequality? The distribution of national Gini coefficients 1970–1996. Journal of Economic Inequality: Springer, 4, 1–32.
- Woo, J. (2006). Fiscal Deficit, Fiscal Volatility and Growth: Social Polarization. The Political Economy of Fiscal Policy. Lecture Notes in Economics and Mathematical Systems. Springer, vol. 570, 7-33. doi: 10.1007/3-540-31417-2_2.
- Woo, J. (2006). Inflation, Composition of Deficit Finance, and Social Polarization. The Political Economy of Fiscal Policy. Lecture Notes in Economics and Mathematical Systems. Springer, vol. 570. 35-45. doi: 10.1007/3-540-31417-2_3.
- Esteban, J. & Gradyn, C. & Ray D. (2007). An Exunsatisfaction of a Measure of Polarization, with an application to the income distribution of five OECD countries. J Econ Inequal, Springer, vol. 5, 1–19. doi: 10.1007/s10888-006-9032-x.
- Esteban, J. & Schneider, G. (2008). Polarization and Conflict: Theoretical and Empirical Issues. Journal of Peace Research, vol. 45, 131-141. doi: 10.1177/0022343307087168.
- Esteban, J. & Ray, D. (2011). Comparing Polarization Measures. Oxford Handbook of the Economics of Peace and Conflict, Oxford University Press. Retrieved from http://www.nyu.edu/econ/user/debraj/Papers/EstRayChapter.pdf.
- Esteban, J. & Ray D. (2011). Linking Conflict to Inequality and Polarization. American Economic Review, American Economic Association, vol. 101 (4), 1345-1374.
- Esteban, J. & Mayoral, L. & Ray D. (2012). Ethnicity and Conflict: An Empirical Study. American Economic Review, American Economic Association, vol. 102 (4), 1310-1342.
- Permanyer, I. (2012). The conceptualization and measurement of social polarization. The Journal of Economic Inequality. Springer US, vol. 10, issue 1, 45-74.
- Fusco, A. & Silber, J. (2014). On social polarization and ordinal variables: the case of self-assessed health. Eur J Health Econ. Springer-Verlag Berlin Heidelberg, vol. 15 (8), 841-851. doi: 10.1007/s10198-013-0529-5.
- Sonin, K. (2011). Sonin.ru: Economy lessons. Moscow: United Press. 255.
- Montalvo, J. G. & Reynal-Querol, M. (2010). Ethnic Polarization and the Duration of Civil Wars, Economics of Governance, vol. 11 (2). 123-143.
- Dolomatov, M. Yu. (2005). Fragments of the theory of real substance. From hydrocarbonic systems to galaxies. Moskow: Chemistry. 208.
- Dolomatov, M. Yu. & Zhuravliova, N. A. (2013). Information system of an social dissatisfaction assessment. Certificate of computer program registration No. 2013661801.
- Dolomatov, M. Yu. & Martynov, V. V. & Zhuravleva, N. A. & Filosova, E. I. & Zakieva, E. Sh. (2015). Information system of an assessment of social dissatisfaction level based on equilibrium thermodynamics laws. Труды СПИИРАН, vol. 4 (41). Retrieved from http://proceedings.spiiras.nw.ru/ojs/index.php/sp/article/view/3152/1816/pdf.
- Yanovsky, R. G. (1999). Global changes and social safety. Moscow: Academia, 44.
Footnotes
[1] Тельхигова М. Ш. Влияние мирового финансового кризиса на состояние экономики Дании и перспективы ее дальнейшего развития // Молодой ученый. — 2010. — №3. — С. 137-143.


