
Systems Science and Applied Mathematics, Vol. 1, No. 1, August 2016 Publish Date: Jul. 27, 2016 Pages: 1-7
Financial Analysis on the Company Performance in Malaysia with Multi-Criteria Decision Making Model
Liew Kah Fai1, Lam Weng Siew1, 2, *,Lam Weng Hoe1, 2
1Department of Physical and Mathematical Science, Faculty of Science, UniversitiTunku Abdul Rahman, Kampar Campus, Kampar, Perak, Malaysia
2Centre for Mathematical Sciences, Centre for Business and Management, UniversitiTunku Abdul Rahman, Kampar Campus, Kampar, Perak, Malaysia
Abstract
In stock market investment, an appropriate and accurate financial analysis is needed to be adopted on the evaluation of the company performance. The investors can analyze the financial performance of the company scientifically for their investment by using a multi-criteria decision making model which is Technique for Order of Preference by Similarity to Ideal Solution (TOPSIS) model. The objectives of this study are to evaluate, compare and rank the overall performance of the companies from the financial sector in Malaysia stock market with TOPSIS model. The overall performance of the companies is evaluated in terms of seven financial ratios. In this study, the data consists of 23 companies from the financial sector in Malaysia stock market. The period of study is from year 2012 to 2014. The results show that HWANG, RCECAP, CIMB, AFG and LPI achieve the top five ranking within the study period. This study is significant to the investors because it is able to evaluate and rank the overall performance of the companies from the financial sector in Malaysia by considering all the financial ratios with TOPSIS mathematical model.
Keywords
TOPSIS, Optimal Solution, Ranking, Financial Ratios
Received: June 21, 2016
Accepted: July 1, 2016
Published online: July 27, 2016
@ 2016 The Authors. Published by American Institute of Science. This Open Access article is under the CC BY license. http://creativecommons.org/licenses/by/4.0/
1. Introduction
In stock market investment, the evaluation of the financial companies is very crucial to the investors. The financial performance of the companies measures the level of success of the companies. Li and Sun [1] mentioned that the ranking of companies is a practical tool to ensure the financial strength of the companies. In order to yield a better and accurate result, there are a lot of financial ratios or criteria to be considered. Therefore, current ratio, return on equity (ROE), profit margin, debt to equity ratio, earnings per share (EPS), dividend yield and price earnings ratio (PE) are the important criteria that used in this study. According to Tozum [2], a traditional ratio analysis fails to measure financial performances effectively. Based on the recommendation from Tozum [2], Technique for Order of Preference by Similarity to Ideal Solution (TOPSIS) model is applied in this study.
TOPSIS model is a multi-criteria decision making model which was introduced by Hwang and Yoon [3]. TOPSIS model aims to select the most preferred alternative based on the optimal solution which has the closest distance to the positive ideal solution as well as the farthest distance from the negative ideal solution. The positive ideal alternative is the one which has the best level for all criteria considered whereas the negative ideal alternative is the one which has the worst attribute values and the least desirable among all the alternatives. The objectives of this paper are to evaluate, compare and rank the overall performance of the companies from the financial sector in Malaysia stock market with TOPSIS model. The rest of the paper is organized as follows.The next section describes the literature review of TOPSIS model in the evaluation of company performance. Section 3 discusses about the data and methodology of the study. Section 4 presents the empirical results of this study. Section 5 concludes the paper.
2. Literature Review
Hasanloo et al. [4] evaluated the performance of companies in Iran by ranking the companies with TOPSIS model. There were 12 companies evaluated in their study based on various financial ratios. Yilmaz and Konyar [5] determined the financial performance of nine lodging companies listed in the Istanbul Stock Exchange (ISE) from 2008 until 2011 by using TOPSIS model. The lodging companies that involved in the evaluation were AYCES, FVORI, MAALT, MARTI, METUR, NTTUR, PKENT, TEKTU and UTPYA. The results showed that PKENT achieved the highest rankings in terms of financial performance over the four-years period.
Gündoğdu [6] evaluated the financial performance of foreign banks operating in the Turkish banking sector by using TOPSIS model. The financial ratios of 10 foreign banks were used in his study. Alternatif Bank, Arab Turkish Bank, Burgan Bank, Citibank, Deniz Bank, Deutsche Bank, Finans Bank, HSBC Bank, ING Bank and Turkland Bank were investigated in his study. The results showed that Deutsche Bank achieved the best financial performance in his study.
İşseveroğlu and Sezer [7] investigated the financial performance of the pension companies operating in Turkey with TOPSIS model. The financial performance of the 16 companies was evaluated from year 2008 to 2012. The results showed that TOPSIS model could determine the financial performance of companies effectively in different sectors such as technology, food, automotive and transporting. Cam et al. [8] evaluated the financial performance of nine textile firms in Istanbul from year 2010 until 2013 with TOPSIS model. The textile firms were ATEKS, ARSAN, BISAS, VAKKO, KRTEK, MNDRS, SKTAS, HATEK and DAGI. The results showed that DAGI, ATEKS and HATEK were ranked at the top in their study.
Based on the past research, TOPSIS model is able to evaluate the financial performance of the companies based on multiple criteria in various countries. However, this model has not been studied actively in Malaysia stock market. Therefore, this paper aims to fill the research gap by evaluating the performance of the companies from the financial sector in Malaysia stock market by using TOPSIS model.
3. Data and Methodology
3.1. Data
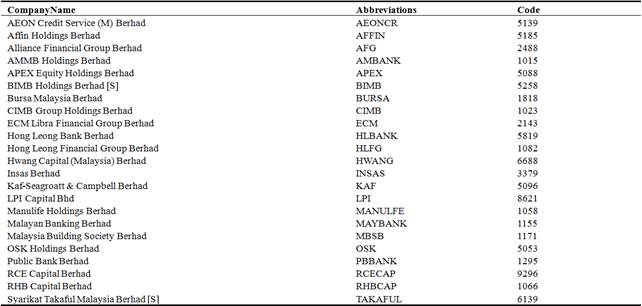
In this study, the data consists of 23 companies from the financial sector listed in Malaysia Main Market which is shown in Table 1.
Table 1. Companies from the Financial Sector in Malaysia Main Market.
There are total seven financial ratios considered in this study, which are current ratio, return on equity (ROE), profit margin, debt to equity ratio, earnings per share (EPS), dividend yield and price earnings (PE) ratio. The data from year 2012 to 2014 are collected from the companies’ financial annual report on Bursa Malaysia. Table 2 presents the description of the financial ratios used in this study.
Table 2. Description of the Criteria Used in the Evaluation on the Company Performance.
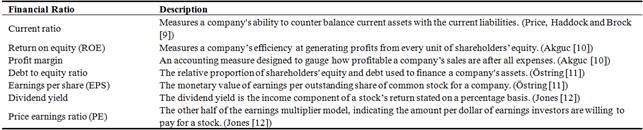
Table 3 presents the formula for the financial ratios used in the evaluation on the company performance (Jones [12]).
Table 3. Formula for the Financial Ratio Used in the Evaluation on the Company Performance.
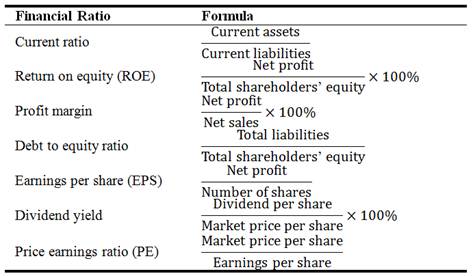
The best ideal alternatives seek the criteria that need to be maximized are current ratio, ROE, profit margin, EPS and dividend yield whereas the criteria that should be minimized are debt to equity ratio and PE ratio.
3.2. Technique for Order of Preference by Similarity to Ideal Solution (TOPSIS)
TOPSIS model is a multi-criteria decision making model which was introduced by Hwang and Yoon [3]. TOPSIS model determines the optimal solution by considering the distance of each criterion from negative and positive ideal solution. The benefit of TOPSIS model is to solve multi-criteria decision-making problems by determining the best alternative. TOPSIS model aims to rank the alternatives and obtain the best alternative in decision-making problem. The best alternative selection has the farthest distance from the negative ideal solution and also has the closest distance to the positive ideal solution. TOPSIS model consists of seven steps as shown below:
Step 1: Formation of decision matrix (![]() ):
):
Construct an evaluation matrix which consists of m alternatives and n criteria. The score of each alternative with respect to each criterion is given as ![]() , and then a matrix
, and then a matrix ![]() is formed as below.
is formed as below.
![]()
 (1)
(1)
Step 2: Formation of normalized decision matrix:
Construct normalized decision matrix ![]() by transforms various attribute dimensions into non-dimensional attributes, which allows comparisons across criteria by using the normalization method as shown below.
by transforms various attribute dimensions into non-dimensional attributes, which allows comparisons across criteria by using the normalization method as shown below.
 (2)
(2)
![]() =
= (3)
(3)
Step 3: Formation of nominal normalized decision matrix (T):
Calculate the weighted normalized decision matrix as follow.
![]() (4)
(4)
where 
![]() and
and ![]() is the original weight given to the indicator
is the original weight given to the indicator![]() , j=1, 2, …,n.
, j=1, 2, …,n.
 (5)
(5)
Step 4: Determination of the positive/best ideal (![]() ) solution and negative/worst ideal (
) solution and negative/worst ideal (![]() ) solution:
) solution:
 (6)
(6)
 (7)
(7)
where,
![]() associates with the criteria having a positive impact, and
associates with the criteria having a positive impact, and
![]() associates with the criteria having a negative impact.
associates with the criteria having a negative impact.
Step 5: Calculation of separation measures for each alternative:
Calculate the separation measures for each alternative. The separation from the positive ideal solution is formulated as follow:
 (8)
(8)
The separation from the negative ideal solution is formulated as follow:
 (9)
(9)
Step 6: Calculation of relative distances to the ideal solution:
Calculate the relative closeness to the ideal solution ![]() in which
in which ![]() represents the relative closeness coefficient.
represents the relative closeness coefficient.
![]() (10)
(10)
![]() if and only if the alternative solution has the worst condition whereas
if and only if the alternative solution has the worst condition whereas ![]() if and only if the alternative solution has the best condition.
if and only if the alternative solution has the best condition.
Step 7:
Alternatives are calculated in the context of existing criteria and ranked depending on their proximity to the ideal solution. Rank the alternatives according to ![]() in descending order and select the alternative with highest value of
in descending order and select the alternative with highest value of ![]() which is closest to 1. The alternative that is closest to the ideal solution is the best alternative.
which is closest to 1. The alternative that is closest to the ideal solution is the best alternative.
4. Empirical Results
The empirical results for the overall performance of the companies are presented based on the optimal ranking over three years period from 2012 until 2014.
Table 4. Multi Criteria Decision Making Matrix.
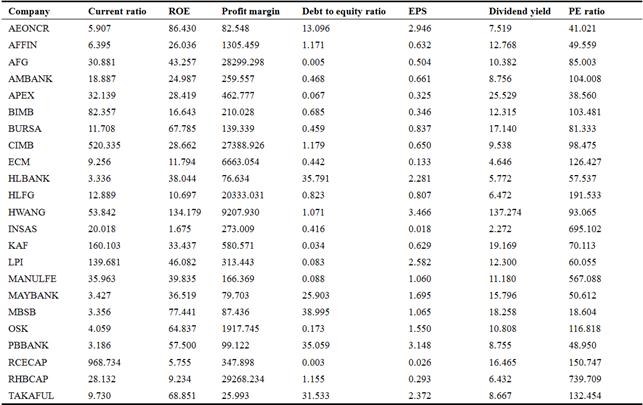
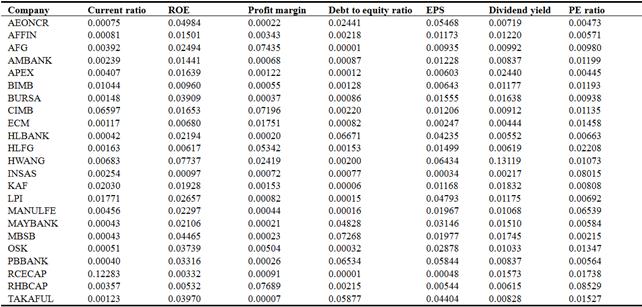
Table 5. Normalized Decision Matrix (2012-2014).
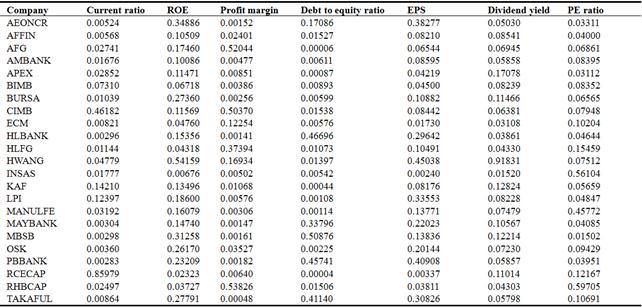
Table 6. Weighted Normalized Decision Matrix (2012-2014).
Positive ideal (![]() ) and negative ideal (
) and negative ideal (![]() ) solutions sets are formed and presented in Table 7.
) solutions sets are formed and presented in Table 7.
Table 7. Positive Ideal (![]() ) and Negative Ideal (
) and Negative Ideal (![]() ) Solutions.
) Solutions.

The distance of all alternatives from positive ideal solution (![]() ) and the distance of all alternatives from negative ideal solution (
) and the distance of all alternatives from negative ideal solution (![]() ) are calculated by using the equation (8) and (9) respectively.
) are calculated by using the equation (8) and (9) respectively.
The distance of all alternatives from positive ideal solution (![]() ) for AEONCR, AFFIN, AFG, AMBANK, APEX, BIMB, BURSA, CIMB, ECM, HLBANK, HLFG, HWANG, INSAS, KAF, LPI, MANULFE, MAYBANK, MBSB, OSK, PBBANK, RCECAP, RHBCAP and TAKAFUL are 0.193940, 0.202772, 0.186234, 0.205352, 0.195853, 0.201900, 0.194065, 0.157108, 0.208217, 0.211386, 0.196900, 0.127716, 0.230078, 0.187388, 0.184318, 0.208106, 0.202322, 0.205268, 0.194222, 0.205466, 0.169989, 0.213156 and 0.203101 respectively.
) for AEONCR, AFFIN, AFG, AMBANK, APEX, BIMB, BURSA, CIMB, ECM, HLBANK, HLFG, HWANG, INSAS, KAF, LPI, MANULFE, MAYBANK, MBSB, OSK, PBBANK, RCECAP, RHBCAP and TAKAFUL are 0.193940, 0.202772, 0.186234, 0.205352, 0.195853, 0.201900, 0.194065, 0.157108, 0.208217, 0.211386, 0.196900, 0.127716, 0.230078, 0.187388, 0.184318, 0.208106, 0.202322, 0.205268, 0.194222, 0.205466, 0.169989, 0.213156 and 0.203101 respectively.
The distance of all alternatives from negative ideal solution (![]() ) for AEONCR, AFFIN, AFG, AMBANK, APEX, BIMB, BURSA, CIMB, ECM, HLBANK, HLFG, HWANG,
) for AEONCR, AFFIN, AFG, AMBANK, APEX, BIMB, BURSA, CIMB, ECM, HLBANK, HLFG, HWANG,
INSAS, KAF, LPI, MANULFE, MAYBANK, MBSB, OSK, PBBANK, RCECAP, RHBCAP and TAKAFUL are 0.119108, 0.108358, 0.131248, 0.104379, 0.112157, 0.103850, 0.113177, 0.142582, 0.102529, 0.091858, 0.110284, 0.194312, 0.072123, 0.111161, 0.121299, 0.081255, 0.091911, 0.097122, 0.112340, 0.104151, 0.158339, 0.104629 and 0.092432 respectively.
By using equation (10), the relative closeness to the ideal solution, ![]() for each alternative is determined. After their proximity to the ideal solution is determined, all the alternatives are arranged in descending order depending on
for each alternative is determined. After their proximity to the ideal solution is determined, all the alternatives are arranged in descending order depending on ![]() so that the rank of preference can be determined. The relative closeness distance of each decision alternative to the ideal solution,
so that the rank of preference can be determined. The relative closeness distance of each decision alternative to the ideal solution, ![]() for overall performance is shown in Table 8. If the relative closeness to the ideal solution,
for overall performance is shown in Table 8. If the relative closeness to the ideal solution, ![]() is higher, the particular alternative is closest to the positive ideal solution and farthest from the negative ideal solution.
is higher, the particular alternative is closest to the positive ideal solution and farthest from the negative ideal solution.
Table 8. Overall Performance of the Companies Over the Three Years Period.
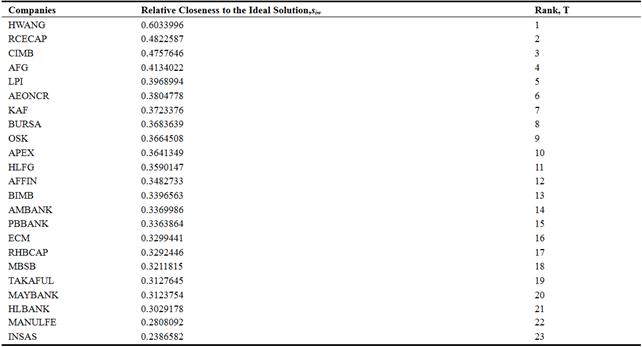
The overall performance of the companies over the three years period is determined by combining all the score of each financial ratio from year 2012 until 2014. After that, an optimal overall ranking of companies is generated by using TOPSIS model. As shown in Table 8, HWANG achieved the first ranking among the financial companies with 0.6033996 relative closeness to the ideal solution, which is the highest among the companies. This is because HWANG Company generates a large amount of profit in the year 2014 [13]. Therefore, HWANG Company achieved the first ranking as compared to other companies. The relative closeness to the ideal solution, for RCECAP, CIMB, AFG and LPI are 0.4822587, 0.4757646, 0.4134022 and 0.3968994 respectively. Therefore, RCECAP, CIMB, AFG and LPI obtained the second, third, fourth and fifth ranking respectively. On the other hand, the relative closeness to the ideal solution, for MANULFE and INSAS are 0.2808092 and 0.2386582 respectively. Thus, INSAS achieved the lowest ranking in this study. In summary, TOPSIS model is able to rank the financial performances of companies effectively in this study based on multiple criteria.
5. Conclusion
TOPSIS model is a mathematical model which involves multi-criteria assessment in providing useful information to decision makers to evaluate the financial performance of the companies. In this study, financial performance of 23 companies from the financial sector which are listed in Malaysia stock market are analyzed by using their financial statements for a time-period between 2012 and 2014. Based on the results in this study, HWANG is the most successful company as compared to the other financial companies. In summary, the top five companies in the highest ranking are HWANG followed by RCECAP, CIMB, AFG and LPI. This study is significant to the investors because it is able to evaluate and rank the overall performance of the companies from the financial sector in Malaysia by considering all the financial ratios with TOPSIS model.
References
- Li, H. and Sun, J. (2008). Ranking-order case-based reasoning for financial distress prediction. Knowledge-Based Systems Vol. 21(8),pp. 868-878.
- Tozum, H. (2002). Performance Evaluation of Banks. Journal of Banking and Finance Vol. 27, pp. 1-9.
- Hwang, C. L. and Yoon, K. (1981). Multiple Attribute Decision Making. Berlin: Springer-Verlag.
- Hasanloo, S., Karim, E., Mehregan, M. R. and Tehrani, R., (2013). Evaluating performance of companies by new management tools. Journal of Natural and Social Sciences Vol. 2(3), pp. 165-169.
- Yilmaz, B. B. and Konyar, A. M. (2013). Financial performance evaluation of publicly held lodging companies listed in Istanbul Stock Exchange with TOPSIS method. European Journal of Scientific ResearchVol. 95(1), pp. 143-151.
- Gündoğdu, A. (2015). Measurement of financial performance using TOPSIS method for foreign banks of established in Turkey between 2003-2013 years. International Journal of Business and Social ScienceVol. 6(1), pp. 139-151.
- İşseveroğlu, G. and Sezer, O. (2015). Financial performance of pension companies operating in Turkey with Topsis analysis method. International Journal of Academic Research in Accounting, Finance and Management Sciences Vol. 5(1), pp. 137-147.
- Cam, A. V., Cam, H. Ulutas, S. and Sayin, O. B. (2015). The role of TOPSIS method on determining the financial performance ranking of firms: an application in the Borsa Istanbul. International Journal of Econimics and Research 6(3): 29-38.
- Price, J. E., Haddock, M. D. and Brock, H. R. (1993). College accounting. 10th ed. New York: Macmillan/McGraw-Hill.
- Akguc, O. (2010). Financial statement analysis. 13rd ed. Istanbul: Arayis Publication.
- Östring, P., (2003). Profit-Focused Supplier Management. United State: American Management Association International.
- Jones, C. P. (2013). Investments analysis and management. 12nd ed. Asia: John Wiley & Sons.
- Hwang Capital Berhad, (2014). Year ended 31 July 2014 - Hwang Capital Group. [online] Available at: <https://www.google.com.hk/search?q=Year+ended+31+July+2014+-+Hwang+Capital+Group> [Accessed 1 February 2016].


