
American Journal of Microbiology and Immunology, Vol. 1, No. 2, September 2016 Publish Date: Sep. 3, 2016 Pages: 16-25
Comparative Study on Glutamic Acid Production by Mutant and Wild-Type Strains of Corynebacterium glutamicum Isolated from Soil Using Rice Bran as Substrate
Musa B.*, Ado S. A., Abdullahi I. O.
Department of Microbiology, Faculty of Science, Ahmadu Bello University, Zaria, Nigeria
Abstract
The present study was an investigation on comparative L-glutamic acid production by wild-type and a mutant strain of Corynebacterium glutamicum using rice bran pretreated with H2SO4 and KOH. Owing to the high carbohydrate (Cellulose) content of acid-treated and alkali-treated rice bran as determined (64.25% and 76.37% respectively), attempt was made to utilize the rice bran for the production of glutamic acid by submerged fermentation. The acid-treated and alkali-treated rice bran at concentration of 4% gave the highest glutamic acid yield of 27.84g/L and 15.72g/L respectively with the developed mutant strain (CGNTA) under predetermined optimum fermentation conditions. In contrast, lower yields of 10.40g/L and 9.08g/L respectively were obtained with the wild-type strain under similar optimum culture conditions. Out of four parameters optimized, substrate concentration and inoculum size were found to significantly (p˂0.05) influence glutamate production by CGNTA, but only pH variation was found to be significant on the performance of the wild-type strain in glutamate production. Acid-treated rice bran hydrolysate was determined to be a better substrate for L-glutamate production by the CGNTA mutant than the wild-type strain of C. glutamicum. The mutant strain (CGNTA) developed could therefore be useful in the industrial production of glutamic acid using rice bran as substrate.
Keywords
Rice Bran, Wild-Type, Mutant (CGNTA), C. glutamicum, Fermentation, Glutamate
Received:July 26, 2016
Accepted: August 9, 2016
Published online: September 3, 2016
@ 2016 The Authors. Published by American Institute of Science. This Open Access article is under the CC BY license. http://creativecommons.org/licenses/by/4.0/
Contents
1. Introduction 2. Materials and Method 2.1. Experimental Design 2.2. Collection of Samples 2.3. Treatment of the Rice Bran (Substrate Pre-treatment) 2.4. Proximate Analyses of the Sample 2.5. Isolation and Characterization of Corynebacterium glutamicum 2.6. Preliminary Screening 2.7. Mutagenesis 2.8. Glutamic Acid Production from Rice Bran by Submerged Fermentation 2.9. Identification of the Glutamic Acid Produced by Crystallization Technique 2.10. Purity Determination 2.11. Statistical Analysis 3. Results 4. Discussion 5. Conclusion
1. Introduction
L-Glutamate is a non-essential acidic amino acid mainly used as a flavouring agent or enhancer. It has a distinctive taste, known as "umami" that neither is sweet, sour, salty nor bitter [20]. Globally, about 1.8 million tons of monosodium glutamate is produced annually by fermentation using coryneform bacteria [20]. L-Glutamate is known as the major excitatory neurotransmitter in the nervous system [14] and is therefore widely used in food, pharmaceutical, medical, biochemical and analytical industries. These coryneforms are rod-shaped, non-sporulating Gram-positive bacteria containing mycolic acids and are widely distributed in the natural world. A non-pathogenic species, such as the Corynebacterium glutamicum was originally isolated as an L-glutamate-producing bacterium. Corynebacterium glutamicum is catalase positive and uses fermentative metabolism to break down carbohydrates [12]. It is a biotin auxotroph that secretes L-glutamic acid in response to biotin limitation [26]. This process is employed in industrial L-glutamic acid production. Fatty acid ester surfactants such as Tween 40 and Tween 80[4] as well as penicillin also induce L-glutamic acid secretion, even in the presence of biotin. However, the mechanism of glutamic acid secretion remains unclear. In addition to exploitation of wild type strains for amino acid biosynthesis, different advanced techniques for strain improvement such as mutagenesis, cloning and protoplasm fusion are used [6]. Glucose and other carbon sources such as beet molasses and cassava residues [17] are used as substrates for glutamic acid production. These are relatively expensive. Other cheap agricultural residues could equally be used as alternative sources of carbon for the production of glutamic acid as reported by [38].
2. Materials and Method
2.1. Experimental Design
The experimental design consisted of a completely randomized block systems with two (2) substrate’s treatments (Acidic and Alkaline), and four replicates, two (2) for each of the regulatory mutants and the wild-type strains of Corynebacterium glutamicum.
2.2. Collection of Samples
Four (4) distinctive locations of Samaru village were opted for soil assortment to isolate Corynebacterium glutamicum. A total of five (5) soil samples were collected from different parts of flower bed around the Department of Microbiology, Ahmadu Bello University, Zaria, and two (2) samples each from paddock, chicken-run and sheep-pen were collected from Samaru village at a depth of about 10cm. Each sample was packaged in a clean polythene bag, labeled appropriately and then transported to the Department of Microbiology, Ahmadu Bello University, Zaria for analyses.
About 1kg of fresh and fine-textured rice bran was collected from rice milling station at Samaru village, Sabon Gari Local Government Area of Kaduna state. The rice bran sample was packaged into polythene bag, labeled appropriately and then transported to the Department of Microbiology, A.B.U. Zaria for analyses.
2.3. Treatment of the Rice Bran (Substrate Pre-treatment)
Lignocellulosic biomass holds remarkable potential for conversion into commodity products presenting dual advantage of sustainable resource supply and environmental quality. Though their utilization does not compete with food and feed demand, its bioconversion and utilization is facilitated by pretreatment.
Substrate
Rice bran is a low cost source of cellulose [22], abundantly available in northern parts of Nigeria and other parts of the world where rice is being cultivated as a staple food crop. Rice bran was separately pre-treated using sodium hydroxide and sulphuric acid and was used as substrate for fermentation to glutamic acid production.
2.3.1. Alkaline Pre-treatment
A weighed amount of 25g of the fresh rice bran was placed in a 1000ml Erlenmeyer flask and 225 ml of 3% (w/v) NaOH solution was added. The flask was cotton- plugged and autoclaved at 121°C for 30 min. The material obtained after treatment was then filtered through muslin cloth and washed several times under running distilled water until no color is visible in the wash water and the pH adjusted to physiological value (7.2). The neutralized residue was then pressed manually to remove excess water and used for the enzymatic hydrolysis and fermentation to glutamic acid. Small portion of the treated biomass was dried in an oven at 70°C for 24 h and was ground to fine particle size in a laboratory mill for the compositional (Proximate) analysis studies [22] at the Department of Food Science, Institute of Agricultural Research, Ahmadu Bello University, Zaria.
2.3.2. Acidic Pre-treatment
The method described by [29] was adopted. About 25g of the rice bran sample was added to a 1000ml flask and about 225ml of 3% sulphuric acid was added to the sample. The mixture was autoclaved at 121°C for 30 min and the material obtained after treatment was then filtered through muslin cloth and washed several times under running distilled water until no color is visible in the wash water and the pH adjusted to physiological value (7.2) following calcium hydroxide over-liming. The neutralized residue was then pressed manually to remove excess water and used for the enzymatic hydrolysis and fermentation to glutamic acid. Small portion of the treated biomass was dried in an oven at 70ºC for 24 h and was ground to fine particle size in a laboratory mill for the compositional (Proximate) analysis studies [29] at the Department of Food Science, Institute of Agricultural Research, Ahmadu Bello University, Zaria.
2.4. Proximate Analyses of the Sample
About 8g of each of the acid-treated and alkali-treated dried unfermented rice bran samples were used to carry out proximate analyses at the Department of Food Science, Institute of Agricultural Research, Ahmadu Bello University, Zaria in order to determine the total carbohydrate content, the crude protein content, crude fat, crude fiber, ash content and moisture content as the percentage compositions of the substrate according to the methods adopted by [3].
2.5. Isolation and Characterization of Corynebacterium glutamicum
2.5.1. Media Preparation
The following media used were of analytical grade (OXOID) and were prepared according to manufacturer’s instruction; Loeffler’s Blood Serum Medium, Modified Hoyle’s Medium, Sheep Blood Agar, Motility medium.
2.5.2. Isolation of Corynebacterium glutamicum
A weighted amount of 25g of each of the five (5) soil samples was separately added to 225ml of sterile distilled water and a tenfold serial dilution was carried out to a dilution of 10-5 using sterile normal saline as diluent. A loopful (0.1ml) from each of the 1:102 diluted soil suspensions was separately inoculated onto slants of Loeffler’s medium which was the primary isolation medium by streaking. The inoculated slants were then incubated at 35°C for 48 hr. Discrete; well isolated colonies were selected and identified. These were sub-cultured on the selective medium- modified Hoyle’s medium and also incubated at 35°C for 48 hr. The isolates were used as source of culture to be screened for the production of L-glutamic acid [3]. The isolates were sub-cultured onto nutrient agar slants for subsequent identification and use.
2.5.3. Identification of Corynebacterium glutamicum
Identification of Corynebacterium glutamicum was primarily based on the taxonomic comparison. The characteristic morphological, cultural and biochemical properties were observed [8].
i. Cultural Characterization
All media inoculated for isolation of the organism were observed for colonial morphology such as size, pigmentation, form, margin and elevation.
ii. Morphological Characterization
Such morphological characteristics as the cell shape, cell arrangement as well as the Gram’s reaction of the organism were determined by Gram staining technique. Other staining techniques such as spore-staining were also carried out to morphologically characterize the isolates [19].
iii. Biochemical Characterization
Several different biochemical tests were carried out according to manufacturer’s instructions. These include; carbohydrate (Glucose, Fructose, Sucrose, Lactose, Arabinose, Galactose and Maltose) fermentation tests, catalase test, nitrate reduction test, aesculin hydrolysis, gelatin liquefaction and urease tests.
2.6. Preliminary Screening
2.6.1. Screening Medium
The compositions of the screening medium used for L-glutamate production per 1000 ml of dH2O is as follows; Glucose, 5gm; Calcium carbonate, 1gm; Ammonium sulphate, 1gm; Potassium di-hydrogen phosphate, 0.3gm; Di-potassium hydrogen phosphate, 0.7gm; Magnesium sulphate hepta-hydrate, 0.01gm; Ferrous sulphate hepta-hydrate, 0.2mg; Magnesium chloride tetra hydrate, 0.2mg; Thymine hydro chloride, 20µg; and d-Biotin, 10µg.
2.6.2. Culture Procedure
Screening medium (100 ml) was taken in each 250 ml sterilized flask and inoculated with 24 hours old bacterial broth culture. After inoculation, the flasks were incubated on a shaker incubator at 37ºC for 96h at 180 rpm. Samples were taken after 96h and centrifuged at 5000rpm for 10 min. Supernatants were then examined for L- glutamic acid.
2.6.3. Qualitative Estimation
Qualitative analysis for L-Glutamate was done by paper chromatographic technique [13]. For paper chromatography, Whatman No. 1 filter paper having dimensions 19x10 was used, spotted with standard glutamate solution and solution from the supernatant of the samples, 3cm above from the bottom by means of micro capillary tube. At room temperature, spots were air-dried. The paper was then dipped up to 1.5cm in solvent system having 30ml Butanol, 5ml acetic acid and 5ml dH2O (6:1:1). By using ascending method, chromatograms were developed by allowing the solvent to run for three hours, up to 12cm from the bottom. After air-drying, the paper was sprayed uniformly with 0.5% ninhydrin in (95%) acetone. The paper was then placed in an oven set at 65ºC for five minutes after air-drying. Colored zones of amino acids were produced which indicated the position of amino acids present in the sample(s). Through these well-defined colored zones, the retention factor (RF) was also calculated and the glutamic acid present in the unknown samples was identified by comparing with the standard glutamic acid colored zone based on their RF.
2.6.4. Quantitative Estimation of Glutamate
For quantitative estimation of the amino acid produced, 2 ml of the supernatant from each of the fermented screening medium was taken separately in test tubes and 2 ml of 5% ninhydrin in acetone was added and heated for 15 min in boiling water bath. The tubes were then cooled to room temperature and glutamate was quantitatively estimated by taking readings at 570 nm using spectrophotometer with reference to the standard curve.
2.7. Mutagenesis
2.7.1. Mutation with Nitrous Acid
The isolates were grown in biotin-supplemented nutrient broth for 24 h. Acetate buffer (0.2 M, pH 4.4) was prepared in accordance with the procedure adopted by [2]. To fifty milliliters of 50:50 organism: acetate buffer suspension in a 150 ml flask, about 1.5 ml of membrane filter (0.2 μm pore size) - sterilized aqueous solution of 2.0 M sodium nitrate was added. This was allowed to stand at room temperature (30 ± 2°C) for twenty minutes. The reaction was then terminated by serial dilution with TrisHCl prepared in accordance with the procedure of [2]; 121 g of Tris base was dissolved in 800 ml of distilled water. The pH value was adjusted to 7.4 by adding 84 ml of 0.1 M HCl to 100 ml of 0.1 M Tris base. The volume was made up to 1 L with distilled water. The treated organisms were inoculated, using pour plate technique on biotin-supplemented nutrient agar and incubated at 37°C. Survivals were further subjected to mutant selection medium containing 4-Fluoroglutamic acid as toxic analogue of L-glutamic acid and screened out for their potential to produce L- glutamate.
2.7.2. Isolation of Regulatory Mutants Using a Toxic analogue
(4-Fluoroglutamic Acid-Resistant Mutants)
Suspected mutant isolates from the nutrient agar supplemented with biotin were inoculated directly onto modified Hoyle’s medium supplemented with 2.0mg/ml of 4-Fluoroglutamic acid. Colonies that appear on the surface of the agar plate within two to seven days of incubation were picked up as the regulatory mutants resistant to 4-Fluoroglutamic acid [21].
2.8. Glutamic Acid Production from Rice Bran by Submerged Fermentation
2.8.1. Inoculum Preparation
For the preparation of inoculum, loop full of the refreshed culture of C. glutamicumwas aseptically transferred to sterilized inoculum medium (25 ml) in 250 ml Erlenmeyer flask. The inoculum medium contained 0.8 % nutrient broth (pH= 7.0± 0.2) and was kept for 18 hours on an orbital shaker at 30°C and 120 rpm (Nasab et al., 2007). The optical density of the culture was adjusted to 0.6 at 600 nm by diluting the culture with sterilized distilled water [7].
2.8.2. Basal Medium
For L-glutamic acid production by C. glutamicum through submerged fermentation, optimization of such parameters like substrate-water ratio, temperature, pH and inoculum size, cells were cultured in basal salt (BS) medium per liter. The basal salt medium contained the following per litre: 5 g, (NH4)2SO4; 5 g, urea; 2 g, KH2PO4; 2 g, K2HPO4; 0.25 g, MgSO4· 7H2O; 0.01 g, FeSO47H2O; 0.01 g, MnSO4 5H2O; 0.01 g, CaCl22H2O; 0.03 mg, ZnSO4 7H2O; 0.1 mg, H3BO4; 0.07 mg, CoCl26H2O; 0.03 mg, CuCl22H2O; 0.01 mg, NiCl2; 0.1 mg of NaMo2O42H2O;200µg of biotin (pH 7.0). The initial pH was adjusted at 7± 0.2 with 1N NaOH and medium having different concentrations (1-5%) of substrate (Rice bran) was autoclaved for 15 min. [12]. The growth medium was inoculated by fresh inoculum of 18hrs old of C. glutamicum. The fermentation was carried out at specific optimum conditions on orbital shaker at 180 rpm and at 37°C.
2.8.3. Shake Flask Fermentation
About 50ml of the basal medium was mixed separately with 13g each of the acid-pre-treated and alkali-pre-treated substrate (4:1 v/v) in 250ml Erlenmeyer flasks and labelled appropriately. Four (4) ml each of the 18hours-old culture of the wild-type and the regulatory mutants were added appropriately and incubated on a rotary flask shaker at (180 rpm) at 37°C for 96hrs [3]. The qualitative and quantitative analyses of the glutamic acid produced were carried out and results were recorded accordingly.
2.8.4. Parameters Optimized for
L-glutamate Production
i. Effects of Substrate Concentration of Glutamic Acid Production
Acid and alkali pre-treated rice bran substrates were used to optimize different levels of substrate-water ratio with one to five percent (1-5%). The different concentrations were used to find the best concentration that would produce the highest yield of L-Glutamic acid. The fermentation medium contained all the basal nutrients as mentioned in basal medium. It was monitored after 96hrs for glutamic acid production.
ii. Effects of Temperature on Glutamic Acid Production
To find the metabolically favorable temperature of C. glutamicum to optimally secrete glutamic acid, different degrees of temperature like 25°C, 30°C, 35°C and 40°C were studied. At the termination of the fermentation period, the produced glutamic acid was estimated to find the optimum temperature for maximum glutamic acid production.
iii. Effect of pH on Glutamic Acid Production
Among the different physical parameters that drastically affect fermented product, pH is very important. Therefore, various ranges; 6.6, 6.8, 7.0, 7.2 and 7.4 of pH were used to determine the optimum pH for L-glutamate hyper production.
iv. Effects of Inoculum Size on Glutamic Acid Production
The size of seed culture medium (inoculum) is a deciding parameter that utilize fermentation medium and confirm its conversion into required product completely. Different percentages of inoculum (1, 3, 5, 7 and 5%) were used to optimize the size of inoculum to get high titre of glutamic acid.
2.8.5. Analytical Methods
L-glutamate estimation
The fermented broth was autoclaved and cell mass was separated by centrifugation (10,000 rpm) for 10 minutes. Then qualitative and quantitative estimation of produced glutamatefrom the supernatant was done [13] by following the methods given below;
i. Qualitative Method
The qualitative analysis for L-Glutamate was done by paper chromatographic technique [13]. For paper chromatography, Whatman No. 1 filter paper having dimensions of 19x10 was used, spotted with standard glutamate solution and solutions from the supernatant of each sample about 3cm above from the bottom by means of micro-capillary tube. At room temperature, spots were air-dried and the paper was dipped up to 1.5cm in solvent system having 30ml Butanol, 5ml acetic acid and 5ml dH2O (6:1:1). By using ascending method, chromatograms were developed by allowing the solvent to run for three hours, up to 12cm from the bottom (solvent front). After air-drying, the paper was sprayed uniformly with 0.5% ninhydrin in (95%) acetone. The paper was then placed in an oven set at 65ºC for 5min after air-drying. Colored zones of amino acids were produced which indicated the position of amino acids present in the sample(s). Through these well-defined colored zones, the retention factor (RF) was calculated and the glutamic acid present in the unknown samples was identified by comparing with the standard glutamic acid colored zone based on their RF values.
ii. Quantitative Estimation of L-glutamate
For quantitative estimation of the amino acid produced, 2 ml of the supernatant from each of the fermented production medium was taken separately in test tubes and 2 ml of 0.5% ninhydrin in acetone was added and heated for 15 min in boiling water bath. The tubes were then cooled to room temperature and glutamate was quantitatively estimated by taking readings at 570 nm using spectrophotometer with reference to the standard curve of L- glutamic acid.
Standard curve of L-glutamic acid
To estimate glutamic acid quantitatively by spectrophometer method as described by [34], the standard curve was firstly plotted between various diluted concentrations (100mg/L-500mg/L) of standard glutamic acid and their respective optical densities (OD) at 570 nm. The trend in Figure 1 represented the increasing OD with increasing standard glutamic acid concentrations. The maximum OD (0.9) at 570nm was corresponding with the highest standard glutamate concentration of 400mg/L.
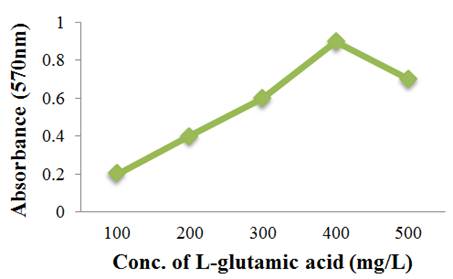
Figure 1. Standard curve of L-glutamic acid.
2.9. Identification of the Glutamic Acid Produced by Crystallization Technique
Fermented broth (10ml) collected from contents of shaking medium was centrifuged at 10,000 rpm for 10 min, and the supernatant was partially evaporated in a shaker water bath. The concentrated medium was then acidified to a pH of 3.22 which is the iso-electric point of glutamic acid using 1N HCl and allowed to stand still in a refrigerator until the glutamic acid crystals were precipitated there from [3].
2.10. Purity Determination
The Thin Layer Chromatographic (TLC) technique was used to detect the purity of the L-glutamate produced as described by [34]. About 0.1g of the clear crystals obtained was dissolved in 10ml of distilled water and was used as the sample solution. Standard and test sample solutions were (5.0µl each) spotted on an aluminium TLC plate of 0.2mm thickness and developed with a mixture of n-propanol and strong ammonia: water (67:33) solution to the distance of about 10cm and dried in air. After spraying a solution of ninhydrin in acetone (0.5g of ninhydrin in 100ml acetone), the plate was dried at 65°C for 5min to observe for the spots. Purity of the product was detected by the presence of only one purple spot of the same retention factor (RF) value as that of the standard L-glutamate (RF=0.3).
2.11. Statistical Analysis
Data processing was carried out through a statistical method using SPSS 13.0 software [18]. All the optimization parameters were analyzed by comparison of means through One-Way ANOVA.
3. Results
Table 1. Occurrence of Corynebacterium glutamicum in VariousSoil Samples Collected fromSamaruVillage, Zaria.
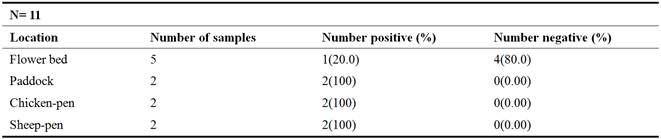
Table 2. Screening for L-GlutamicAcid Productionby the C. glutamicumaIsolates.
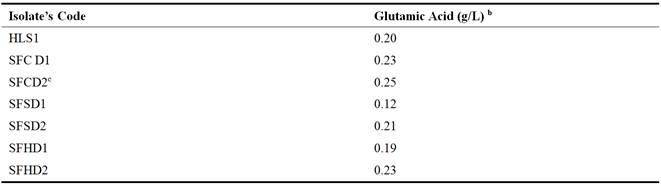
KEY:
aShake flask fermentation at pH 7.0, Temperature: 37°C for 96h.
bData are approximated to 2 decimal places
cDesignation of the best L-Glutamic acid- producing isolate
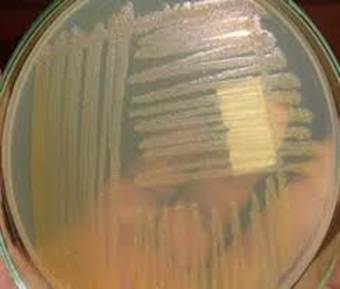
Figure 2. Phenotypic appearance of the wild-type strain of C. glutamicum on modified nutrient agar medium.
Figure 3. Phenotypic appearance of the regulatory mutant strain of C. glutamicum on modified nutrient agar medium.
Table 3. Comparative Glutamic Acid Production (g/L) by Mutant and Wild Strains of C. gutamicum from Acid-treated Rice Bran Hydrolysates under Optimum Fermentation Conditions.
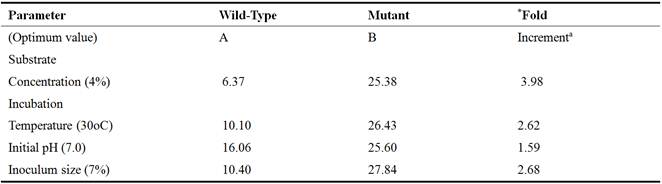
aData are approximated to 2 decimal places
*Fold-increment = B/A
Table 4. Comparative Glutamic Acid Production (g/L) by Mutant and Wild Strains of C. gutamicum from Alkali-treated Rice Bran Hydrolysates under Optimum Fermentation Conditions.
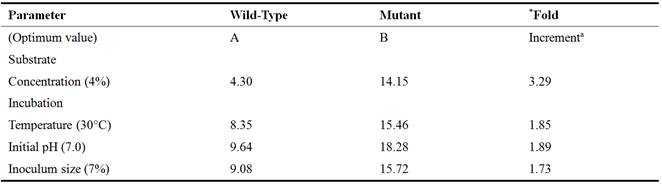
aData are approximated to 2 decimal places
*Fold-increment = B/A
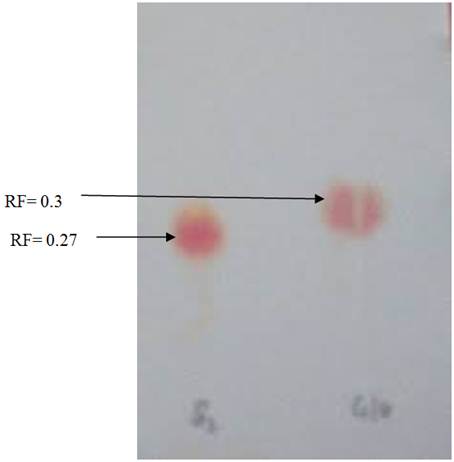
Figure 4. Chromatogram of Glutamic acid on TLC plate for purity determination.
Glu = Standard Glutamic Acid
S1 = Test Fermentation Product
4. Discussion
In this study, a total of eleven (11) samples from four different locations were used for the isolation of C. glutamicum, of which a prevalence rate of (100%) was obtained with soil from paddock, chicken-pen and sheep-pen whereas soil from flower bed have the least prevalence of 20%. This might be due to the richness in the nutritional composition of the humus soil from the animal houses, whereas, the flower bed might have little organic matter as nutrient to the organism. This agrees with the findings of [40] who reported a higher isolation rate (15.6%) from organically-rich soil than from nutrient poor soil with 5.74%. Out of seven (7) isolates confirmed to be C. glutamicum and screened for L-glutamic acid production, the isolate from chicken-pen (SFCD2) produced the highest quantity of glutamic acid (0.25g/L) whereas, the lowest glutamic acid production (0.12g/L) was observed with isolate named SFSD2 from sheep-pen. This might be due to the variability and adaptability in terms of the nutritional diversity of C. glutamicum as it is not unconnected with the nature of the environment from which they were isolated. Glutamic acid concentration obtained with SFCD2 in this study, is much lower than that obtained by [12] who reported a concentration of 1.5g/L after screening. This difference may be accounted for by the higher biotin concentration (200µg) used in this study as opposed to the lower concentration of 50µg used by [12]. This is likely because the activity of 2-oxoglutarate dehydrogenase complex (ODHC) reportedly decreases during L-glutamate production in response to biotin limitation as reported by [21]. Since ODHC links the tricarboxylic acid (TCA) cycle and L-glutamate biosynthesis, a decrease in ODHC activity could switch the metabolic flow from the TCA cycle to L-glutamate synthesis.
The best glutamic acid producer (SFCD2) was observed to possess some novel characteristics such as white colonies characterized by increased viscosity and resistance to 4-Fluoroglutamic acid (4FGA) - a toxic analogue of L-glutamic acid, all of which were not observed with the wild type strain. These differences may be due to disruption of the likely present pigment-producing gene in the mutant strain which may account for the variation in coloration and increased secretion of complex polysaccharides which may be connected with the increased viscosity observed. While the phenotypic resistance to 4FGA might be due to disruption of the NCgl1221 gene which codes for an L-glutamate exporter, reducing the entry of 4FGA into the mutant cell and hence become resistant to the 4FGA and ultimately to feedback inhibition. Thus these characteristics result in hypersecretion of glutamic acid as explained by [21]. This corroborates with the findings of [27] who reported a remarkable phenotypic variation between the mutant and the wild type strain of C. glutamicum.
Substrate is the most important and basic requirement for microbial biosynthesis. A cheap substrate with multiple nutrients is ideal for industrial biotechnological processes. Acid-treated rice bran hydrolysate proved to be a better substrate used in present study as a good carbon source. Out of the various concentrations of both acid-treated and alkali-treated hydrolysates used in this study, 4% was found to be the optimum for the production of glutamic acid using the wild type and mutant strains of C. glutamicum. At 4%, the yield of glutamate produced by CGNTA from acid-treated hydrolysate (25.38g/L) was found to be significantly higher (P< 0.05) than that produced from the alkali-treated hydrolyaste (14.15g/L). Whereas, the difference between the yield obtained with the wild type from acid-treated hydrolysate (6.37g/L) and alkali treated hydrolysate (4.30g/L) was statistically insignificant (p˃0.05). The observed variations in the amount of glutamate produced with substrate concentrations could be explained by the fact that at lower concentration (higher water to substrate ratio), the medium might be too diluted and therefore contained relatively very low nutrients where the organism had to employ energy from the hydrolysis of ATP in order to take up the nutrients by active transport mechanism. Similarly, at higher concentrations of the substrate (higher substrate to water ratio), characterized by low water activity (aw), the fermentation medium might become hypertonic to the fermenting organism, thereby causing the cell to shrink leading to cell death and eventually reduces the inoculum size that ultimately leads to low glutamic acid production. Hence an average concentration is needed for optimum glutamate production. The results of these findings are therefore arguing in favour of the works carried out by [10].
Metabolic activity of an organism is greatly affected by change in temperature. Therefore to optimize suitable temperature, fermentation was carried out with 4% treated hydrolysates as substrates for 96 hours of incubation with various ranges of temperature. The results showed that glutamate production was higher at 30°C as compared to all other temperatures. Further increase in temperature resulted in decreased glutamate production. This is because cardinality of temperature plays a very important role in the growth and metabolism of an organism. Thus, growth and metabolic functions at extreme temperatures are greatly inhibited and sometimes become almost impossible. This is simply because; at low temperatures, enzymes get inactivated while membrane lipoproteins which are important in glutamate excretion become hardened. Whereas at extreme temperatures, enzymes and membrane proteins get denatured, this ultimately results in loss of their activities. The results of present study are in line with the work of [36], who observed a maximum glutamate production at 30°C during the study with three strains of coryneformbacteria as fermenting agents. The results of [35]; [25] and [30], showed that at 30°C, the metabolism of coryneform bacteria are highly active for the production of enzymes and amino acids. Temperature used by [15] was 32°C with mutated strain of B. flavum using glucose (3%), 8% inoculum size and pH of 7.5 and reported glutamate production of about 17.8g/L in shake flask. [24] reported a maximum glutamate (21.48 g/L) production by C. glutamicum at 37°C, in contrast to present findings. This is also similar to the work of [28] who reported that the effect of temperature shift-up from 30 to 39°C through incubation, the mutant strain and wild strain show that the specific production rate of glutamic acid at 30°C increased apparently by 2 and 1.5 fold respectively on average from other temperatures. Contrary results were obtained by [11] who reported enhanced glutamic acid production by Brevibacterium sp. with temperature shift-up from 30 to 38°C. The mutant produced higher glutamate than their wild type bacterial strains at a temperature of 30°C. This disagrees with the work of [3] who reported that at temperature above 30°C, the glutamate was actively produced, meanwhile the activities of ODHC and pyruvate dehydrogenase (PDH) were found to have 35% reduced activity.
The growth of bacteria is sensitive to changes in pH which also influences membrane potential for secretion of glutamic acid [34]. Therefore, to get the highest growth with good secretion of glutamate, various ranges (6.6, 6.8, 7.0, 7.2 & 7.4) of initial pH of fermentation medium were investigated to get optimum titre of glutamic acid. At pH 7.0, the yield of glutamate produced by CGNTA from acid-treated hydrolysate (25.60g/L) was found to be insignificantly higher (P˃0.05) than that produced from the alkali-treated hydrolyaste (18.28g/L). Whereas, the difference between the yield obtained with the wild type from acid-treated hydrolysate (16.06g/L) and alkali treated hydrolysate (9.64g/L) was statistically significant (p˂0.05). The reason might be due to the physiological nature of the pH 7.0 at which best metabolic functions are carried out. Extreme pH of the fermentation media might have negatively affected the membrane stability (membrane fluidity), enzymatic activities as well as transport of nutrients for growth and development, hence low yield of glutamate recorded. The results of present studies are in line with that of [16] who reported a maximum glutamate production of 38.5 g/L at pH 7 in growth medium as compared to 28.3, 25.7 and 14.6 g/L glutamate at pH 6.5, 7.5 and 8.0 respectively. Similar results were reported by [33] who obtained high yield of glutamate (27mg/ 100mL) at pH 7 after 48 hours of incubation. The results of [24] were also in agreement with the present findings. On the other hand, [32] obtained 12.5 g/L of glutamate at optimum pH 7.6 after incubation 60 hours.
Vegetative growth of bacterium may be promoted at the cost of glutamate production due to competition for available nutrient [31]. Therefore, a number of inoculum concentrations (1, 3, 5, 7 and 9%) were used to find the optimum inoculum size for hyper production of glutamate from mutant and wild type C. glutamicum with 4% acid-treated and alkali-treated rice bran hydrolysates as substrate for 96hours of fermentation period at 30°C and pH 7.0. The trend of glutamic acid production showed that significantly (P< 0.05) higher titres (27.84 g/L) of glutamic acid was produced from acid treated substrate than the alkali treated substrate (15.72g/L) by the CGNTA with 7% of inoculum. This might not be unconnected with the density-dependent bacterial communication (Quorum sensing) based on which metabolic functions of a microbial entity are determined. This result is in agreement with that of [15] and [32] reported maximum glutamic acid production at 8% and 10% inoculum size respectively.
In the present study, the total amount of glutamic acid produced at optimum conditions from acid-treated and alkali-treated rice bran hydrolysates by CNNTAwere 27.84 g/L and 15.72g/L respectively. Whereas, 10.40g/L and 9.08g/L were respectively produced by the wild type strain of C. glutamicum from acid-treated and alkali-treated rice bran hydrolysates. This shows that agricultural wastes such as rice bran are a good substrate for the production of glutamic acid. The results agrees with the findings of [5]who reported that 17.8g/L of glutamate was produced from 15g/L of barley through heterogenous expression of Corynebacterium thermocellum endoglucanase in C. glutamicum suggesting that direct utilization of cellulosic materials for glutamate production is possible. [39] also revealed that a maximum yield of L-glutamic acid was obtained with C. glutamicum free cells under optimum parameters. However, [4] reported that only 73g/L of glutamate was produced by C. glutamicum ATCC 13022 from 75.7% of rice bran hydrolysate. Maximum of 39.32mg/ml glutamate was reported to be produced by C. glutamicumCECT 690 strain from date waste juice as reported by [37].
The purified glutamic acid produced was found to appear as a spot with a retention factor (RF) of 0.27 which is nearly the same as 0.3 of the standard L-Glutamic acid. The slight difference observed in the RF values might be due to the difference in the efficiency of the purification methods used.
This research therefore presents the potentials of acid-treated rice bran in the production of L-glutamate under optimized conditions from which some economic and environmental benefits may be derived.
5. Conclusion
The use of rice bran as a locally available and nutrient-rich raw material when treated with acid could enhance glutamic acid production by regulatory mutant strains of C. glutamicum, and this would be of economic and environmental benefits through the establishment of cost-effective local glutamic acid industry in Nigeria as well as cleaning the environment of agricultural wastes.
References
- Adnan, A., Mushtaq, Z., Syed, Q., Shabbiri, K. (2011). Optimization of fermentation parameters for the production of L-Glutamate from Brevibacterium linens DSM 20158, using statistical approach. Journal of World Applied Science,13(5): 1132-1140.
- Ado, S.A. (2004). Studies on genetic improvement of Aspergillus niger–CA3 for amylase production. Ph.D. Thesis, Department of Microbiology, Ahmadu Bello University, Zaria, June 2004.
- Ahmed, Y.M., Khan, J.A., Abulnaja, K.A., Al-Maliki, A.L. (2013). Production of glutamic acid by Corynebacteriumglutamicum using dates syrup as carbon source. African Journal of Microbiology Research, Saudi Arabia. 7(19): 2072.
- Amin, G.A. and Al-Talhi, A. (2007).Production of L-glutamic Acid by Immobilized Cell Reactor of the Bacterium CorynebacteriumglutamicumEntrapped into Carrageenan Gel Beads. World Applied Science Journal, 2:62-67.
- Asakura, Y., E. Kimura, Y. Usuda, Y. Kawahara, K. Matsui, T. Osumi, and T. Nakamatsu.(2007). Altered metabolic flux due to deletion of odhA causes L-glutamate overproduction in Corynebacteriumglutamicum. Applied Environmental Microbiology,73:1308-1319.
- Atef, N.M., Zaki, D.A. and Abd-El-Aziz, F. (2007).Activation of alanine biosynthesis by Brevibacteriumflavumthrough optimization of culture conditions, UV irradiation and EMS using low quality dates. Journal of Applied ScienceResearch, 3: 1950-1959.
- Athar, M., Ahmed, S. and Hashmi, A.S. (2009). Bioconversion of beet pulp to microbial biomass protein by Candida utilis.Journal of Chemical Society of Pakistan, 31(1):115-119.
- Bergey’s Manual of Determinative Bacteriology. (2004). Eds., John G. Holt et al., 9thedn. The Williams and Wilkins, Baltimore, p.565.
- Blombach, B., Seibold, G.M. (2010) Carbohydrate metabolism in Corynebacteriumglutamicumand applications for the metabolic engineering of L-lysine production strains. Applied Microbiology and Biotechnology, 86(5):1313-1322
- Chen, X., Chen, S., Sun, M. and Yu, Z. (2008). High yield of glutamic acid production from Bacillus substilis by solid state fermentationusing swine manure as the basis as solid substrate. Bioresource Technology, 96:1875-1879.
- Choi, S., Takuya N. and Toshiomi, Y. (2004). Enhanced glutamic acid production of Brevibacteriumsp.with temperature shift-up cultivation. Journal of biosciences and bioengineering, 98:211-213.
- Hadia, G., Shah, A. and Younis, N. (2012).Fermentative Production of Glutamate by Newly Isolated Soil Bacteria. International Journal of Pharmaceutical & Biological Archives, 3(6):1368-1376.
- Hassan, B., Asghar, M., Nadeem, S., Zubair, H., Muzammil, H.M. and Shahid, M. (2003).Isolation and Screening of Amino acids-Producing Bacteria from Milk.Biotechnology,2(1):18-29.
- Hawkins, R A. (2009).The blood-brain barrier and glutamate. American Journal of Clinical Nutrition, 90:867S–74S.
- Javaid, M.M., Haq, I.U., Sohail, M.I., Bokhari, S.A.I. (2012). Mutagenesis induced hyper-production of L- Glutamate in shake flask and fermentor by BrevibacteriumflavumIIBUV2. Pakistan Journal of Botany, 44:347-353.
- Javed, A., Jamil, A., Zarchi, S.R. (2011). Optimization and hyper-expressed production of Glutamate through chemical mutagenesis of Brevibacteriumflavumby N-nitroso-N-ethylurea. AfricanJournal of Microbiological Resources, 5(29): 5230-5238.
- Jyothi, A.N., Sasikiran, K., Nambisan, B. and Balagopalan, C. (2005). Optimization of glutamic acid production from cassava starch factory residues using Brevibacteriumdivaricatum. Processes in Biochemistry, 40(11): 3576-3579.
- Levesque, R. (2007). SPSS Programming and Data Mangement.AGiude for SPSS and SAS Users, fourth edition, SPSS Inc., Chicago III.ISBN 1- 56827- 390- 8.
- Mahmood, Z.A. (1996). Production of L-glutamic acid Through Fermentation. A PhD.thesis submitted to the Department of Pharmaceutics, Faculty of Pharmacy, University of Karachi-75270. Pakistan. Pp7-11, 45-49 and 150-160.
- Nakamura, J., Hirano, S. and Ito, H.(2006). L-Glutamic Acid Producing Microorganism and A Method For Producing L-Glutamic Acid. U.S. patent US20060141588A1.
- Nakamura, J., Hirano, S., Ito, H. and Wachi, M. (2007). Mutations of the C. glutamicumNCgl1221 Gene, Encoding a Mechanosensitive Channel Homolog, Induce L- Glutamic Acid Production. Applied Environmental Microbiology,73 (14): 4491-4498
- Narasimha, G., Sridevi, A. and Radha, S. (2011). Pre-treatment of Rice Bran for Effective Production of Cellulase by Aspergillus niger. International Journal of Pharma and Bio Sciences, India. 2(4): 538.
- Nasab, M.N., Ansaris, S., Montazer, Z. (2007). Fermentative production of Glutamate by Corynebacteriumglutamicumfrom different carbon sources.Journal Iranian Agricultural Resources, 26(1-2):99-105.
- Naz, S., Iqbal, T., Sheikh, M.N., Shahid, M., Ghaffar, A. (2001). Effect of physiochemical treatment on Brevibacteriumflavumfor production of Glutamate. Journal of Biological Sciences, 1(61):507-510.
- Nelofer, R., Syed, Q., Nadeem, M. (2008). Statistical optimization of process variable for L- glutamate production by Corynebacteriumglutamicum. Turkish Journal of Biochemistry, 33(2):50-57.
- Nottebrock, D., Meyer, U., Krämer, R. And Morbach, S.(2003). Molecular and biochemical characterization of mechanosensitive channels in Corynebacteriumglutamicum.FEMS Microbiology Letters, 218:305-309.
- Paisrisan, P., Chudapongse, N. and Nantapong, N. (2013). Isolation and improvement of a novel thermotolerant glutamic acid producing CorynebacteriumglutamicumPP29 strain. Burapha University International Conference.
- Pasha, S.Y., Ali, M.N., Tabassum, H. and Mohd, M.K. (2011).Comparative studies on production of glutamic acid using wild type, mutants,immobilized cells and immobilized mutants of Corynebacteriumglutamicum. International Journal of Engineering, Science and Technology, (IJEST).3: 3941-3949.
- Rakesh, K.T., Devendra, P.S. (2013). Acid and Alkaline Pre-treatment of Lignocellulosic Biomass to Produce Ethanol as Biofuel. International Journal of Chemical Technology Research, U.S.A. 5(2): 729.
- Rao, B.S., Swamy, A.V.N. (2011). Studies on Continuous Production Kinetics of L-Glutamate by Immobilized Corynebacteriumglutamicum13032.Middle-East Journal of Science Resources, 7 (2): 235-240.
- Reddy, M.A., Villeneuva, L.M., Wang, M., Lanting, L., Natarajan, R. (2008). Role of the Glutamate specific demethylase 1 in the proimflammatory phenotype of vascular smooth muscle cells of diabetic mice. Circle Resources, 103(6): 615-623.
- Rehman, H.U., Hameed, A., Ahmed, S. (2012). Selection and Characterization of a Glutamate Yielding Mutant of Corynebacteriumglutamicum– a Soil Isolate from Pakistan. Pakistan Veterinary Journal, 32(1): 20-24.
- Sattar, M., Ahmed, S., Sheikh, M.A., Hashmi, A.S. (2008). Fermentation of yeast sludge with Brevibacteriumflavumto enhance glutamate concentration. Journal of Chemical Society of Pakistan, 30 (4):642-648.
- Shagufta, I. (2014). Bioconversion of Agricultural Wastes to Glutamate and its Biological Evaluation in Broiler Chicks. A PhD Thesis Submitted to the Department of Biochemistry, Faculty of Biosciences, University of Veterinary and Animal Sciences Lahore, Pakistan. Pp1-183.
- Shah, A.H., Hameed, A. and Khan, G.M. (2002).Improved microbial production of glutamic acid by developing a new auxotrophic mutant of Corneybactenumglutamicum. Pakistan. Journal Biological Sciences, 5:80–83.
- Sthiannopkao, S., Danner, H., Braun, R. (2001). Use of Grass Sap as an Ingredient in GlutamateProduction. Thammasat International Journal of Science and Technology, 6:3-4.
- Tavakkoli, M., Hamidi-Esfahani, Z., Mohammad, H. A. (2009). Optimization of Corynebacterium bacterium for glutamic acid production by Response surface methodology. Food and Bioprocess Technology, 10(9): 242-247.
- Vijayalakshm, P. and Sarvamangala D. (2011). Production of L-glutamic acid by ArthrobacterglobiformisMTCC 4299 fruits of MimusopsElengilinn. International Journal of Applied Biology and Pharmaceutical Technology, 2:167-173.
- Yugandhar, N.M., Raju, Ch.A.I., Rao, P.J., Jaya Raju, K., Sri Rami Reddy, D. (2007). Production of Glutamic acid Using Brevibacteriuroseomwith Free Immobilised Cells. Reseasrch Journal of Microbiology, 2:584-589.
- Zahoor, A., Lindner, S.N., Wendisch, V.F. (2012) Metabolic engineering of Corynebacteriumglutamicumaimed at alternative carbon sources and new products. Computational and Structural Biotechnology Journal, 3(4): 1-11.


