
Journal of Earth and Atmospheric Sciences, Vol. 1, No. 2, November 2016 Publish Date: Jan. 9, 2017 Pages: 44-59
Frequency of Hurricanes’ Driven Floods not Increasing Under Global Warming
A. Parker*
School of Engineering and Physical Science, James Cook University, Townsville QLD, Australia
Abstract
It has been claimed from the analysis of the data collected over the last 216 years that the frequency of Hurricane Sandy-like floods has increased from once every 1,200 years to once every 400 years. This statement is wrong. The data suggest that across the continental US and NY City the frequency of hurricanes is reducing while the sea levels are rising not dramatically and without any acceleration component. 2012 Hurricane Sandy occurred 21.19 years after 1991 Hurricane Bob. Since the late 1930s, the prior 9 Hurricanes occurred after a delay of 6.33 years on average, maximum 11.69 years, minimum 0.03 years (Hurricane Edna of category-1 occurred on 11-Sep-1954, only 11 days after category-3 Hurricane Carol of 31-Aug-1954). Across the continental US, the number of hurricanes per decade has been reducing at a rate of -0.256% per year, or -2.56% per decade, since 1851. In NY City, the sea levels are rising +2.84 mm/year with no acceleration. Across the continental US, on average the sea levels are rising +1.77 mm/year also with no acceleration. No statistic can be made without good quality data spanning a significant amount of time that for climate studies should be at least above 60 years. Definitively no statistic can be computed over time scales not covered by any data.
Keywords
Sea Level Rise, Sea Level Oscillations, Sea Level Acceleration, Hurricanes, United States, New York
Received: November 5, 2016
Accepted: December 20, 2016
Published online: January 9, 2017
@ 2016 The Authors. Published by American Institute of Science. This Open Access article is under the CC BY license. http://creativecommons.org/licenses/by/4.0/
Contents
1. Introduction
Ref. [1] investigates the frequency of Hurricane Sandy-level floods in NY City from 1800 to present. They assume the frequency varies with changes in sea-levels and storm surge climatology. They estimate the frequency of future floods from past sea-levels’ proxies and tide-gauge measurements and future sea-levels climate models’ predictions. They say the frequency of hurricane Sandy-like flooding has approximately tripled since 1800, from once every 1,200 years to once every 400 years. It will increase to once every 90 years by 2100 due to the effects of sea-level rise alone, with changes in storm climatology affecting the estimated frequency from once in 23 years to once in 130 years.
The highlights of the paper in PNAS, Ref. [2], is quite clear in summarizing the findings. "A study estimates the frequency of future Hurricane Sandy-like floods in New York City. The storm surge due to Hurricane Sandy caused flooding nearly 3 m above high tide in New York City in October 2012. The frequency at which such flooding occurs varies with changes in sea level and storm surge climatology, and estimating changes in this frequency over time could be valuable for risk mitigation. Ning Lin and colleagues examined how the frequency of Sandy-level floods in New York City has changed from 1800 to the present, and estimated the frequency of future floods. The authors estimated past sea levels from historical data and future sea levels from probabilistic projections under moderate greenhouse gas emissions. Further, the authors used reanalysis data and global climate models to estimate the current and future frequency and severity of storms. The authors estimated that the frequency of Sandy-level floods has approximately tripled since 1800, from once every 1,200 years to once every 400 years, and is likely to increase to once every 90 years by the year 2100 due to the effects of sea level rise alone. When future changes in storm climatology were taken into account, the estimated frequency in 2100 varied from once in 23 years to once in 130 years, depending on the particular climate model used, according to the authors."
Ref. [3], tell us that "For an experiment or survey: Relative frequency = number of times the event happens ÷ total number of trials. For example, if you observed 100 passing cars and found that 23 of them were red, the relative frequency is 23/100." This means that if we observe how many years since 1800 had hurricane Sandy-like floods, there has been for sure one, Sandy, and possibly few more, this means the minimum frequency is 1/216 (we are in 2016). Frequencies cannot be claimed to increase "from once every 1,200 years to once every 400 years" looking at 216 years of data. You need at least 1,200 years of data to claim that one event only occurred once every 1,200 years.
Apart from basic mathematics arguments, the paper is a confusion about whether there is an increase in hurricanes, or increase in floods, or increase in storm surges, all without any proper empirical evidence to support any claim, to conclude with the alarmist statement that hurricane floods are on the rise because of global warming. There are hurricane and sea-level data for up to about 165 years, and they do not support the claim.
2. Hurricanes Data
The continental US coastline has been calm over the last decade, as shown in Ref. [4]. The list of 1850-2015 continental US hurricanes officially recorded to have produced sustained winds of speed greater than 74 mph in the HURDAT data base does not show any increasing trend. Actually it is the opposite, Figure 1. There is an oscillatory pattern about a sharply declining trend with the number-of-events reducing -0.256% per year. As it is more likely to have missed some events in the far past rather than recently, the true trend is very likely even more negative. The full list of hurricanes that impacted/landed in the continental US is reported in Appendix 1.
In the case of the Hurricanes, not only "the narrative" is conflicting with the empirical evidence. It is also conflicting with the climate models. While the "best climate science" may predict the future will hold strongest storms, it doesn’t predict at all that the future will hold more hurricanes, as also most of the models actually predict that there will be fewer, Ref. [5] and Ref. [6].
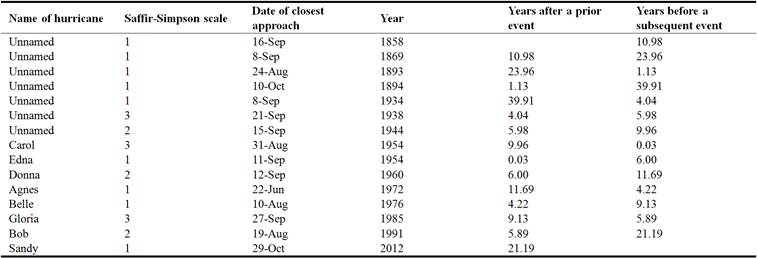
Table 1 presents the list of NY City Hurricanes 1850 to 2015, while Figure 2 presents the number of years between hurricane impacts/landfalls in NY City. 2012 Hurricane Sandy occurred 21.19 years after 1991 Hurricane Bob. The prior 9 Hurricanes occurred after a delay of 6.33 years on average, maximum 11.69 years, minimum 0.03 years (Hurricane Edna of category-1 occurred on 11-Sep-1954, only 11 days after category-3 Hurricane Carol of 31-Aug-1954). Since 1940, the frequency is reducing.
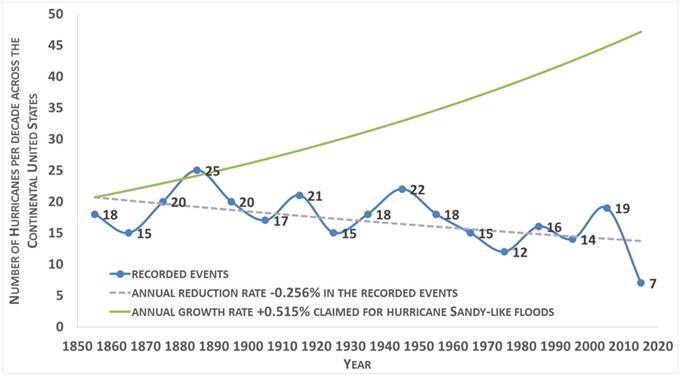
Figure 1. Continental US hurricane impacts/landfalls per decade 1850s to 2010s. Data from Ref. [4]. For the 2010s, a total number of 7 impacts/landfalls is considered, as 4 events actually occurred over 6 years of 10. For the 1850s, a total number of 18 impacts/landfalls is considered, as 16 events actually occurred over 9 years of 10. The number of events has diminished of -0.256% every year over the period of observation.
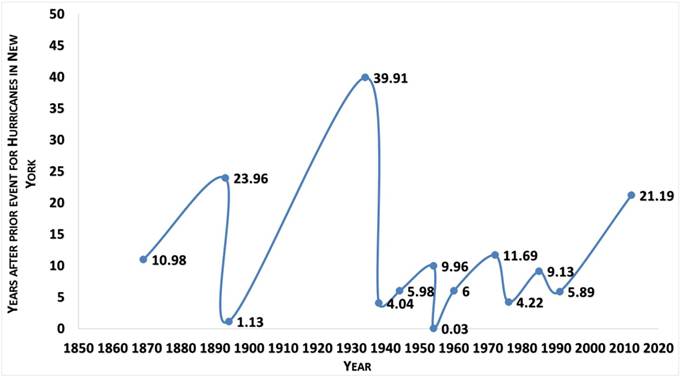
Figure 2. Number of years between hurricane impacts/landfalls in NY City. Data from Ref. [4]. Since 1940, the frequency is reducing.
Table 1. NY City Hurricanes 1850 to 2015 (from Ref. [4]).
3. Sea Level Data
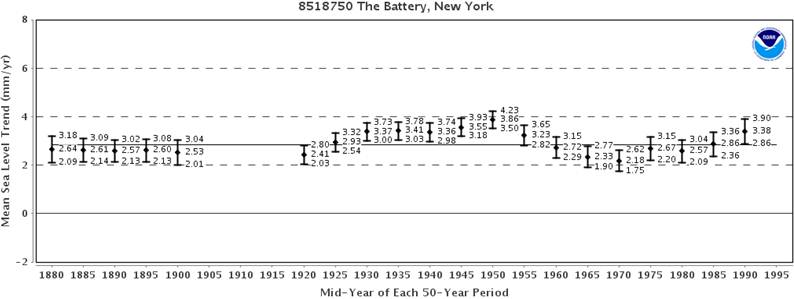
In NY similarly to everywhere else in the US and the world, the rate-of-rise of sea-levels at the tide-gauges is about constant and not dramatic, as shown by the present mean-sea-level trends, the linear mean-sea-level trends calculated in overlapping 50-year increments, the linear mean-sea-level trends recalculated each year, plus all the other acceleration parameters that have been proposed so far, Ref. [7-11].
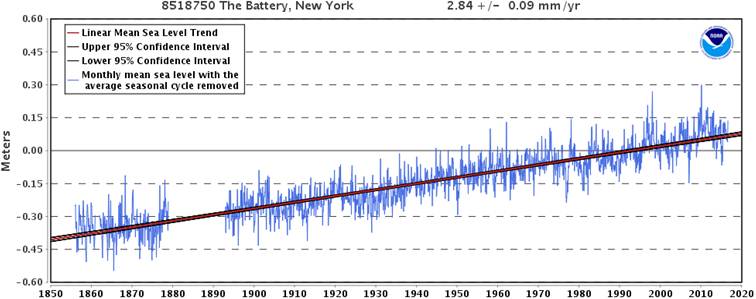
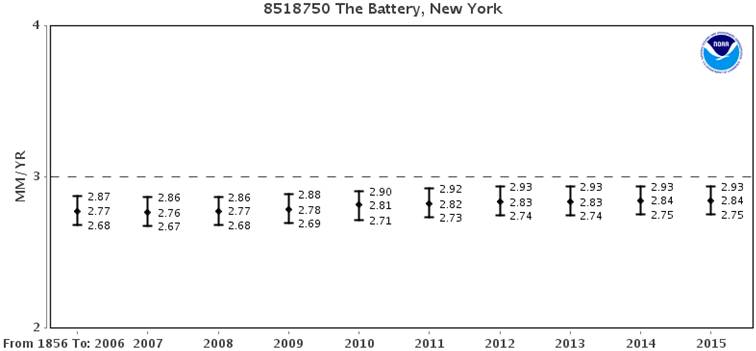
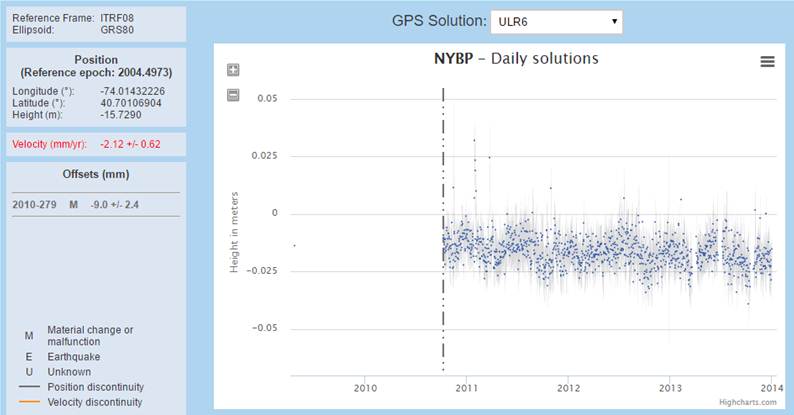
The rate-of-rise at The Battery tide-gauge based on monthly mean-sea-level data from 1856 to 2015 from NOAA, Ref. [12], is +2.84 mm/year, and about constant, as the acceleration parameters are about zero, Ref. [8-12]. The subsidence of the nearby GPS dome of Battery Park from SONEL, Ref. [13], is -2.12 mm/year. The sea-level is rising in The Battery because of an overwhelming land subsidence at fairly constant rate.
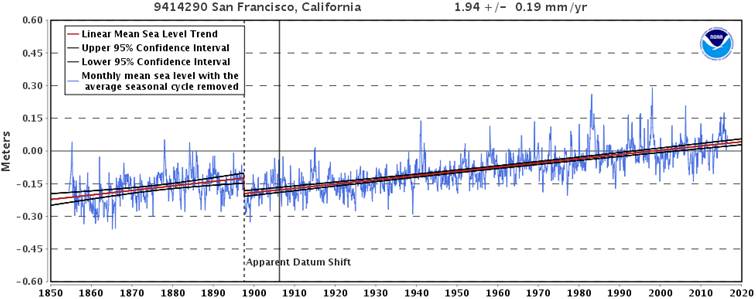
Figures 3 and 4 show the mean sea levels measured in The Battery and San Francisco, plus the GPS velocity of nearby GPS domes. Images are taken from Ref. [12-15].
In New York the rate of rise is stable about +2.84 mm/year since a century. Over the last 100 years, the 50 years’ sea level rises have been mostly oscillating about the same trend. Over the last decade there have been changes in the sea level rate of rise of the order of + tens of micrometres per year only to reflect a positive phase of the multi-decadal oscillations. In San Francisco, the changes in the sea level rate of rise over the last decade are of the order of - tens of micrometres per year to reflect only a negative phase of the same multi-decadal oscillations that is only phased differently.
a
b
c
d
Figure 3. New York sea level rate (a, b, c) and nearby GPS dome vertical velocity (d). Images from [12, 13]. (b) The linear mean sea level trends are calculated in overlapping 50-year increments. The variability of each 50-year trend, with 95% confidence interval, is plotted against the mid-year of each 50-year period. (c) The linear mean sea level trends and 95% confidence intervals calculated from the beginning of the station record to recent years.
a
b
c
d
Figure 4. San Francisco sea level rate (a, b, c) and nearby GPS dome vertical velocity (d). Images from [14, 15]. (b) The linear mean sea level trends are calculated in overlapping 50-year increments. The variability of each 50-year trend, with 95% confidence interval, is plotted against the mid-year of each 50-year period. (c) The linear mean sea level trends and 95% confidence intervals calculated from the beginning of the station record to recent years.
At the average tide gauge across the continental US, the sea levels are stable, as indicated by the same values year after year of sea level surveys as those in Reference [17].
The full list of tidal stations in the continental US and their sea level rise is reported in Appendix 2. The likely subsidence of the instrument may be inferred from the GPS velocities of [18].
4. Discussion
The connection between hurricanes and global warming has political rather than scientific origin [19]. As shown in [20], a significant number of scientific papers has discredited the claim of hurricanes made worse by global warming despite the political pressure.
According to Ref. [21], mid-latitude northwest Atlantic land-falling cyclones are reducing under global warming.
Ref. [22] states that no long-term trend is observed in either the frequency or intensities of tropical cyclones making land-fall in South China.
According to Ref. [23], the global frequency of category 4 and 5 hurricanes has shown a small, insignificant downward trend over the period 1990-2014. In Ref. [24], it was already shown that the frequency of intense Atlantic Hurricanes reduced during the prior five decades.
Ref. [25] highlighted a significant reduction in the late-season typhoon activity over the western north Pacific 1995 to 2011 vs. 1979 to 1994.
Ref. [26] analysed the intense tropical cyclone activities in the northern Indian Ocean. During the period 1980 to 2009, 21 cyclones became intense, 5 during the first decade, 11 during the central decade, and 5 during the last decade. There was therefore no trend towards an increase in the number of categories 3–5 cyclones over the 30 years.
Ref. [27] shows that between 1979 and 2014, the number of strong cyclones in Northern Hemisphere in summer has decreased at a rate of 4% per decade. Near northeaster North America, an even larger decrease was found.
Ref. [28] noticed the sharp decline in both the number and intensity of land-falling U.S. hurricanes during the period 1961 to 2000.
Based on proxies, Ref. [29] reconstructed that the Great Barrier Reef of Australia experienced at least five super-storms over the past 200 years, with the area now occupied by Cairns experiencing two super-cyclones between 1800 and 1870. The 20th century, however, was totally empty of super-cyclones, with only one event since European settlement occurred in 1899.
Ref. [30] analysed the Eastern Tropical Pacific hurricane variability and landfalls on Mexican coasts. They found that over the period 1970-2010 the intense hurricanes Category 4 and 5 did not show a significant trend, while the frequency of weak and intense hurricanes Categories 1 to 5 decreased significantly at a rate of -0.95% per year.
Ref. [31] analysed the tropical cyclones in the Lesser Antilles 1690–2007. They found no significant trends in the total number of tropical cyclones. The total number of hurricanes in the 20th century was actually 20% lower than in previous centuries.
Ref. [32] analysed based on proxies the Australian tropical cyclone activity over the past 550-1,500 years. They show that the present low levels of storm activity on the mid-west and north-east coasts of Australia are unprecedented.
Ref. [33] evidenced an abrupt decrease in the tropical cyclone activities in the South China Sea over the period 2003 to 2010 vs. the period 1990 to 2002.
Ref. [34] shows a decline in the number of severe tropical cyclones making land-fall over eastern Australia since the late nineteenth century.
Ref. [35] discusses the tropical cyclone activity over the western North Pacific over the period 1960 to 2011. This activity exhibits a significant inter-decadal variation with two distinct active and inactive periods. The recent period 1998 to 2011 is inactive period.
The proxy reconstruction for the Gulf of Thailand of Ref. [36] suggests that the frequency of typhoon strikes was 2–5 times greater from 3900 to 7800 years BP compared to 0–3900 years BP.
Also based on proxies, but for the Mediterranean, South East Spain, Ref. [37], extreme events occurred around 5250, 4000, 3600, 3010, 2300, 1350, 650, and 80 years BP. No comparable events have been observed during the 20th and 21st centuries.
Why hurricanes have decreased under global warming is unclear. As it is admitted in [38], "It is premature to conclude that human activities–and particularly greenhouse gas emissions that cause global warming–have already had a detectable impact on Atlantic hurricane or global tropical cyclone activity." For many years, the upper ocean temperature has been considered the key factor [39, 40] for hurricanes. According to the recent paper [41], the near-surface air temperature and the moisture around the hurricane are also crucial for sustaining a hurricane. These two other parameters are often even more important than the upper ocean temperature [41]. Unfortunately, there is no detailed knowledge of all the relevant parameters affecting formation and development of hurricanes to explain the clearly decreasing pattern in the number of hurricanes 1850-2015 of Figure 1.
As evidence-based science is not permitted to claim what the politicians do not want, the solution will be that a new classification of hurricanes will be proposed soon. If other criteria different from the Saffir-Simpson hurricane scale, which provide a rating based on a hurricane’s sustained wind speed will be redefined, with a new metric, like rainfall and storm surge floods, it will be possible to claim every hurricane "unprecedented" since millennia.
5. Conclusion
There is no evidence of sea-level rising at dramatic, accelerating rates or hurricanes occurring at increasing frequencies. Ref. [1] therefore does not demonstrate quantitatively that the frequency of hurricane Sandy-like extreme flood events has increased significantly over the past two centuries and is very likely to increase more sharply over the 21st century. This is a supposition unsupported by actual data.
Appendix 1 - List of Hurricanes That Impacted the Continental US Since 1851
This is the table (from Ref. [5]) of Continental United States Hurricane Impacts/Landfalls 1851-2015 Revised in July 2016 to include the 1956 to 1960 hurricane seasons' reanalysis as it was defined in October 2016. To permit claims of "unprecedented" events, a new classification is on the way, and the table will soon disappear.
Table A1.1. Continental United States Hurricane Impacts/Landfalls 1851-2015.
Appendix 2 – Linear Sea Level Trends in the Tide Gauge Stations of the Continental US
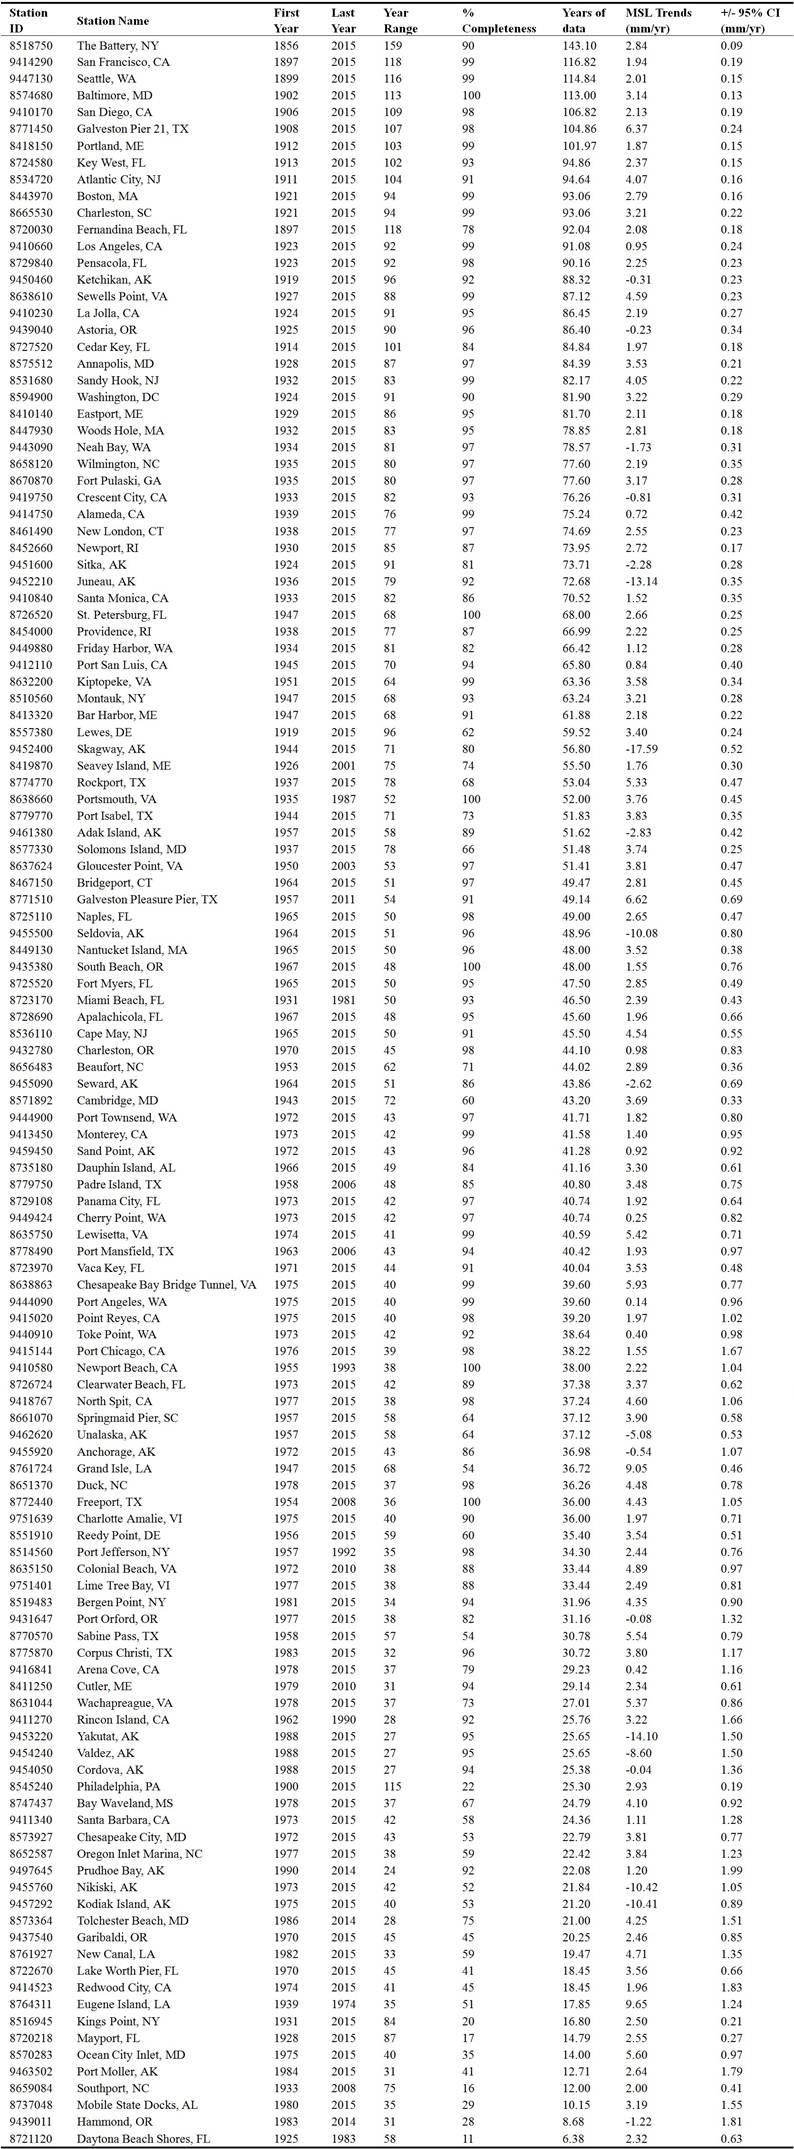
This is the table (from Ref. [19]) with the sea level trends for tidal stations across the Continental US (from [19]). The number of years considered to derive a trend is the product of years range by completeness %. The average sea level rise in the 126 stations is +1.76 mm/year. By only considering realistic the trends obtained by considering more than 60 years of data accounting for the multi-decadal oscillations, the average sea level rise is +1.77 mm/year in 41 stations. Comparison with prior similar surveys returns similar trends, demonstrating the lack of any acceleration.
Table A2.1. Sea level trends for tidal stations across the Continental US.
References
- N. Lin, R. E. Kopp, B. P. Horton, and J. P. Donnelly (2016), Hurricane Sandy’s flood frequency increasing from year 1800 to 2100, PNAS, doi: 10.1073/pnas.1604386113
- http://www.pnas.org/content/113/43/12071.full, accessed October 30, 2016.
- http://www.pnas.org/site/media/selections_10_10_16.xhtml, accessed October 30, 2016.
- http://www.bbc.co.uk/bitesize/ks3/maths/handling_data/relative_frequency/revision/2/, accessed October 30, 2016.
- http://www.aoml.noaa.gov/hrd/hurdat/All_U.S._Hurricanes.html, accessed October 30, 2016.
- H. Sobel at al. (2016), Human influence on tropical cyclone intensity, Science, 353 (6296): 242-246.
- http://www.nytimes.com/2016/07/15/opinion/where-are-the-hurricanes.html?_r=0, accessed October 30, 2016.
- https://tidesandcurrents.noaa.gov/sltrends/, accessed October 30, 2016.
- A. Parker (2013), SEA LEVEL TRENDS AT LOCATIONS OF THE UNITED STATES WITH MORE THAN 100 YEARS OF RECORDING, Natural Hazards, 65 (1): 1011-1021.
- A. Parker (2013), Apparent hot and cold spots of acceleration along the Atlantic and Pacific coasts of the United States, Nonlinear Engineering, 3 (1): 51–56.
- A. Parker and C. D. Ollier (2016), COASTAL PLANNING SHOULD BE BASED ON PROVEN SEA LEVEL DATA, Ocean and Coastal Management, 124: 1–9.
- A. Parker (2016), The Sea Levels are Now Reducing in the "Hotspots of Acceleration" of Washington and New York, Journal of Earth and Atmospheric Sciences, 1 (1): 1-9.
- https://tidesandcurrents.noaa.gov/sltrends/sltrends_station.shtml?stnid=8518750, accessed October 30, 2016.
- http://www.sonel.org/spip.php?page=gps&idStation=2722, accessed October 30, 2016.
- https://tidesandcurrents.noaa.gov/sltrends/sltrends_station.shtml?stnid=9414290, accessed October 30, 2016.
- http://www.sonel.org/spip.php?page=gps&idStation=1886, accessed October 30, 2016.
- https://tidesandcurrents.noaa.gov/sltrends/mslUSTrendsTable.htm, accessed October 30, 2016.
- http://www.sonel.org/IMG/txt/vertical_velocities_table.txt, accessed October 30, 2016.
- http://principia-scientific.org/man-made-climate-hurricanes-statistically-re-classified-create/, accessed October 30, 2016.
- http://principia-scientific.org/30-scientific-papers-discredit-connection-hurricanes-global-warming/, accessed October 30, 2016.
- Perrie, W., Yao, Y. and Zhang, W. (2010), On the impacts of climate change and the upper ocean on midlatitude northwest Atlantic landfalling cyclones, Journal of Geophysical Research: Atmospheres, 115 (D23).
- Zhang, Q., Zhang, W., Lu, X. and Chen, Y. D. (2012), Landfalling tropical cyclones activities in the south China: intensifying or weakening?, International Journal of Climatology, 32 (12): 1815-24.
- Klotzbach, P. J. and Landsea, C. W. (2015). Extremely intense hurricanes: revisiting Webster et al.(2005) after 10 years. Journal of Climate, 28 (19): 7621-7629.
- Landsea, C. W., Nicholls, N., Gray, W. M. and Avila, L. A. (1996), Downward trends in the frequency of intense at Atlantic Hurricanes during the past five decades. Geophysical Research Letters, 23 (13): 1697-1700.
- Hsu, P. C., Chu, P. S., Murakami, H. and Zhao, X. (2014), An Abrupt Decrease in the Late-Season Typhoon Activity over the Western North Pacific. Journal of Climate, 27 (11): 4296-4312.
- Hoarau, K., Bernard, J. and Chalonge, L. (2012), Intense tropical cyclone activities in the northern Indian Ocean. International Journal of Climatology, 32 (13): 1935-1945.
- Chang, E. K., Ma, C. G., Zheng, C. and Yau, A. M. (2016), Observed and projected decrease in Northern Hemisphere extratropical cyclone activity in summer and its impacts on maximum temperature. Geophysical Research Letters, 43 (5): 2200-2208.
- Blake, E. S., Rappaport, E. N. and Landsea, C. W. (2011), The deadliest, costliest, and most intense United States tropical cyclones from 1851 to 2006 (and other frequently requested hurricane facts), NOAA National Weather Service, National Centers for Environmental Prediction, National Hurricane Center. NOAA Technical Memorandum NWS NHC-6.
- Nott, J. and Hayne, M. (2001), High frequency of ‘super-cyclones’ along the Great Barrier Reef over the past 5,000 years. Nature, 413 (6855): 508-512.
- Martinez-Sanchez, J. N. and Cavazos, T. (2014), Eastern Tropical Pacific hurricane variability and landfalls on Mexican coasts. Climate Research, 58 (3): 221-234.
- Chenoweth, M. and Divine, D. (2008), A document - based 318 - year record of tropical cyclones in the Lesser Antilles, 1690–2007. Geochemistry, Geophysics, Geosystems, 9 (8).
- Haig, J., Nott, J. and Reichart, G. J. (2014), Australian tropical cyclone activity lower than at any time over the past 550-1,500 years. Nature, 505 (7485): 667-671.
- Ha, Y. and Zhong, Z. (2015), Decadal Change in Tropical Cyclone Activity over the South China Sea around 2002/03. Journal of Climate, 28 (15): 5935-5951.
- Callaghan, J. and Power, S. B. (2011), Variability and decline in the number of severe tropical cyclones making land-fall over eastern Australia since the late nineteenth century. Climate Dynamics, 37 (3-4): 647-662.
- Liu, K. S. and Chan, J. C. (2013), Inactive period of western North Pacific tropical cyclone activity in 1998–2011. Journal of Climate, 26 (8): 2614-2630.
- Williams, H., Choowong, M., Phantuwongraj, S., Surakietchai, P., Thongkhao, T., Kongsen, S. and Simon, E. (2016), Geologic records of Holocene typhoon strikes on the Gulf of Thailand coast. Marine Geology, 372: 66-78.
- Dezileau, L., Pérez-Ruzafa, A., Blanchemanche, P., Degeai, J. P., Raji, O., Martinez, P., Marcos, C. and Grafenstein, U. V. (2016), Extreme storms during the last 6500 years from lagoonal sedimentary archives in the Mar Menor (SE Spain). Climate of the Past, 12 (6): 1389-1400.
- https://www.gfdl.noaa.gov/global-warming-and-hurricanes/, accessed October 30, 2016.
- Price, J. F. (1981), Upper ocean response to a hurricane. Journal of Physical Oceanography, 11 (2): 153-175.
- Goldenberg, S. B., Landsea, C. W., Mestas-Nuñez, A. M. and Gray, W. M. (2001), The recent increase in Atlantic hurricane activity: Causes and implications. Science, 293 (5529): 474-479.
- Cione, J. J. (2015), The relative roles of the ocean and atmosphere as revealed by buoy air–sea observations in hurricanes. Monthly Weather Review, 143 (3): 904-913.


