
Journal of Earth and Atmospheric Sciences, Vol. 1, No. 2, November 2016 Publish Date: Nov. 2, 2016 Pages: 36-43
A Critique of Satellite Global Mean Sea Levels
A. Parker1, *, C. D. Ollier2
1School of Engineering and Physical Science, James Cook University, Townsville QLD, Australia
2School of Earth and Geographical Sciences, University of Western Australia, Perth, WA, Australia
Abstract
The global mean sea levels (GMSL) from the satellite altimetry missions have been provided since 1993. It is shown here that these results are more a computation than a true measurement, suffering of arbitrary adjustments and corrections, and failing validation against more accurate and reliable products. Sea levels provided by a network of tide gauges provide a superior result.
Keywords
Sea Level Rise, Sea Level Oscillations, Sea Level Acceleration, Cherry Picking, Satellite Altimeter, Global Positioning System
Received: October 9, 2016
Accepted: October 18, 2016
Published online: November 2, 2016
@ 2016 The Authors. Published by American Institute of Science. This Open Access article is under the CC BY license. http://creativecommons.org/licenses/by/4.0/
Contents
1. Introduction
It is a claimed that by using satellites we can measuring the instantaneous state of the seas and so compute the time rate of change in sea level with a resolution of hundreds of micro-meters per year. The TOPEX and Jason satellite radar altimeters provide the data. Below in Figure 1 is the Satellite GMSLfrom [1], and the trend is 3.4±0.4 mm/yr. The Figure also presents the map of absolute mean sea level (MSL) trend. The impression from the chosen colour palette is that the absolute mean sea levels are rising everywhere, with a trend of +3.4 mm/yr. This is simply not true.
2. Determination of Absolute Sea Level Height Is not Simple
There is no such thing as an altimeter placed on a single satellite that can actually measure the instantaneous state of the sea surface all over the world with the claimed accuracy. The ±0.4 mm/yr in the +3.4±0.4 mm/yr GMSL claim of Figure 1 is only the fitting accuracy. Every single "measured" point has an unassessed accuracy, as nobody ever validated the GMSL product, which is more a computation than a measurement.
As written in [1]: "Since 1993, measurements from the TOPEX and Jason series of satellite radar altimeters have allowed estimates of global mean sea level. These measurements are continuously monitored against a network of tide gauges. When seasonal variations are subtracted, they allow estimation of the global mean sea level rate. As new data, models and corrections become available, we continuously revise these estimates (about every two months) to improve their quality."
As may be inferred from the words "These measurements are continuously monitored against a network of tide gauges." and "models and corrections become available", the final result depends more on computation than measurement.
As explained in [3], "Altimetry is a technique for measuring height. Satellite altimetry measures the time taken by a radar pulse to travel from the satellite antenna to the surface and back to the satellite receiver. Combined with precise satellite location data, altimetry measurements yield sea-surface heights." To make this simple, the altimeter determines the distance satellite-to-surface by measuring the round-trip time of a radar pulse. From the position of the satellite tracked against a reference ellipsoid, and some hypothesis about the medium in between the satellite and the surface, and about the homogeneity and statistics of the surface, there is the opportunity to compute the absolute sea level height, but only along the path of the satellite, and even then subject to the many sources of inaccuracies mentioned. Determination of the absolute sea level height is not simple.
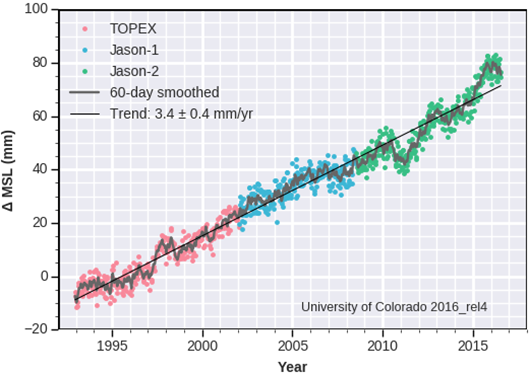
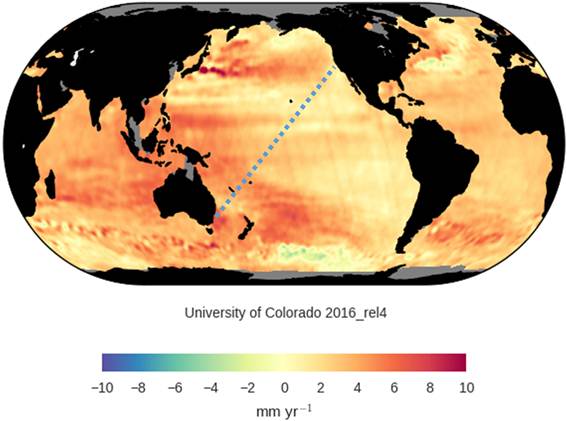
Figure 1. GMSL trend (from [1]) and absolute mean sea level map (image from [2]). Added to the trend map is a transverse of the Pacific Ocean Sydney to San Francisco.
3. Role of Subjective Calibration and Correction
The reported absolute global mean sea level (GMSL) product includes the calibration against a network of cherry-picked tide gauges; the generic introduction of models and unspecified corrections; and a major correction for glacial isostatic adjustment (GIA). The last is to account for the "fact that the ocean basins are getting slightly larger since the end of the last glacial cycle" as written in [4]. "Averaged over the global ocean surface, the mean rate of sea level change due to GIA is independently estimated from models".
We would imagine absolute global mean sea level (GMSL) to be somewhat noisy in first instance, as the sea surface is rough and the satellite position is also subjected to inaccuracies. This noisy signal is then manipulated to produce consistency with the cherry-picked tide gauges and corrected for GIA and others modelled factors [26]. This is already enough to cast serious doubts about the reliability of the product, but there is more. If the sea level rise trend is not yet what is desired, a drastic one-off "administrative correction" is introduced.
Figure 2 below is the GMSL as it was shown in April 2000 (from [5]) and how it was revised roughly one year later (from [6]). This administrative correction is discussed in [26].
Similar drastic one-off "administrative corrections" have been applied to other satellite-based products that try to trace the state of the sea levels. Figure 3 below shows the "administrative correction" to the ENVISAT product immediately after the satellite failure. Images are from [7] and [8].
The GMSL product is therefore something based on a very difficult measurement which is then subjected to many corrections including administrative "adjustments". This makes the GMSL result unreliable.
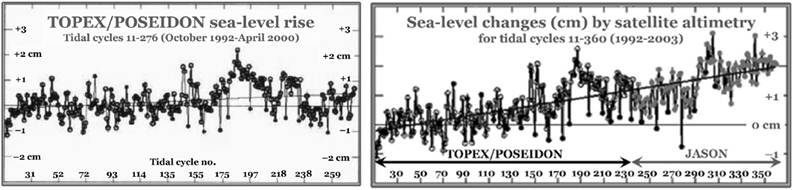
Figure 2. Satellite altimeter GMSL in April 2000 (from [5], left) and in 2003 (from [6], right).
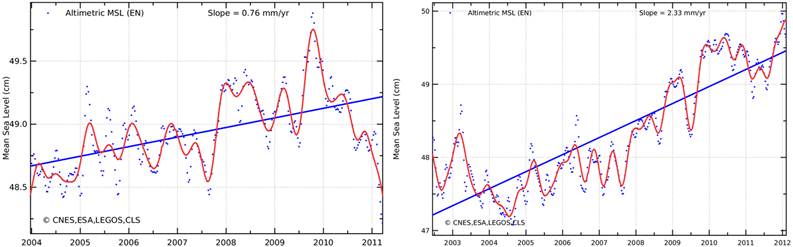
Figure 3. Satellite GMSL before correction (from [7], left) and after correction (from [8], right).
4. Validation of the GMSL Product
As written in [9], "The global mean sea level (GMSL) we estimate is an average over the oceans (limited by the satellite inclination to ± 66 degrees latitude), and it cannot be used to predict relative sea level changes along the coasts." The reason of this claim, as explained in the same faq, is that "Local tide gauges measure the sea level at a single location relative to the local land surface, a measurement referred to as "relative sea level" (RSL). Because the land surfaces are dynamic, with some locations rising (e.g., Hudson Bay due to GIA) or sinking (e.g., New Orleans due to subsidence), relative sea level changes are different across world coasts." This contradicts the statement of the same faq "We do compare the altimeter sea level measurements against a network tide gauges to discover and monitor drift in the satellite (and sometimes tide gauge) measurements."
If what is needed to make a comparison between the GMSL product and the tide gauge result is an estimation of the vertical velocity of the tide gauge instrument, this result may be guessed by using the satellite GPS (and possibly precise levelling tide gauge vs. GPS dome). There is no reason why the GPS tracking of fixed domes should produce results less accurate than the satellite altimeter monitoring of the continuously oscillating sea surface.
The GPS is based on a constellation of more than 30 satellites widely used for many serious applications. The tracking of fixed GPS domes is much easier than the measurement of the instantaneous state of the entire surface of the world oceans, but even the accuracy on the vertical velocities of GPS domes is still about ±2 mm/yr. As written in [10], "For the purpose of using tide gauges to derive true long term sea level changes, an important research issue is the implementation of an appropriate GPS processing strategy to estimate vertical velocities at each station with an accuracy better than 1 mm/yr, and hopefully much better than this within a decade or so. However, the use of GPS to monitor vertical land motions at tide gauges has proven to be not as straightforward as some supposed 15 years ago. Determining rates of vertical land motion with an accuracy better than 1 mm/yr is still a very challenging problem in Geodesy today."
We may then consider a transverse of the Pacific Ocean Sydney to San Francisco passing through Honolulu (the tide gauge measurements are only available on land) to check the accuracy of the GMSL product.
Figures 4, 5 and 6 below shows the monthly average mean sea levels (MSL) over the full length of the record and since October 1992 – the same short time window of the satellite altimeter - and the absolute vertical velocities of nearby Global Positioning System (GPS) domes, across the Pacific, from Sydney to San Francisco through Honolulu (MSL image a from [11], data for MSL picture b is from [12] and GPS vertical velocity image c is from [13]).
In Sydney the long term MSL trend is +0.65 mm/yr based on data from 1886 to 2010, while the apparent short term MSL trend is +3.52 mm/yr. The Fort Denison tide gauge has latitude -33.854667 and longitude 151.225778 [13]. The nearby GNSS stations is SYD. The SYD GPS dome has latitude -33.78088056 and longitude 151.15038060. This GPS dome has a subsidence of -0.46 mm/yr [13]. The most likely absolute sea level rise in Sydney is therefore about +0.2 mm/yr, while the apparent (the short time window amplifies the effects on the multi-decadal oscillations to produce sea level rates of rise smaller or larger than the expected) absolute sea level rise in Sydney is +3.06 mm/yr. According to the satellite altimeter, Figure 1, the absolute global mean sea level is rising at a rate well above the global average in front of Sydney. The absolute sea level rise from the satellite altimeter is approaching the top of the scale of 10 mm/yr, about 3 times what is measured by the tide gauge and the GPS.
In Honolulu the long term MSL trend is +1.41 mm/yr based on data from 1905 to 2015, while the apparent short term MSL trend is +0.25 mm/yr. The tide gauge of Honolulu has latitude 21.306667 and longitude -157.866667 [13]. The nearby GNSS stations is HNLC [13]. The HNLC GPS dome has latitude 21.30328737 and longitude -157.86454399. The subsidence is -0.41 mm/yr [13]. The most likely absolute sea level rise in Honolulu is therefore about +1.0 mm/yr, but the apparent absolute sea level rise in Honolulu is negative and about -0.16 mm/yr. According to the satellite altimeter, Figure 1, the absolute global mean sea level is rising at a rate not that far from the global average around Honolulu. The absolute sea level rise is therefore strongly overrated.
In San Francisco the long term MSL trend is +1.91 mm/yr with based on data from 1897 to 2015, due to an apparent datum shift that is now claimed by NOAA to avoid considering the data since 1854. When considering all the data in the aligned record that is still proposed by PSMSL, the MSL trend reduces to +1.44 mm/yr. The apparent short term MSL trend is +0.72 mm/yr. The San Francisco tide gauge has latitude 37.806667 and longitude -122.465. The nearby GNSS stations is UCSF [13]. The UCSF GPS dome has longitude -122.45814903 and latitude 37.76296721. The subsidence is -0.94 mm/yr [13]. The most likely absolute sea level rise in San Francisco is therefore about +1.0 mm/yr, but the apparent absolute sea level rise in Honolulu is negative at about -0.22 mm/yr. According to the satellite altimeter, Figure 1, the absolute global mean sea level seems to rise also in front of San Francisco, but the tide gauge and the GPS tell us a different story.
It therefore appears clear that the satellite product is built to magnify the rising trends.
Figure 7 (from [13]) is an image of the trend of sea level change of 2008. This pattern of sea level change around the world over the period 1993-2008 looks different from Figure 1 mostly because of the use of a different colour palette, as the average rate of rise is about the same. It is interesting to note that the pattern of change is quite irregular, that the global average does not mean a lot, and that there are areas of positive as well as negative trend, similarly to the tide gauges’ result [14-25].
Also the map of Figure 7, similarly to the map of Figure 1, is biased towards higher sea level rises, but has a colour palette that does not cancel completely the impression of having rising and falling trends.
For a more quantitative comparison of the result of the tide gauge MSL corrected for the vertical motion of the instrument and the satellite altimeter sea surface height (SSH), Figure 8 finally presents the results for Sydney and Honolulu (for San Francisco there is no altimeter data).
The SSH data are from [28]. The Interactive Sea Level Time Series Wizard returns the SSH data for a location, given as latitude and longitude, averaged over a 1 degree latitude by 1 degree longitude box.
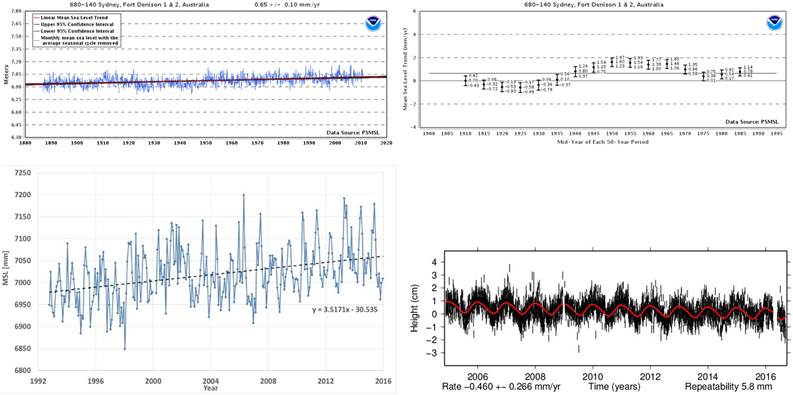
Figure 4. (a) Relative sea level rise at the Fort Denison tide gauge over the full time window. (b) Variation of 50-Year mean Sea Level Trends in the Fort Denison tide gauge. (c) Relative sea level rise at the Fort Denison tide gauge over the short time window October 1992 to present of the satellite. (d) Vertical position of the nearby SYD GPS dome. (MSL images (a) and (b) are from [11], data for the MSL picture (c) is from [12], GPS vertical velocity image (d) is from [13]). The short term absolute sea level rise trend is +3.06 mm/yr.
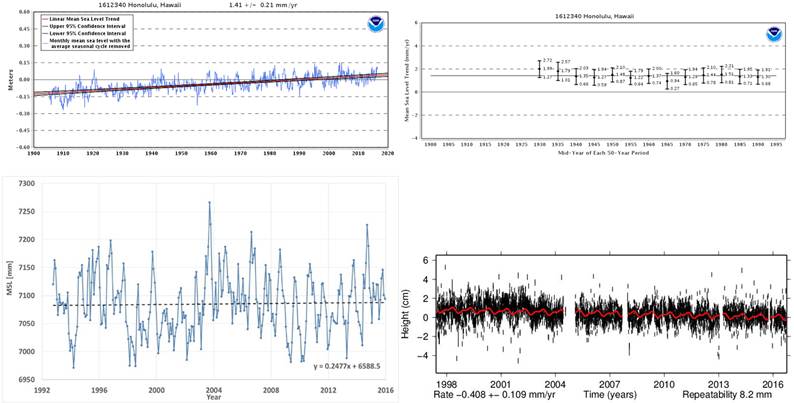
Figure 5. (a) Relative sea level rise at the Honolulu tide gauge over the full time window. (b) Variation of 50-Year mean Sea Level Trends in the Honolulu tide gauge. (c) Relative sea level rise at the Honolulu tide gauge over the short time window October 1992 to present of the satellite. (d) Vertical position of the nearby HNLC GPS dome. (MSL images (a) and (b) are from [11], data for the MSL picture (c) is from [12], GPS vertical velocity image (d) is from [13]). The short term absolute sea level rise trend is -0.16 mm/yr.
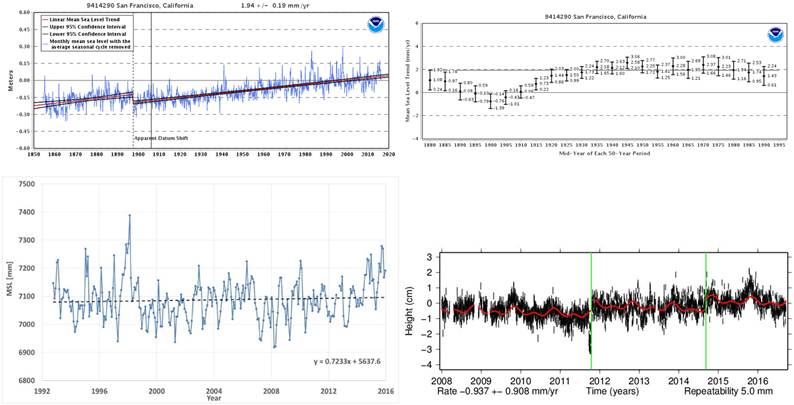
Figure 6. (a) Relative sea level rise at the San Francisco tide gauge over the full time window. (b) Variation of 50-Year mean Sea Level Trends in the San Francisco tide gauge. (c) Relative sea level rise at the San Francisco tide gauge over the short time window October 1992 to present of the satellite. (d) Vertical position of the nearby UCSF GPS dome. (MSL images (a) and (b) are from [11], data for the MSL picture (c) is from [12], GPS vertical velocity image (d) is from [13]). The short term absolute sea level rise trend is -0.22 mm/yr.
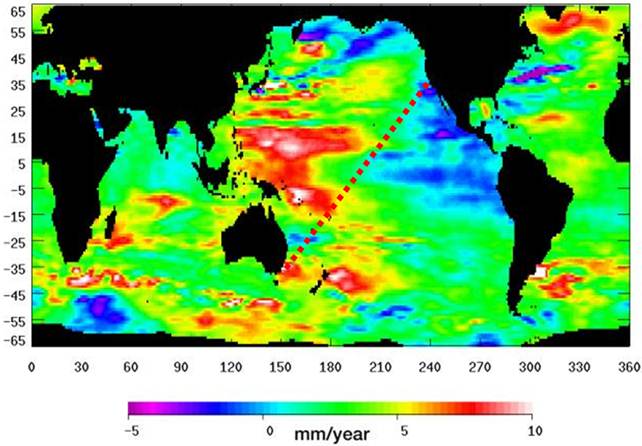
Figure 7. Trend of sea level change of 2008 (from [27]). Added to the trend map is a transverse of the Pacific Ocean Sydney to San Francisco.
The first graph presents the MSL corrected for a subsidence of the instrument of -0.46 mm/yr in the tide gauge location of Sydney Fort Denison (latitude -33.854667 and longitude 151.225778), plus the SSH of the 1 degree by 1 degree grid cell of latitude -34 and longitude 151 shifted for same starting point of the linear fitting. The satellite altimeter returns more than double the likely absolute sea level rise, +6.83 mm/yr vs. +3.03 mm/yr.
The second graph presents the MSL corrected for the subsidence of the instrument of -0.408 mm/yr in the tide gauge location of Honolulu (latitude 21.306667 and longitude -157.866667), plus the SSH of the 1 degree by 1 degree grid cell of latitude 21 and longitude 158 shifted for same starting point of the linear fitting. The satellite altimeter returns an absolute sea level rise much larger than the likely value, +1.00 mm/yr vs. -0.12 mm/yr.
For San Francisco, the Interactive Sea Level Time Series Wizard returns a message "point with no data" when entering the tide gauge location.
There are therefore sea level rising trends, as there are sea level falling trends, and the GMSL claims of Figure 1 build on magnifying the rising trends while defocusing from the falling trends to create what appears to be an engineered product.
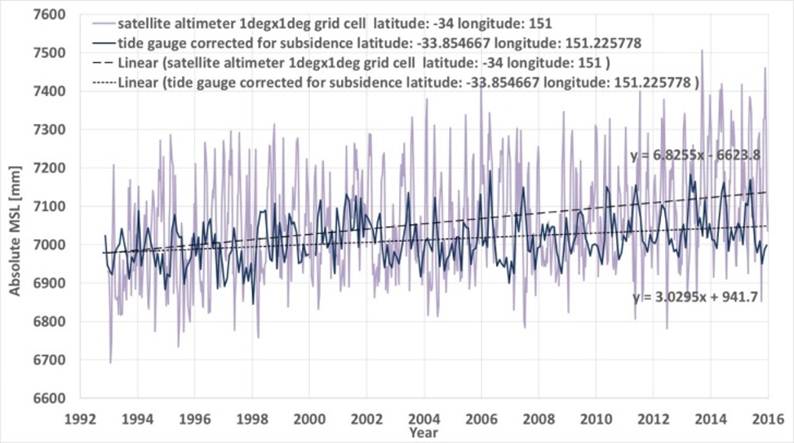
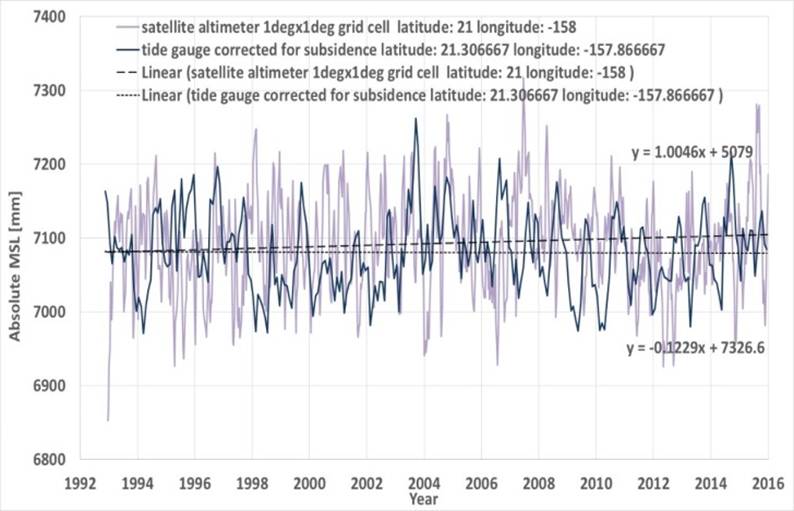
Figure 8. Top: MSL corrected for the subsidence of the tide gauge in the tide gauge location of latitude -33.854667 and longitude 151.225778 (Sydney Fort Denison) and SSH of the grid cell of latitude -34 and longitude 151 shifted for same starting point. Bottom: MSL corrected for the subsidence of the tide gauge in the tide gauge location of latitude 21.306667 and longitude -157.866667 (Honolulu) and SSH of the grid cell of latitude 21 and longitude 158 shifted for same starting point.
5. Conclusions
The satellite altimeter absolute global mean sea level (GMSL) is not a measurement, but merely a computation tuned to produce the desired output. The result is absolutely unreliable and untrustworthy. In [14-25, 29, 36] are some references to peer-reviewed works on the reliability (or lack of reliability) of the "absolute" global mean sea levels contrasting the tide gauge experimental evidence. The factual measurements of relative sea level worldwide reveal that the sea levels have been oscillating over the last three decades about a mild rising trend.
References
- sealevel.colorado.edu/
- sealevel.colorado.edu/content/map-sea-level-trends
- www.aviso.altimetry.fr/en/techniques/altimetry.html
- sealevel.colorado.edu/faq#n3113
- jonova.s3.amazonaws.com/graphs/sea-level/axel-morner/satellite-altimetry-se-level-topex-poseidon.gif
- jonova.s3.amazonaws.com/graphs/sea-level/axel-morner/sea-level-rise-satellite-altimetry-after-adjustment-500.gif
- https://wattsupwiththat.files.wordpress.com/2012/04/msl_serie_en_global_ib_rwt_nogia_adjust.png
- https://wattsupwiththat.files.wordpress.com/2012/04/envisat2bhide2bthe2bdecline.png
- sealevel.colorado.edu/faq#n3134
- www.sonel.org/stations/cgps/surv_update.html
- tidesandcurrents.noaa.gov/sltrends/sltrends.html
- www.psmsl.org
- sideshow.jpl.nasa.gov/post/series.html
- A. Parker, M. Saad Saleem and M. Lawson, Sea-Level Trend Analysis for Coastal Management, Ocean & Coastal Management, 2013, Vol. 73, pp. 63–81. Doi: 10.1016/j.ocecoaman.2012.12.005.
- A. Parker and T. Watson, Discussion of "towards a global regionally varying allowance for sea-level rise" by J. R. Hunter, J. A. Church, N. J. White, X. Zhang [Ocean Engineering 71 (1) 17-27 (10 October 2013)], Ocean Engineering, 2013, Vol. 72, pp. 470–472. DOI: 10.1016/j.oceaneng.2013.03.010.
- A. Parker, A REALISTIC LOWER BOUND TO THE 2050 SEA-LEVEL RISE, International Journal of Ocean and Climate Systems, 2013, Vol. 4, No. 3, pp. 197-211. Doi: 10.1260/1759-3131.4.3.197.
- A. Parker, MISMATCH BETWEEN ACCELERATION OF RECONSTRUCTED SEA LEVELS AND GRADIENT OF RECONSTRUCTED TEMPERATURES, Environmental Science: An Indian Journal, 2014, Vol. 9, Issue 1, pp. 31-36.
- A. Parker, Reply to Comment on Sea-Level Trend Analysis for Coastal Management by A. Parker, M. Saad Saleem, M. Lawson, Ocean & Coastal Management, 2014, Vol. 87, pp. 116–118. Doi: 10.1016/j.ocecoaman.2013.10.012.
- A. Parker, Reply to: "Comment on ‘Lower Bounds to Future Sea-Level Rise", International Journal of Ocean and Climate Systems, 2014, Vol. 5, No. 1, pp. 35-38. Doi: 10.1260/1759-3131.5.1.35.
- A. Parker, Persisting problems affecting the reliability of the satellite altimeter based Global Mean Sea Level computation, Pattern Recognition in Physics, 2014, Vol. 02, Issue 02, pp. 65.
- A. Parker and C. D. Ollier, Cherries, apples and sea levels: Discussion of Neil J. White et al., Australian sea levels -Trends, regional variability and influencing factors, Earth-Science Reviews 136 (2014) 155-174, Environmental Science: An Indian Journal, 2015, Vol. 10, issue 6, pp. 191-195.
- A. Parker, The actual measurements at the tide gauges do not support strongly accelerating twentieth-century sea-level rise reconstructions, Nonlinear Engineering, 2016, Vol. 5, Issue 1, pp. 45–71, DOI: 10.1515/nleng-2015-0006.
- A. Parker, Sea level rises: arguing the nanometre to defocus from the missed meter, Environmental Science: An Indian Journal, 2016, Vol. 12, Issue 1, pp. 22-29.
- A. Parker and C. D. Ollier, COASTAL PLANNING SHOULD BE BASED ON PROVEN SEA LEVEL DATA, Ocean and Coastal Management, 2016, Vol. 124, pp. 1–9, Doi: 10.1016/j.ocecoaman.2016.02.005.
- A. Parker, Discussion of Coastal Planning Should Be Based on Proven Sea-Level Data, American Journal of Geophysics, Geochemistry and Geosystems, 2016, Vol. 2, No. 1, pp. 1-14.
- https://www.21stcenturysciencetech.com/Articles_2011/Winter-2010/Morner.pdf
- photojournal.jpl.nasa.gov/jpeg/PIA11002.jpg
- sealevel.colorado.edu/content/interactive-sea-level-time-series-wizard
- Mörner, N.-A., Sea level changes past records and future expectations, Energy and Environment, 2013, Vol. 24 No. 3-4, pp. 509-536.
- Mörner, N.-A., Setting the Frames of Expected Future Sea Level Changes by Exploring Past Geological Sea Level Records, in Evidence-Based Climate Science, 2011, pp. 185-196.
- Mörner, N.-A., The Maldives: A Measure of Sea Level Changes and Sea Level Ethics, in Evidence-Based Climate Science, 2011, pp. 197-209.
- Mörner, N.-A., Sea level changes in Bangladesh new observational facts, Energy and Environment, 2010, Vol. 21, No. 3, pp. 235-249.
- Mörner, N.-A., Some problems in the reconstruction of mean sea level and its changes with time, Quaternary International, 2010, Vol. 221, No. 1-2, pp. 3-8.
- Mörner, N.-A., Comment on comment by Nerem et al. (2007) on "Estimating future sea level changes from past records" by Nils-Axel Mörner (2004), Global and Planetary Change, 2008, Vol. 62, No. 3-4, pp. 219-220.
- Kench, P. S., Nichol, S. L., McLean, R. F., Mörner, N.-A., Tooley, M., Comment on "new perspectives for the future of the Maldives" by Mörner, N. A., et al., Global and Planetary Change, 2005, Vol. 47, No. 1, pp. 67-71.
- Mörner, N.-A., The Maldives project: A future free from sea-level flooding, Contemporary South Asia, 2004, Vol. 13, No. 2, pp. 149-155.


