
Journal of Earth and Atmospheric Sciences, Vol. 1, No. 1, September 2016 Publish Date: Jul. 27, 2016 Pages: 30-35
Analysis of the Sea Level Rate of Rise in the Solomon Islands
A. Parker*
School of Engineering and Physical Science, James Cook University, Townsville QLD 4811, Australia
Abstract
The sea levels are rising in the Solomon Islands because of the increasing volume of the ocean waters and because of the sinking of the land. It is shown as a proper analysis of the actual measurements at the tide gauges suggests the most likely sea level rise is less than the +2.8 mm yr-1 computed over a still too short time window of 41 years not fully clearing the long term trend of the multi-decadal variability.
Keywords
Tide Gauges, Time Series, Solomon Islands
Received: June 22, 2016
Accepted: July 4, 2016
Published online: July 27, 2016
@ 2016 The Authors. Published by American Institute of Science. This Open Access article is under the CC BY license. http://creativecommons.org/licenses/by/4.0/
Contents
1. Introduction 2. Methodology 3. Prior Sea Level Rise Estimation for the Solomon Islands 4. Present-Day Sea Level Rise Estimation 4.1. MSL Data 4.2. MSL of Honiara II and Honiara B 4.3. SLR of Honiara B 4.4. MSL of the Composite Record Honiara B and Honiara II 4.5. MSL Pattern in Kwajalein 4.6. Similarities of the MSL Pattern in Kwajalein and Honiara 5. Discussion 6. Conclusions
1. Introduction
The tide gauges measure the local sea level relative to the tide gauge instrument subjected to a vertical movement comparable to the long term rate of rise of the sea levels. The tide gauges’ sea level time series are characterised by oscillations of different periodicities up to quasi-60 years’ [17,18]. This translates in the requirement of at least 60-70 years of quality data to infer reasonable relative sea level rise trends cleared of the effect of the natural oscillations [1].
It is unfortunately common of many climate change monitoring projects to only focus on the short term time window that magnifies the positive phase of a multi-decadal oscillation, neglecting different time windows, and sometimes to replace the truly measured data with computational products [2,3,4].
Aim of the present work is to assess the most likely relative rate of rise of the sea levels for the Solomon Island. There have been conflicting claims about the rate of rise of sea levels in the Solomon Islands. Based on selected measurements from only one tide gauge then expanded by "extension" and "reconstruction" [2,4], based on the measurements collected in only one tide gauge from 1994 to 2011 [3], and based on the full set of measurements available from two tide gauges in [1].
2. Methodology
The relative rate of rise of sea levels (SLR) is traditionally computed by linear fitting of the monthly average mean sea levels (MSL) collected over a given time window. In Microsoft Excel, this can be done by using the function SLOPE (known_y's, known_x's) where the known_y's is the cell range of numeric dependent data points, the MSL, and known_x's is the set of independent data points, the time. When at least 60-70 years of data are collected, this computation returns reasonably accurate values. When the time window is short, the time series has gaps, or there are other quality issues, then the computation of the relative rate of rise of sea level are not particularly meaningful, returning relative rates of rise that may be much larger or much smaller than the legitimate. If x1 and xN are the times when the first and last MSL were collected, we use here SLR computed at any given time xi, i=1, …, N by using time windows of variable length xi-x1 that include all the data available at the time xi, as well as short time windows of 10 years, to show the role of the natural oscillations. The most likely estimation is obtained with the time window xN-x1.
3. Prior Sea Level Rise Estimation for the Solomon Islands
The paper by Albert, Leon, Grinham, Church, Gibbes & Woodroffe [3] states that the "rates of sea-level rise in the Solomon Islands over the past two decades are amongst the highest globally, averaging 3 mm yr−1 since 1950 and 7–10 mm yr−1 since 1994". This "evidence" of 7-10 mm yr-1 sea level rise due to man-made global warming is what is then trumpeted in press releases such as [5,6]. The leading author declares "the Solomons was considered a sea-level hotspot because rises there are almost three times higher than the global average".
Albert, Leon, Grinham, Church, Gibbes & Woodroffe [3] cite the work by Becker, Meyssignac, Letetrel, Llovel, Cazenave and Delcroix [2] as the only analysis available for the sea level rise of the tropical Pacific in general and the Solomon Islands in particular. They do not acknowledge the work [1] providing conflicting results by using all the measured data rather a subset of measured data and their computational extension or reconstruction.
According to the Pacific Sea Level Monitoring (PSLM) consolidated data reports [3], by only considering the data collected from July 1994 to June 2011, the latest sea level rate of rise is about 7.1 mm yr-1.
The work [1] noticed about the Solomon Islands that "Honiara, Solomon Islands has two records. Honiara -II (Latitude: -9.433333 Longitude: 159.95) and Honiara B (Latitude: -9.428917 Longitude: 159.955361)." and "They produce a composite record suggesting a rate of rise of 2.80 mm/year over 37 years vs. the 8.3 mm/year obtained by considering only the second record."
4. Present-Day Sea Level Rise Estimation
The relative rate of rise of sea levels is difficult to be inferred from the information available for the Solomon Islands as there are no tide gauges long enough to infer a proper trend. Short records do not permit to clear the trend of the decadal and multi-decadal oscillations [1,7,11]. Higher (or lower) relative rates of rise may be computed playing with short records that wrongly account for the decadal and multi-decadal oscillations. However, the information available permits to dismiss the alarmist claim of 7-10 mm yr-1 rate of rise of sea levels.
4.1. MSL Data
The Australian National Tidal Centre Bureau of Meteorology managed or manage the two tide gauges of Honiara II and Honiara B included in the higher quality Revised Local Reference (RLR) data set of the PSMSL [12,13]. Both tide gauges are short, about 20 years long. The Honiara II time series ends 5 months after the Honiara B time series starts.
Honiara B is part of the Pacific Sea Level Monitoring (PSLM) project [14].
Honiara II and Honiara B were located very close each other. Honiara II (1974-1994) used a Leupold and Stevens Analog-to-Digital instrument. The Aquatrak acoustic gauge (SEAFRAME) was then installed on 4 January 1995. The data of Honiara B are updated every year in PSMSL [13] and every month in PSLM [15]. PSLM proposes monthly maximum, minimum and mean values, while PSMSL only proposes the mean values transformed in RLR format.
4.2. MSL of Honiara II and Honiara B
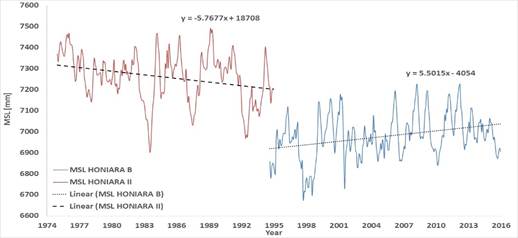
Fig. 1.a presents the monthly average mean sea level (MSL) pattern in Honiara II and Honiara B. Data have been downloaded from [12] and [13].
The computation of the rate of rise in Honiara B is still not significant, but clearly now drastically reduced to +5.50 mm yr-1 with a 21 years’ time window. Sea levels were increasing 1994 to 2008, but they are decreasing since 2012.
The maximum sea level in Honiara B was recorded at 1748 hours on May 8, 2008 [15].
Honiara II has a clearly opposite pattern to Honiara B, possibly a different phase of the same multi decadal oscillation. The rate of rise in Honiara II is -5.76 mm yr-1 with a 20 years’ time window.
4.3. SLR of Honiara B
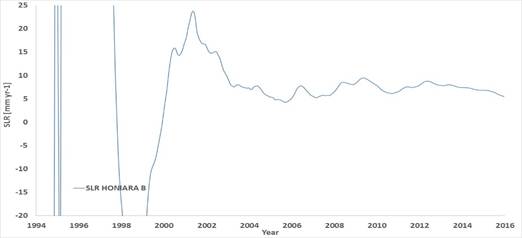
Fig. 1.b presents the relative rate of rise (SLR) computed in Honiara B by using all the data available at any time. Apart from the unrealistic values obtained when very few years of data were recorded, going off scale both in positive and negative, since July 2004 the SLR has oscillated between +4.41 and +9.50 mm yr-1. Since June 2012, when it was +8.76 mm yr-1, the SLR is then consistently reducing down to the latest +5.50 mm yr-1. Many more years will be needed to converge to a more realistic sea level rise.
4.4. MSL of the Composite Record Honiara B and Honiara II
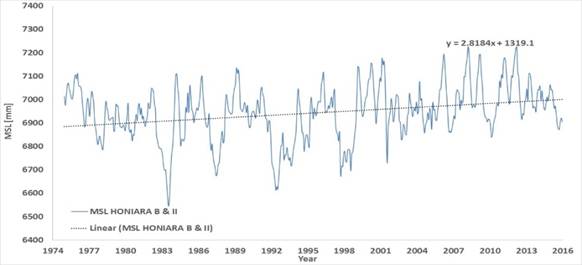
Despite the two tide gauges were close each other, no levelling has been apparently performed for Honiara B vs. Honiara II to permit the construction of a composite record that could have lowered and made more reliable the sea level rise estimation. However, both time series provide MSL values for 5 months during the year 1994, August to December. The differences in between the RLR data for Honiara B and Honiara II are 355, 357, 355, 356 and 359 mm. If we shift a time series vs. the other of 356 mm, we then obtain the composite record of Fig 1.c. The relative rate of rise is now +2.81 mm yr-1 over 41 years.
4.5. MSL Pattern in Kwajalein
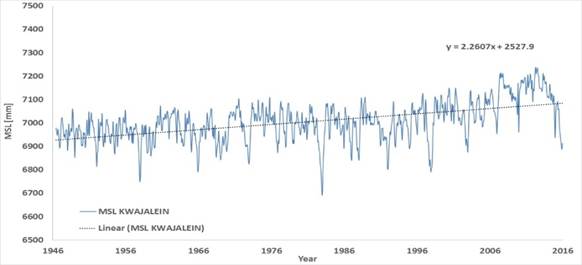
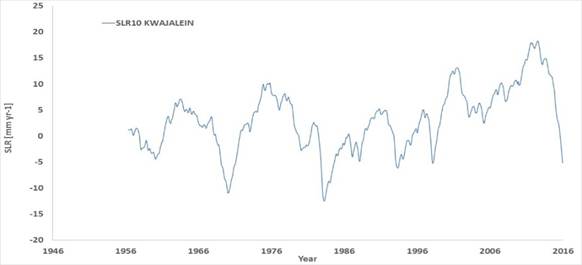
Fig. 1.d presents the MSL in Kwajalein, a longer, reliable record in the equatorial west Pacific, and Fig.1.e presents the sea level of rise computed by considering a 10 years’ time window (SLR10) in Kwajalein. Data are from [16]. The long term relative rate of rise is +2.26 mm yr-1 over the time window 1946 to 2015. The SLR10 varies from -12.4 to +18.3 mm yr-1, and it is presently -5.13 mm yr-1.
4.6. Similarities of the MSL Pattern in Kwajalein and Honiara
Computed over the same time window July 1994 to December 2015 of the Honiara B tide gauge of Fig. 1.a, the relative rate of rise is +6.87 mm yr-1. Computed over the same time window December 1974 to December 2015 of the composite Honiara II & B tide gauge of Fig. 1.c, the relative rate of rise is +4.08 mm yr-1. Therefore, if there is similarity in the periodicity and phasing of the sea level oscillations of Honiara II and Honiara B and Kwajalein, not only the +5.50 mm yr-1 with a 21 years’ time window of Honiara B in Fig.1.a, but also the +2.81 mm yr-1 over 41 years of the composite Honiara II & B tide gauge of Fig. 1.c are likely overestimation of the true rate of rise of sea levels in Honiara.
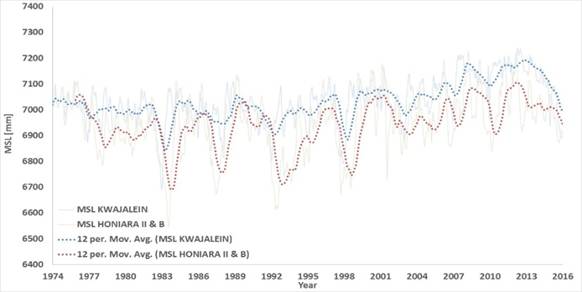
Fig. 1.f finally presents the 12 months moving averages of the MSL in Kwajalein and the composite tide gauge made of the MSL in Honiara B and Honiara II. The two time series show a certain degrees of similarity despite the 2,186 km between the two locations.
a
b
c
d
e
f
Fig. 1. a) MSL in Honiara B and in Honiara II. Data from [12] and [13]. b) rate of rise computed in Honiara B by using all the data available at any time. c) composite tide gauge made of the MSL in Honiara B and Honiara II. d) MSL in Kwajalein. Data from [16]. e) sea level rise computed in Kwajalein with a 10 years time window. f) 12 months moving averages of the MSL in Kwajalein and the composite tide gauge made of the MSL in Honiara B and Honiara II. The gaps are filled by linearly interpolating when possible neighbouring years, otherwise neighboring months. In c), Honiara II is shifted of 356 mm vs. Honiara B to make a composite record, as the RLR data of the two tide gauges overlap of 5 months during 1994 with a stable delta of about 356 mm.
5. Discussion
The PSLM consolidated data reports [15] only considers the data of Honiara B collected from July 1994 to June 2011. The list starts with the semester ending April 2004, and finishes with the semester ending June 2011, providing very high sea level rises computed with increasing time windows from less than 10 years to 17 years. None of these sea level rises is realistic.
The analysis of [4], that by arbitrary extension (for the future) and arbitrary reconstruction (for the past) provided a substitutional evidence for the sea level patterns of the Pacific Islands very far from the actual pattern, also builds claims of extremely high rates of rise by playing cherry picked short time windows.
It is not focusing on a cherry picked time window neglecting prior measurements and not updating the analyses for new measurements that a sea level pattern may be properly assessed.
Claims that the "rates of sea-level rise in the Solomon Islands over the past two decades are amongst the highest globally, averaging 3 mm yr−1 since 1950 and 7–10 mm yr−1 since 1994" are everything but scientific, as there are no measurements collected since 1950 and computations of sea level rates of rise with 10 years’ time windows are pointless.
When data are available, they must be considered. There is no reason why the data of Honiara II should be neglected. Similarly, there is no reason why not to look at the closest locations with true measurements as for example Kwajalein when local measurements are unavailable.
6. Conclusions
Claims of very high sea level rises playing with short records are everything but scientific. Unfortunately, this is the norm when they suggest much higher than legitimate rates of rise, with everything else being neglected. To understand the sea level pattern, it is necessary not to focus only on the positive phase of a multidecadal oscilation in one single tide gauge, namely Honiara B 1994 to 2008, but also consider the other tide gauges, namely Honiara II, plus the data collected in Honiara B also after 2008. By using all the information available, the most likely sea level rise is the 2.81 mm yr-1 computed over a still short time window of 41 years. The measurements collected in Kwajalein suggest this value may still be an overestimation.
References
- A. Parker (2013), MINIMUM 60 YEARS OF RECORDING ARE NEEDED TO COMPUTE THE SEA LEVEL RATE OF RISE IN THE WESTERN SOUTH PACIFIC, Nonlinear Engineering. 3(1):1-10.
- M. Becker, B. Meyssignac, C. Letetrel, W. Llovel, A. Cazenave, T. Delcroix (2012), Sea level variations at tropical Pacific islands since 1950, Global and Planetary Change, 80–81:85-98.
- S. Albert, J. X. Leon, A. R. Grinham, J. A. Church, B. R. Gibbes and C. D. Woodroffe (2016), Interactions between sea-level rise and wave exposure on reef island dynamics in the Solomon Islands, Environmental Research Letters 11:054011.
- http://www.bom.gov.au/oceanography/projects/spslcmp/reports_6mths.shtml
- http://www.abc.net.au/news/2016-05-07/rising-sea-levels-blamed-for-wiping-out-five-islands/7392986
- http://phys.org/news/2016-05-sea-level-islands-solomons.html
- A. Parker (2013), Oscillations of sea-level rise along the Atlantic coast of North America north of Cape Hatteras, Natural Hazards 65(1):991-997.
- A. Parker (2013), SEA-LEVEL TRENDS AT LOCATIONS OF THE UNITED STATES WITH MORE THAN 100 YEARS OF RECORDING, Natural Hazards 65(1):1011-1021.
- A. Parker, M. Saad Saleem & M. Lawson (2013), Sea-Level Trend Analysis for Coastal Management, Ocean & Coastal Management 73: 63–81.
- A. Parker (2013), MINIMUM 60 YEARS OF RECORDING ARE NEEDED TO COMPUTE THE SEA LEVEL RATE OF RISE IN THE WESTERN SOUTH PACIFIC, Nonlinear Engineering. 3(1):1-10.
- A. Parker & C.D. Ollier (2016), COASTAL PLANNING SHOULD BE BASED ON PROVEN SEA-LEVEL DATA, Ocean and Coastal Management. Doi: 10.1016/j.ocecoaman.2016.02.005.
- http://www.psmsl.org/data/obtaining/stations/1373.php
- http://www.psmsl.org/data/obtaining/stations/1861.php
- http://www.bom.gov.au/pacific/projects/pslm/
- http://www.bom.gov.au/ntc/IDO70061/IDO70061SLD.shtml
- http://www.psmsl.org/data/obtaining/rlr.monthly.data/513.rlrdata
- Chambers, D. P., Merrifield, M. A., & Nerem, R. S. (2012). Is there a 60-year oscillation in global mean sea level?. Geophysical Research Letters, 39(18).
- Scafetta, N. (2014). Multi-scale dynamical analysis (MSDA) of sea level records versus PDO, AMO, and NAO indexes. Climate dynamics, 43(1-2), 175-192.


