
Journal of Earth and Atmospheric Sciences, Vol. 1, No. 1, September 2016 Publish Date: Jul. 21, 2016 Pages: 1-9
The Sea Levels are Now Reducing in the "Hotspots of Acceleration" of Washington and New York
A. Parker*
School of Engineering and Physical Science, James Cook University, Townsville QLD, Australia
Abstract
The accelerated sea-level rise along the Atlantic Coast of North America is the result of cherry-picking the positive phase of a multi-decadal oscillation that ended in December 2009. Since December 2009, the sea levels have declined in both Washington DC and The Battery NY, at a rate of -3.3 mm/year in Washington DC and -10.7 mm/year in The Battery NY. Since December 2009 a positive phase of the oscillations has been replaced by a negative phase. This should be acknowledged in the papers discussing the sea levels for this area.
Keywords
Sea Level Rise, Sea Level Oscillations, Sea Level Acceleration, Cherry Picking
Received: June 7, 2016
Accepted: June 21, 2016
Published online: July 21, 2016
@ 2016 The Authors. Published by American Institute of Science. This Open Access article is under the CC BY license. http://creativecommons.org/licenses/by/4.0/
1. Introduction
It is claimed by some [1] that the seal levels are rising following the carbon dioxide emission, and process based models have been developed to compute the future sea levels for different carbon dioxide emission scenarios. It has been noticed by others [2] as the local measurements of the sea levels at the tide gauges collected over the 60-70 years rather suggest oscillatory patterns about strongly spatially variable constant longer term trends of rise or fall mostly driven by the subsidence of the instruments. It is therefore of paramount importance to assess the presence or absence of positive accelerations in the tide gauge signals. This paper focuses on the opposite claims published for the tide gauges located along the Atlantic Coast of North America updating previous analyses up to the past few months.
2. Literature Review
Karegar, Dixon & Engelhart [3] describe the Atlantic Coast of North America as increasingly affected by flooding associated with tropical and extratropical storms, exacerbated by accelerated sea-level rise and land subsidence. The accelerated sea-level rise along the Atlantic Coast of North America is postulated by the selective reading of the work by Sallenger, Doran & Howd [4] neglecting other works as [5-8] more correctly pointing out as the "hot spots" of sea level acceleration along the East Coast of the United States north of cape Hatteras are actually not hot, nor cold spots of acceleration. The sea levels are only oscillating about their longer term trend unchanged over the last century.
3. Methodology
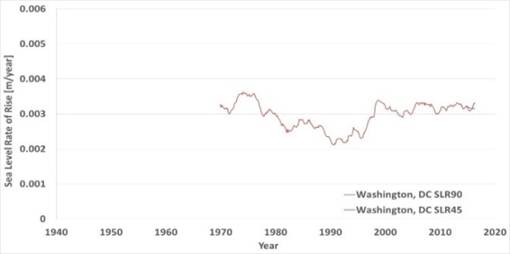
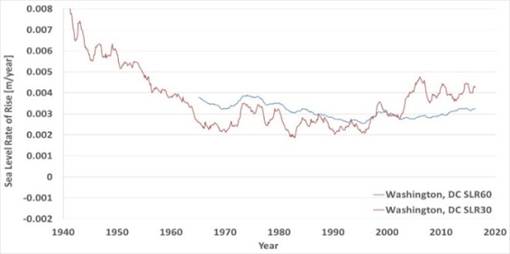
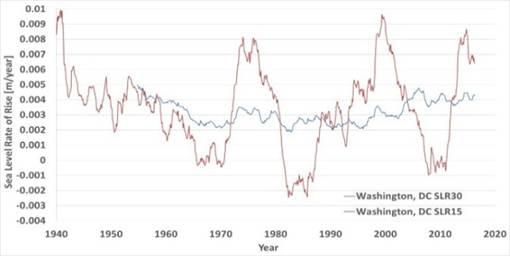
The logic of Sallenger, Doran & Howd [4] was based on the comparison of the rate of rise of sea levels computed by linear fitting over the first and second half of time windows of 60, 50 and 40 years, of length respectively 30, 25 and 20 years, claiming there is a sea level acceleration if the sea level relative rate of rise in the second half is larger than in the first half. This is not logical sense, as if you have sinusoidal oscillations of periodicity 60 years, positive and negative phases of 30 years, and you select the end of the time widows at the end of one positive phase, this way you will always have "positive acceleration" even if there is none. The only estimates following this logic that could have been "neutral" were eventually the comparison of the rate of rise over the first and the last half of a shorter windows of 30 years or a longer window of 90 years. Sallenger, Doran & Howd [4] did not explore the comparison of the rate of rise over the first and the last 15 or 45 years respectively of 30 and 90 years’ time windows. Periods and phasing of the natural multi-decadal oscillations were well known.
4. Findings
Since December 2009, the latest update of the tide gauge data considered by Sallenger, Doran & Howd [4], the monthly average mean sea levels have actually declined in the claimed hotspots of sea level acceleration along the Atlantic Coast of North America. The sea levels have continued to oscillate about their longer term trend unchanged over the last century. Only a positive phase of the oscillations has been replaced by a negative phase.
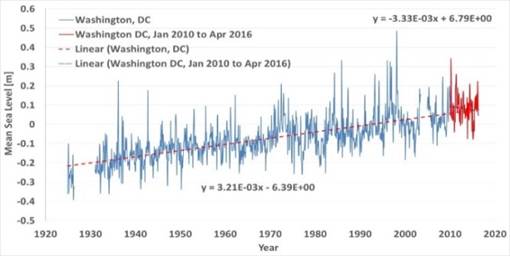
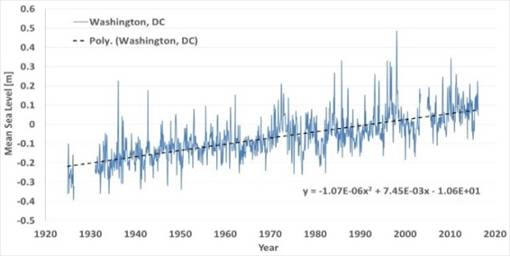
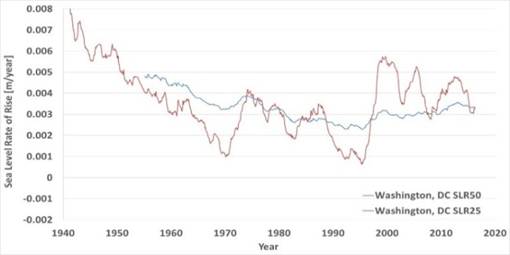
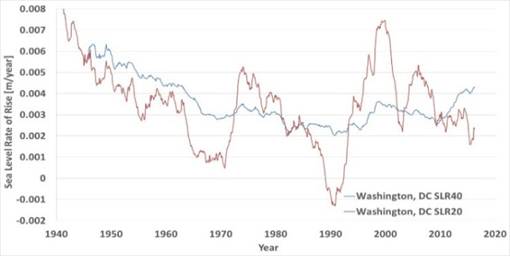
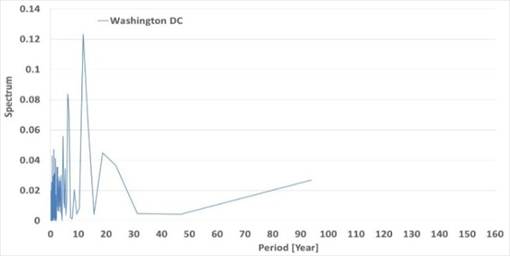
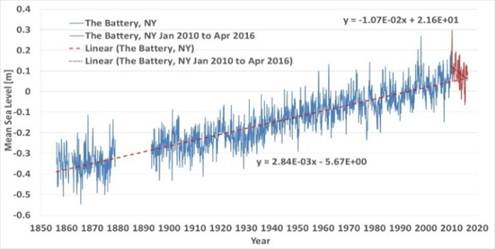
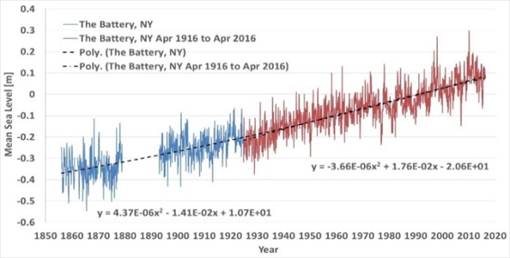
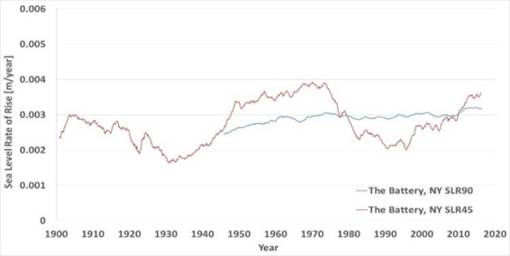
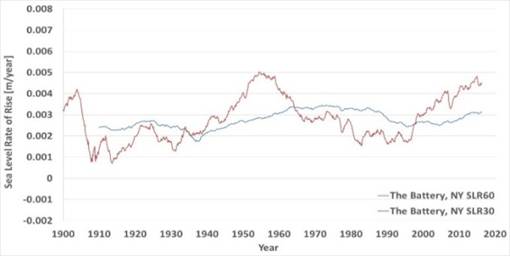
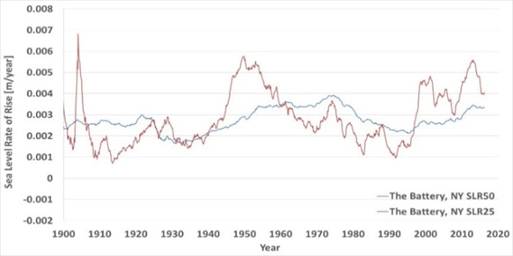
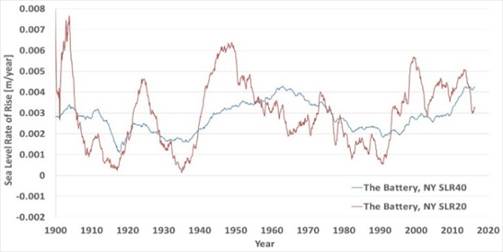
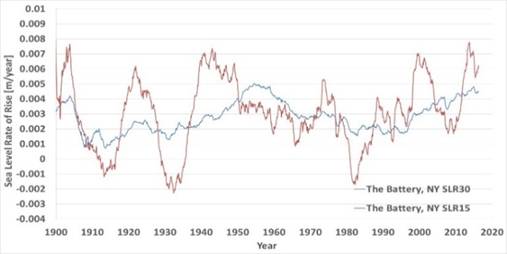
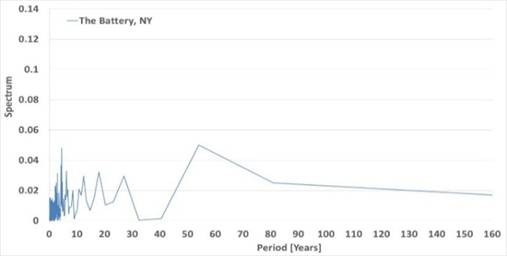
To see if the new data for the "hotspots", for example for Washington DC and The Battery NY, have produced significant sea level rises since December 2009, Fig. 1 below presents the MSL (monthly average mean sea levels), with linear and parabolic fittings over different time windows, the sea level rate of rise (SLR) computed by linear fitting with 15, 20, 30, 40, 45, 50, 60 and 90 years’ time windows, and the periodogram of the MSL for Washington DC in (a) and The Battery NY in (b). The data have been downloaded from [9] and [10] on May 28, 2016. The data are updated almost monthly, with last month of data April 2016.
It is evident as the differences first half vs. second half of time windows of 60, 50 and 40 years ending December 2009 or any other date are not an indication of "hotspots" of acceleration. There is no sign of acceleration or deceleration, but simply of oscillations. This was shown by the data measured up to December 2009 and it is plainly shown by the data up to April 2016.
In both cases there are only oscillations about longer term trends of roughly +3.21 mm/year in The Battery, NY and roughly +2.84 mm/year in Washington DC.
The average acceleration SLA computed by a parabolic fitting is -2.14 µm/year2 (negative) over the time window December 1924 to April 2016 in Washington DC, and it is +8.74 µm/year2 in The Battery, NY over the time window January 1856 to April 2016. This positive acceleration is due to the oldest data. Over the same time window of Washington DC, December 1924 to April 2016, in The Battery, NY the average acceleration is -7.32 µm/year2 (negative).
Finally, the periodogram of the sea level oscillations in The Battery, NY shows a clear periodicity of about 60 years. This periodicity is not shown in Washington simply because the record is too short.
What is the novelty of the last 6 years of data? Since December 2009, the sea levels have declined in both Washington DC and The Battery NY, at a rate of -3.3 mm/year in Washington DC and -10.7 mm/year in The Battery NY.
Immediately after December 2009, the last month of data considered by Sallenger, Doran & Howd [4] in their June 2012 paper, that they corrected online June 2013 with the publishing in the supplementary of the excel files with the actual numbers of their figures not accounting for the novel data collected, a positive phase of the oscillations has been replaced by a negative phase.
a
b
c
d
e
f
g
h
Fig. 1a. Monthly average mean sea levels (MSL) and sea level rates of rise (SLR) computed with different time windows, and periodogram of the MSL in Washington DC. Data downloaded from [9] on May 28, 2016. Last month of data April 2016. a) MSL time series with linear fitting of data 1924 to 2016 and 2010 to 2016. b) MSL time series with parabolic fitting of data 1924 to 2016. c) SLR time series with 90 and 45 years’ time windows. d) SLR time series with 60 and 30 years’ time windows. e) SLR time series with 50 and 25 years’ time windows. f) SLR time series with 40 and 20 years’ time windows. g) is the SLR time series with 30 and 15 years’ time windows. h) periodogram of the MSL time series.
a
b
c
d
e
f
g
h
Fig. 1b. Monthly average mean sea levels (MSL), sea level rates of rise (SLR) computed with different time windows, and periodogram of the MSL in The Battery NY. Data downloaded from [10] on May 28, 2016. Last month of data April 2016. a) MSL time series with linear fitting of data 1856 to 2016 and 2010 to 2016. b) MSL time series with parabolic fitting of data 1956 to 2016 and 1916 to 2016. c) SLR time series with 90 and 45 years’ time windows. d) SLR time series with 60 and 30 years’ time windows. e) SLR time series with 50 and 25 years’ time windows. f) SLR time series with 40 and 20 years’ time windows. g) SLR time series with 30 and 15 years’ time windows. h) periodogram of the MSL time series.
5. Discussion
The findings of Sallenger, Doran & Howd [4] were immediately challenged by a comment to the journal Nature Climate Change that I wrote. The comment was rejected with the excuse that Sallenger, Doran & Howd confirmed to the editorial board their science was solid. I eventually published somewhere else, as for example [5-7] my analyses showing the sea level natural oscillations that for the specific of the East Coast of the United States were suggesting short time windows apparent rates of rise of sea levels larger than their actual values.
The claims of Sallenger, Doran & Howd [4] were used by the press supporting climate alarmism to warn that "the Statue of Liberty is at risk of being overrun by rising sea levels caused by global warming", as it is recently recalled in [11] following the publication of [12]. The Los Angeles Times [13] stated that "sea levels in a 620-mile ‘hot spot’ along the Atlantic coast are rising three to four times faster than the global average" and "The sharp rise in sea levels from North Carolina to Massachusetts could mean serious flooding and storm damage for major cities such as New York, Philadelphia and Boston, as well as threats to wetlands habitats." Only last week, The Weather Channel [14] followed up on the claim of Sallenger, Doran & Howd [4] citing a recent report from the United Nations [15], to assert that "the Statue of Liberty is facing a disturbing future because of rising seas and a warming planet."
The report [15] is not certainly a scientific report peer reviewed. The publication was made possible with financial support of the Ministry for Ecology, Sustainable Development and Energy, France. It is actually signed by the United Nations Environment Programme, the United Nations Educational, Scientific and Cultural Organization, and finally the Union of Concerned Scientists (UCS). The UCS is the organization promoting open censorships of global warming dissent as the Senate Bill 1161, or the California Climate Science Truth and Accountability Act of 2016 that would have authorized prosecutors to sue fossil fuel companies, think tanks and others that have "deceived or misled the public on the risks of climate change." [16,17].
Therefore, the science of sea level rises driven by the carbon dioxide emission may certainly have consensus in the general press, but it is not settled in the scientific peer review.
As noticed in [11], "the media either ignore or marginalize anything that disputes the global warming narrative", and the huge economic and political implications of global warming prevent a proper scientific and democratic debate.
As imbedded in the blog [11] written under the pseudonym "Giordano Bruno" as a clear parody of the present Global Warming Inquisition (the Roman Inquisition supporting geocentric views of the Universe eventually burned Giordano Bruno guilty of insisting that the universe is in fact infinite and could have no celestial body at its "center"), those who try to object the consensus science get bullied. While in normal science and democracy what is debated is a theory that should be proved true or false following a free debate, in the science of global warming unfortunately those scientists not supporting the consensus theories are persecuted for expressing their views.
6. Conclusions
Karegar, Dixon & Engelhart [3] should have considered not only [4], but also conflicting papers such as [5-8] published in the peer review, or make their own assessment of the sea-level acceleration based on the complete information available, and not just a cherry picked subset, and by using an objective method and not a method subjectively developed specific for one case. It is not by cherry picking the method and the time window, nor the references of a paper, that the science progresses.
The "hotspots of acceleration" along the North Atlantic coast of North America are only apparent, as a positive phase of the same oscillations has been now replaced by a negative phase producing apparent "coldspots of acceleration". Unfortunately, the science of climate change has very little of science and too much of politics and economy. Discussing the natural oscillations in the climate parameters should not be regarded as "deceive or mislead the public on the risks of climate change".
In absence of any sign of sea level acceleration measured at the tide gauges, the best ocean and coastal management is local and linked to the proven rates of rise from the tide gauge measurements [18], rather than using the one-cause-fit-all of global warming dealing with areas where the sea levels are rising same of areas where the sea levels are falling.
References
- http://ipcc.ch/report/ar5/syr/
- Parker, A., Saad Saleem, M., & Lawson, M. (2013). Sea-level trend analysis for coastal management. Ocean and Coastal Management, 73, 63-81. doi:10.1016/j.ocecoaman.2012.12.005
- Karegar, M. A., Dixon, T. H., & Engelhart, S. E. (2016). Subsidence along the atlantic coast of north america: Insights from GPS and late holocene relative sea level data. Geophysical Research Letters, 43(7), 3126-3133. doi:10.1002/2016GL068015
- Sallenger Jr., A. H., Doran, K. S., & Howd, P. A. (2012). Hotspot of accelerated sea-level rise on the atlantic coast of north america. Nature Climate Change, 2(12), 884-888. doi:10.1038/nclimate1597
- Parker, A. (2013). Oscillations of sea level rise along the atlantic coast of north america north of cape hatteras. Natural Hazards, 65(1), 991-997. doi:10.1007/s11069-012-0354-7
- Parker, A. (2013). Sea level trends at locations of the united states with more than 100 years of recording. Natural Hazards, 65(1), 1011-1021. doi:10.1007/s11069-012-0400-5
- Parker, A. (2013), The non-linear, naturally oscillating pattern of sea-levels in the Chesapeake Bay, East Coast, USA. Nonlinear Engineering. 2(1-2), 1-10.
- Parker, A. (2013), Apparent hot and cold spots of acceleration along the Atlantic and Pacific coasts of the United States. Nonlinear Engineering. 3(1), 51-56.
- https://tidesandcurrents.noaa.gov/sltrends/sltrends_station.shtml?stnid=8594900
- https://tidesandcurrents.noaa.gov/sltrends/sltrends_station.shtml?stnid=8518750
- http://www.investors.com/politics/commentary/the-global-warming-con-fabricating-phony-fear-over-sea-levels/
- https://wattsupwiththat.com/2016/05/29/the-sea-levels-are-now-reducing-in-the-hotspots-of-acceleration-of-washington-and-new-york/
- http://articles.latimes.com/2012/jun/25/nation/la-na-nn-sea-level-atlantic-20120625
- https://weather.com/science/environment/news/statue-liberty-risk-climate-change-sea-level-rise
- http://whc.unesco.org/en/activities/883/
- http://www.washingtontimes.com/news/2016/jun/2/calif-bill-prosecutes-climate-change-skeptics/
- http://www.ucsusa.org/press/2016/california-bill-seeks-accountability-fossil-fuel-companies-climate-science-deception
- Parker, A., & Ollier, C. D. (2016). Coastal planning should be based on proven sea level data. Ocean and Coastal Management, 124, 1-9. doi:10.1016/j.ocecoaman.2016.02.005


