International Journal of Chemical and Biomolecular Science, Vol. 2, No. 4, August 2016 Publish Date: Sep. 8, 2016 Pages: 73-79
Comparative Total Phenolics and Antioxidant Activities of Xanthosoma colocasia, Solanum torvum and Allium ascalonicum L.
Akwasi Acheampong*, Mercy Badu, Andrew Yirenkyi Agyemang
Department of Chemistry, College of Science, Kwame Nkrumah University of Science and Technology, Kumasi, Ghana
Abstract
Fruits and vegetables are known to have free radical scavenging abilities due to the antioxidants in them and this gives them the ability to prevent diseases and sicknesses. This study was carried out to investigate the total phenolic content and free radical scavenging abilities of some selected vegetables and to determine their minimum inhibitory concentration (IC50). These vegetables include Solanum torvum, Xanthosoma colocasia, and Allium ascalonicum Linn. The total antioxidant capacity (TAC), total phenol content (TPC), ferric reducing antioxidant power (FRAP) and the DPPH scavenging assays of the methanolic extracts of samples were determined. The results for the total antioxidant capacity of the measured concentration (0.1-0.3 mg/mL) were 0.146 ± 0.00004, 0.102 ± 0.00006, and 0.085±0.00003 mg AAE/g respectively for Solanum torvum, Allium ascalonicum Linn and Xanthosoma colocasia. Total phenolic content values were 0.180±0.00015, 0.124±0.00008, and 0.102±0.00003 mg TAE/g for Solanum torvum, Allium ascalonicum Linn and Xanthosoma colocasia respectively. There was a perfect correlation between total antioxidant capacity (TAC) and total phenolic content (TPC) of the extracts with r2 =1 and p<0.001. Solanum torvum exhibited the highest ferric reducing antioxidant power with values ranging from 0.013919 to 0.1464 mg GAE/DW for the concentration range of 0.1–3 mg/mL. Solanum torvum, Allium ascalonicum and Xanthosoma colocasia had IC50 values of 1.0676, 1.5978, and 1.6753 mg GAE/DW respectively. Percentage scavenging ability were 78.60, 63.41 and 58.95 respectively for Solanum torvum, Allium ascalonicum L., and Xanthosoma colocasia at 3 mg/mL concentration. The results indicate that all the vegetables exhibit antioxidant capacities and Solanum torvum is a significant source of antioxidants.
Keywords
Minimum Inhibitory Concentration (IC50), Antioxidant Activity, Scavenging Ability, Total Phenolic Content
Received:March 16, 2016
Accepted: April 1, 2016
Published online: September 8, 2016
@ 2016 The Authors. Published by American Institute of Science. This Open Access article is under the CC BY license. http://creativecommons.org/licenses/by/4.0/
Contents
1. Introduction 2. Materials and Methods 2.1. Sample Collection and Identification 2.2. Chemical Reagents 2.3. Extraction of Plant Materials 2.4. Phytochemical Screening 2.5. Free Radical Scavenging Assay Using DPPH 2.6. Total Antioxidant Capacity (TAC) Assay 2.7. Total Phenolic Content (TPC) Assay 2.8. Ferric Reducing Antioxidant Power (FRAP) 2.9. Statistical Analysis 3. Results and Discussions 3.1. Correlation between Total Phenol Content (TPC) and Total Antioxidant Capacity (TAC) 3.2. Ferric Reducing Assay Potential and DPPH Scavenging Assays 3.3. FT-IR Spectral Features of Crude Extracts 4. Conclusion Acknowledgement
1. Introduction
The presence of antioxidant species in fruits and vegetables is associated with certain beneficial health effects such as protecting biomolecules from oxidative damage. Due to their antioxidant activity potential, research has been carried out to investigate the phytoconstituents of vegetables such as onions and pepper, and fruits such as mango and pawpaw worldwide [1-3]. Other parts of plants such as the leaves and stem barks have also been found to contain antioxidants [4-6].
Reactive oxygen species (ROS) and reactive nitrogen species (RNS) are free radicals and other non-radical reactive derivatives. The reactivity of radicals is generally stronger than non-radical species, though radicals are less stable [7]. Free radicals are formed from molecules by the homolytic cleavage of a chemical bond and via redox reactions. Once formed, these highly reactive radicals can start a chain reaction [8, 9]. Under situations of oxidative stress, reactive oxygen species such as hydroxyl and peroxyl radicals and superoxides are generated. For maintaining a healthy biological system, a balance between antioxidation and oxidation is critical [10].
Oxidative damage can lead to a breakdown or even hardening of lipids, which are major components of all cell walls. This is due to lipid peroxidation which involves the formation and propagation of lipid radicals, the uptake of oxygen, a rearrangement of the double bonds in unsaturated lipids, and the eventual destruction of the cell [10]. In addition, other biological molecules including RNA, DNA and protein enzymes are also susceptible to oxidative damage [10, 11].
Antioxidants are substances which slow down or stop the oxidation reaction. Antioxidants cause protective effect by neutralizing free radicals, which are toxic by-products of natural cell metabolism. The human body naturally produces antioxidants but the process is not 100 percent effective in case of overwhelming production of free radicals and that effectiveness also declines with age [12]. Natural antioxidants can be phenolic compounds (flavonoids, phenolic acids and tannins), nitrogen-containing compounds (alkaloids, chlorophyll derivatives, amino acids, peptides, and amines), tocopherols, carotenoids, or ascorbic acid and its derivatives [13]. The antioxidant activity of these phenolics is mainly due to their redox properties, which allow them to act as reducing agents or hydrogen-atom donors. Thus, natural antioxidants function as free-radical scavengers and chain breakers, complexers of pro-oxidant metal ions and quenchers of singlet-oxygen formation [14].
This research seeks to determine the total polyphenol content and establish the free-radical scavenging activity of Taro leaves or kontomire (Xanthosoma colocasia), "kwawu nsusuaa" (solanum torvum) and shallot (allium ascalonicum).
2. Materials and Methods
2.1. Sample Collection and Identification
Vegetables were collected from Asafo, Kejetia and Ayeduase markets (Kumasi, Ghana) using purposive and stratified sampling. The vegetables were identified by a botanist at the College of Agriculture at the Kwame Nkrumah University of Science And Technology, Ghana. The samples were oven dried at 60°C and stored in a desiccator until analyses.
2.2. Chemical Reagents
DPPH* (2,2-diphenyl-2-picrylhydrazyl hydrate), Folin-Ciocalteu Phenol Reagent, Ascorbic acid, Anhydrous Sodium Carbonate, Trichloroacetic Acid, Sodium Acetate, 98% Acetic Acid; Sodium Carbonate, Sodium Acetate, Tannic acid. Analytical grade reagents were used.
2.3. Extraction of Plant Materials
25 g of the dried powdered leaves of the Kontomire, pebbles of ‘‘kwawu nsusua’’, and shallot samples were extracted with 250 ml Methanol (99%) for 5 hours using Soxhlet apparatus. The extracts were filtered and concentrated in a rotary evaporator apparatus (BUCHI Rotavapor, R-144) at approximately 60°C. The concentrated extracts were kept in a desiccator until analyses.
2.4. Phytochemical Screening
The phytochemical screening was performed by the methods described by Trease and Evans [15]. The methanolic extracts of the samples were assayed and phytoconstituents such as tannins, flavonoids, saponins, glycosides, alkaloids and anthraquinone glycosides were determined.
2.5. Free Radical Scavenging Assay Using DPPH
Radical scavenging activity of the extracts from the vegetable samples against stable DPPH• radical was determined spectrophotometrically. Radical scavenging activity of extracts were measured by slightly modified method of Xiaonan and others [16]. The extract (0.1, 0.3, 1, 3 mg/mL in methanol) was compared with n-propyl gallate (0.01, 0.03, 0.1, 0.3 mg/mL in methanol) as a reference free radical scavenger. The supernatant of the extract (0.1 ml) was added to 1 ml methanolic solution of DPPH• (20 mg/l) in a test tube. The reaction mixture was kept at room temperature for 30 minutes. The absorbance of the residual DPPH• solution was determined at 515 nm in a UV-Visible spectrophotometer (LKB Biochrom, Cambridge, Cambridge, England, Model 4050). Methanol (0.1 ml) was added to 1 ml DPPH• solution and used as control. Methanol was used as the blank. The measurements were done in triplicate. The results were expressed as% Radical Scavenging Activity against concentration and the IC50 determined.
2.6. Total Antioxidant Capacity (TAC) Assay
The total antioxidant capacity was evaluated using the method described by Prieto and others [17] with slight modifications. Ascorbic acid was used as the standard antioxidant drug. 3 mL of the test reagent (0.6 M Sulphuric acid, 28 mM Sodium phosphate and 4 Mm Ammonium molybdate) was added to 3 mL each of ascorbic acid solutions (0.1, 0.3, 1 and 3 mg/mL), the extract (0.1, 0.3, 1 and 3 mg/mL) and the blank and the resulting mixtures were incubated at 95°C for 90 minutes. Water was used as the blank. After the mixtures had cooled to room temperature, the absorbance of each solution was measured in triplicates using the UV-Visible spectrophotometer (LKB Biochrom, Cambridge, Cambridge, England, Model 4050) at 695 nm against a blank. The total antioxidant capacity was expressed as Ascorbic Acid Equivalents (AAE) using the GraphPad Prism for Windows version 5.0 (GraphPad Software, San Diego, CA, USA).
2.7. Total Phenolic Content (TPC) Assay
The content of total phenolic compounds in the extracts from the samples (0.1, 0.3, 1 and 3 mg/mL) was quantitatively determined by colorimetric assay using Folin-Ciocalteu’s reagent [18] with slight modifications. Tannic acid (0.01, 0.03, 0.1 and 0.3 mg/mL) was used as the reference drug. The extract (1 mL) was added to 1 mL of F-C reagent (diluted five folds in distilled water) in a test tube. The content of the test tube was then mixed and allowed to stand for five minutes at 25°C in an incubator (Gallenkamp model IH, UK). 1 mL of 2% sodium bicarbonate solution was added to the mixture. The reaction mixture was then incubated at 25°C for 2 hours. The reaction mixture after the incubation period was centrifuged at 3000 rpm for 10 minutes to get a clear supernatant. The absorbance of the supernatant was then measured at 760 nm using the UV-Visible spectrophotometer (LKB Biochrom, Cambridge, Cambridge, England, Model 4050). Distilled water (1 mL) was added to 1 mL F-C reagent (diluted five folds in distilled water) processed in the same way as done for the test extracts and reference drug. The measurements were done in triplicate. The content of total phenolic compounds was expressed as Tannic Acid Equivalents (TAE) using the GraphPad Prism for Windows version 5.0 (GraphPad Software, San Diego, CA, USA).
2.8. Ferric Reducing Antioxidant Power (FRAP)
The reducing potential of the extracts (0.1, 0.3, 1 and 3 mg/mL in methanol) was determined using the method described by Oyaizu (1986) [19], with slight modifications using n-propyl gallate as a reference antioxidant drug. The extract (1 mL) was mixed with 2.5 ml of 0.2 M sodium phosphate buffer (pH 6.6) and 2.5 mL of 1% potassium ferricyanide solution in a test tube. The mixture was incubated at 50°C for 20 minutes. Following this, 1.5 ml of 10% trichloroacetic acid solution was added to the incubated mixture and centrifuged at 3000 rpm for 10 minutes using the centrifuge (Sanyo MSE, MISTRAL 3000E, UK). 2.5 ml of the supernatant was mixed with 2.5 ml distilled water and 0.5 ml of 0.1% ferric chloride solution in a test tube. The absorbance was then measured at 700 nm using the UV-Visible spectrophotometer (LKB Biochrom, Cambridge, Cambridge, England, Model 4050). The test drug was taken through the same procedure. Distilled water was used in place of the test drug and used as the blank. The absorbance measurements were done in triplicates. Data was presented as concentration-absorbance curves and the IC50 (effective concentration that gives 50% of maximal response) was computed using the GraphPad Prism for Windows version 5.0 (GraphPad Software, San Diego, CA, USA.
2.9. Statistical Analysis
All the experimental data were analyzed statistically by one-way analysis of variance (ANOVA) and "Bonferroni's Multiple Comparison Test" at 95% confidence interval using the software, GraphPad Prism for Windows version 5.0 (GraphPad Software, San Diego, CA, USA) and Excel (Microsoft Corporation, USA). Correlation coefficient (r2) was used to determine the relationship between two variables, TAE and AAE. All the points on graphical representation of experimental values were expressed as mean ± S.D. Statistical significance was determined by t test; P < 0.05 was considered significant.
3. Results and Discussions
Table 1. Phytoconstituents of Solanum torvum, Xanthosoma colocassia, and A. ascalonicum Linn.
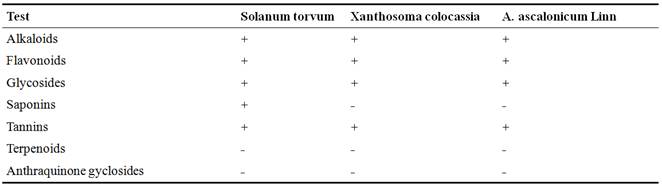
+ means present
- means absent
Alkaloids, glycosides and flavonoids were present in X. colocasia whereas the rest of the analyzed constituents were absent. S. torvum contains all except terpenoids and anthraquinones. A. ascalonicum Linn contains alkaloids, flavonoids and general glycosides. Phenolic compounds like tannins and flavonoids act highly as antioxidants (protection and regeneration of other dietary antioxidants) and free radical scavengers [20]. Flavonoids and tannins are likely to be responsible for the free radical scavenging activities [21].
Table 2. Total phenolic contents (TPC) Assay (TAE mg/25g).
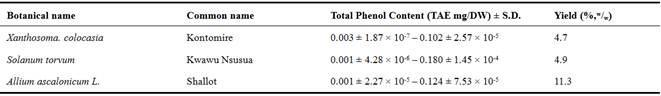
DW – Dry weight
The total phenol content increases in the order Xanthosoma colocasia ˂ Allium ascalonicum L ˂Solanum torvum. The TPC value for Allium ascalonicum L. ranged between 0.001 mg TAE/DW and 0.124 mg TAE/DW. The values for Xanthosoma colocasia ranged between 0.003 mg TAE/DW and 0.102 mg TAE/DW whereas that of Solanum torvum ranged between 0.001 and 0.180 mg TAE/DW at experimental concentrations. A slightly different trend in the TPC of shallot has been reported [16] whereas others [22, 23] have reported values that fall within the range obtained in this work. This can be attributed to differences in climatic conditions and cultivars. It has been also established that polyphenols present in foods inhibit oxidative stress due to their free radical scavenging activities in vitro and in vivo [24].
Total phenols have been found out to be highly responsible for the free radical scavenging activities in many plant samples [25].
Table 3. Mean Amounts of Total Phenol Content (TPC) and Total antioxidant capacity (TAC) (mg AAE/g) in Solanum torvum, Xanthosoma colocasia and Allium ascalonicum.
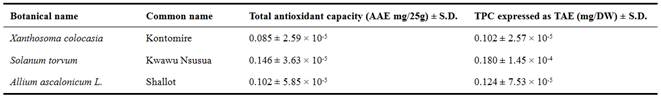
All the extracts showed different range of extent of antioxidant activity and this can be related to the high amounts of flavonoids and phenolic compounds in extracts. The results showed highest antioxidant capacity of 0.146 ± 3.63 × 10⁻⁵ mg AAE/DW for solanum torvum and 0.085 ± 2.59 × 10⁻⁵ mg AAE/DW for Xanthosoma colocasia which showed the lowest TAC. The results of 0.102 mg AAE/DW for Allium ascalonicum L. showed some agreement with previous studies [23].
3.1. Correlation between Total Phenol Content (TPC) and Total Antioxidant Capacity (TAC)
From the results obtained, it was observed that there is a high and positive correlation between TPC and TAC with all the extracts (r2 = 1, P < 0.0001). Figure 1 shows the correlation graphs. The positive correlation could be attributed to the fact that the phyto-constituents of the vegetables could be responsible for both the total phenol content and total antioxidant capacity. This may also be due to system solubility and a common underpinning mechanism, i.e., electron/hydrogen donation [26].
This sequences or relationship between TPC and TAC agrees with the sequence mentioned by Morrison and Twumasi [27]. The amount of total phenol content in a sample relates to the antioxidant activity of the extract [28]. Hence methanolic extract with high phenol content (TPC) is likely to have high antioxidant capacity (TAC).
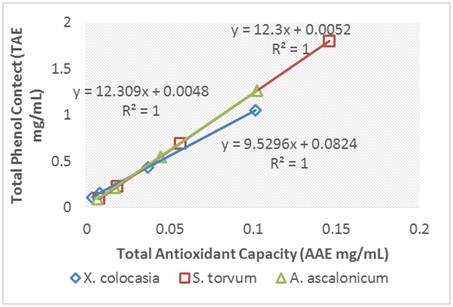
Figure 1. Correlation between TPC and TAC for the three vegetables.
3.2. Ferric Reducing Assay Potential and DPPH Scavenging Assays
3.2.1. Ferric Reducing Assay Potential (FRAP)
The presence of antioxidants in the samples will result in the reduction of Fe3+ to Fe2+ by donation of an electron [26]. The amount of Fe2+ can be monitored by measuring the formation of the Perl’s blue colour at 700 nm. The ability of the extracts to reduce Fe3+ was assessed and the results obtained are presented in Table 4.
Table 4. Ferric Reducing Antioxidant Power (FRAP assay) for Solanum torvum, Xanthosoma colocasia and Allium ascalonicum.
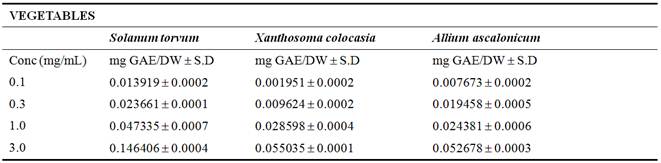
DW – Dry weight
The higher the absorbance, the bigger the GAE and the greater the ferric reducing antioxidant power of the sample. The absorbance increased in the order of Xanthosoma colocasia < Allium ascalonicum L < Solanum torvum at lower concentrations of 0.1-0.3 mg/mL. From literature and previous studies, an increase in absorbance relatively indicates an increase in reducing ability [25]. All extracts showed antioxidant activity. In general, the ferric reducing antioxidant power of the extracts increased with increasing concentration of the extracts. At all concentrations, solanum torvum exhibited the highest ferric reducing antioxidant power. This indicates that the solanum torvum has a potentially high antioxidant activity. At concentrations of 0.1 and 0.3 mg/mL, A. ascalonicum exhibited a higher ferric reducing antioxidant power than X. colocasia, but at higher concentrations of 1.0 and 3.0 mg/mL X. colocasia had slightly higher ferric reducing antioxidant power than A. ascalonicum. Different studies have indicated that the antioxidant effect is related to the development of reductones [29]. Reductones are reported to be terminators of free radical chain reactions [30]; thus, the antioxidant activity of an aqueous extract may be related to its reductive activity. All the methanolic extracts demonstrated electron-donating properties and thus may act as free radical chain terminators, transforming reactive free radical species into more stable non-radical products [26].
3.2.2. DPPH Scavenging Assay
Plant materials, fruits and vegetables have been reported to have some amount of free radical scavenging activity [4, 25]. DPPH* free radicals can be quenched by antioxidants (i.e. by providing hydrogen atoms or by electron donation, conceivably via a free-radical attack on the DPPH* molecule) and change them to a colourless / bleached product (i.e. 2,2-diphenyl-1-hydrazine, or a substituted analogous hydrazine), leading to a decrease in absorbance at the 517 nm band [31]. DPPH* scavenging activity is an indication that an extract has a potential antioxidant, hence the extract could contain compounds that are capable of donating hydrogen to a free radical in order to remove odd electron, thereby being responsible for the radical’s activity. The results obtained for the DPPH* scavenging assay is presented in Table 5.
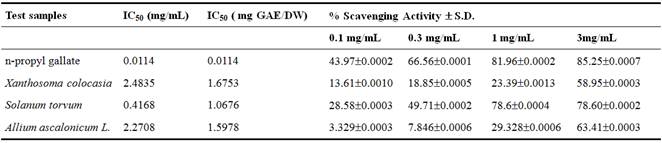
Table 5. Radical Scavenging Activity (RSA) of n-propyl gallate, Solanum torvum, Xanthosoma colocasia and Allium ascalonicum.
The total antioxidant capacity was evaluated using the method proposed by Prieto and others [17], with slight modifications. The modifications were done for temperature and the concentrations. The temperature stated in the protocol could not be achieved so a more relevant temperature suiting the environment of Ghana was used.
All extracts had free radical scavenging activities lower than that of the reference drug, n-propyl gallate. All the extracts showed different range of antioxidant activity and this can be related to the high amounts of flavonoids and phenolic compounds in the extracts [32]. In general radical scavenging activity increased with increasing concentration of both reference drug and the extracts. As the reference drug scavenged 85.25% of DPPH* radical at a concentration of 3 mg/mL, Solanum torvum, A. ascalonicum and X. colocasia respectively scavenged 78.60%, 63.41% and 58.59% at that same concentration. Solanun torvum exhibited the highest free radical scavenging activity at all concentrations with X. colocasia exhibiting the least at all concentrations of extract.
The IC50 values of the extracts ranged from 1.0676-1.6753 mg GAE/DW. Smaller IC50 value of an extract indicates high reducing power or antioxidant activity [27]. Solanum torvum had the least IC50 among the extracts, thereby buttressing its high radical scavenging activity. X. colocasia had the highest IC50 value indicating its relatively weak radical scavenging activity. The radical scavenging activities of all the methanolic extracts may be due to presence of the flavonoids in the extracts. The results reveal that the methanol extracts are capable of scavenging free radicals and may be able to prevent initiation of free radical-mediated chain reactions by preventing the abstraction of hydrogens from susceptible polyunsaturated fatty acids [26].
Solanum torvum is a highly regarded vegetable for the prevention of diseases by Ghanaians. The results obtained here shows that the perception may have a sound scientific basis.
3.3. FT-IR Spectral Features of Crude Extracts
The spectral features of the crude samples showed various peaks between the regions of 800 cm-1and 1800 cm-1 (fingerprint region) and 2400 – 3600 cm-1(functional group region).
The bands in the fingerprint region show the biochemical compositions, especially with moieties of carbohydrates, lipids, protein secondary structures and polyphenols in plants [16]. This method of determination of TPC and TAC using FT-IR interspec 200-X is now widely used in food analysis and non-destructive applications [16].
FT-IR was used in this study to confirm the antioxidant activity and concentration of the total phenols in the plant samples since it is devoid of degradation of antioxidant components caused by extraction and provides information about the concentration and biological activity of foods and biological variability in antioxidant activity [16, 32]. The results obtained are reported in Table 6.
Table 6. Peaks and Band range of 3 vegetables.
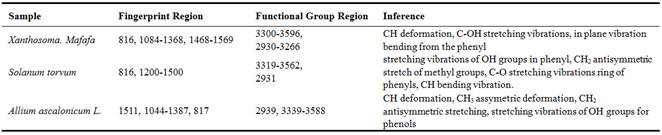
Xanthosoma colocasia showed similar peaks at the regions of 816, 1104, and from 1084-1368 cm-1indicating CH deformation, C-OH stretching vibrations for C-OH groups and C-O stretching vibrations for ring stretch of phenyl following in that order. The band between 1468 and 1569 cm-1 indicates a ring base with a weak peak at 1525 cm-1signalling an in plane vibration bending from the phenyl.
Solanum torvum spectrum gave bands from 3319-3562 cm-1 for the stretching vibrations of OH groups in phenyl, 2931 cm-1 for CH2 antisymmetric stretch of methyl groups mainly of lipids [32] all in the functional group region. In the fingerprint region, sharp peaks at 816 cm-1, 1500 cm-1 and a broad band from 1200 to 1376 cm-1 were shown. This inference the presence of phenyls due to the C-O stretching vibrations ring of phenyls (1200-1376 cm-1) and the in plane CH bending vibration from phenyl rings [33].
Allium ascalonicum Linn showed clear peaks at 1511, 1113, 1044 and 1200-1387 cm-1 which is in agreement with previous results [34, 35] from the fingerprint region. Peak at 817 cm-1and1400indicates CH deformation [33] and CH3 assymetric deformation respectively. Broad and weak peaks appeared between 1511 and 1600 cm-1which is a ring base spectra. From the functional group region, there were peaks at 2939 cm-1 for CH2 antisymmetric stretching of methyl groups mainly of lipids [32] and between 3339-3588 indicating stretching vibrations of OH groups for phenols.
Based on the obtained and cited data, it can be concluded that vegetables are a rich source of diverse antioxidants, therefore the efforts in the promotion of vegetable variety for health benefits has to be done.
4. Conclusion
All three vegetables showed presence of Phenolics with Solanum torvum having the highest total phenol content, followed by Allium ascalonicum, with Xanthosoma colocasia having the least. All three vegetables exhibited free radical scavenging activities of varying degrees with solanum torvum showing the strongest activity, followed by Allium ascalonicum L, with Xanthosoma colocasia showing the least scavenging activity. There was perfect linear correlation between the Total Antioxidant Capacity and Total Phenolic Content. Solanum torvum is a significant source of antioxidants.
Acknowledgement
The authors would like to thank the technicians at the department of horticulture (KNUST) for the authentication of the vegetables and fruits, and Mr Michael Baah (a Ph.D. student at the Department of Chemistry, KNUST) for his contributions that helped in some aspect of the work.
References
- Oviasogie, P.O., Okoro, D., and Ndiokwere, C. L. (2009). Determination of total phenolic amount of some edible fruits and vegetables. African Journal of Biotechnology, 8(12): 2819-2820.
- Bakar, M., Mohamed, M., Rahmat, A., & Fry, J. (2009). Phytochemicals and antioxidant activity of different parts of bambangan (Mangifera pajang) and tarap (Artocarpus odoratissimus). Food Chemistry, 113: 479–483.
- Idris, S., Ndukwe, G., & Gimba, C. (2009). Preliminary phytochemical screening and antimicrobial activity of seed extracts of Persea Americana (avocado pear). Bayero Journal of Pure and Applied Sciences, 2(1):173-176.
- Mohammad, A. (2015). Chemistry and Antioxidant activity of plants containing some phenolic compounds. Chemistry international 1(1):35-62.
- Basgedik, B., Ugur, A., Sarac, N. (2015). Antimicrobial, antioxidant and antimutagenic properties of Iris albicans. Industrial Crops and Products, 69;480-484.
- Del Monte, D., De Martino, L., Marandino, A., Fratianni, F., Nazzaro, F., De Feo, V. (2015). Phenolic content, antimicrobial and antioxidant activities of Hypericum perfoliatum L. Industrial Crops and Products, 74; 342-347.
- Pham-Huy, L. A., He H. and Pham-Huy, C. (2008). Free radicals,antioxidants in disease and health. International Journal of Biomedical Science, 4:89-96.
- Bahorun, T., Soobrattee, M. A., Luximon-Ramma V., and Aruoma O. I. (2006). Free radicals and antioxidants in cardiovascular health and disease. Internet Journal of Medicinal Update, 1: 1-17.
- Valko, M., Rhodes, C. J., Moncola, J., Izakovic, M. and Mazur, M. (2006). Free radicals, metals and antioxidants in oxidative stress-induced cancer. Chemico-Biological Interactions, 160:1–40.
- Davies K.J.A. (1991). Oxidative Damage & Repair: Chemical, Biological and Medical Aspects, Pergamon, Oxford.
- Halliwell B. (1992). Anti-oxidants and Human Diseases: a general introduction. Nutri Rev 1997, 55;S44-S55.
- Goldfarb, A. H. (1993). Antioxidants: role of supplementation prevent exercise-induced oxidative stress. Medicine and Science in Sports and Exercise, 25:232-236.
- Velioglu, Y. S., Mazza, G., Gao, L., & Oomah, B. D. (1998). Antioxidant activity and total phenolics in selected fruits, vegetables, and grain products. Journal of Agricultural and Food Chemistry, 46:4113–4117.
- Pratt, D. E. (1992). Natural antioxidants from plant material. In MT. Huang, C-T. Ho, & C. Y. Lee (Eds.), Phenolic compounds in food and their effects on health II. Antioxidants & cancer prevention, ACS Symposium Series 507 (pp. 54–71). Washington: American Chemical Society.
- Trease, G. E. and Evans, W.C. (1989). Pharmacognosy. 13 edn. Bailliere Tindall, London. Pp 176-180.
- Xiaonan, Lu., Carolyn, F. R., Joseph R. P., Ashton, D. and Barbara A. R. (2011) Determination of total phenolic content and antioxidant activity of Garlic (Allium sativum) and Elephant Garlic (allium ampeloprasum) by attenuated total reflectance-Fourier Transformed Infrared Spectroscopy. Journal of Agricultural. Food Chemistry, 59:5215-5221.
- Prieto, P., Pineda, M. and Aguilar, M. (1999) Spectrophotometric quantitation of antioxidant capacity through the formation of phosphomolybdenum complex: specific application to the determination of vitamin E. Analytical Biochemistry, 269:337-341.
- Slinkard, K. and Singleton, V. L. (1977) Total phenol analyses; automation and comparison with manual methods. American Journal of Enolology and Viticulture, 28:49-55.
- Oyaizu, M. (1986) Studies on products of browning: Antioxidants activities of browning reaction prepared from glucosamine. Japan Journal of Nutrition, 44:307-315.
- Polterait, O. (1997). Antioxidants and free-radical scavengers of Natural Origin. Current Organic Chemistry, 1:415-440.
- Ayoola, G. A., Coker, H. A. B.,Adesegun, S. A., Adepoju-Bello, A. A., Obaweya K., Ezennia E. C., and Atangbayila T. O. (2008). Phytochemical Screening and Antioxidant Activities of Some Selected Medicinal Plants Used for Malaria Therapy in South-western Nigeria. Tropical Journal of Pharmaceutical Research, 7:1019-1024.
- Nuutila, A. M., Puupponen-Pimia, R., Aarni, M., Oksman-Caldentey, K. (2003). Comparison of antioxidant activities of onion and garlic extracts by inhibition of lipid peroxidation and radical scavenging activity. Food Chemistry, 81:485-493.
- Prakash, D., Singh, B. N., and Upadhyay, G. (2007). Antioxidant and free radical scavenging activities of phenols from onion (Allium cepa). Food Chemistry, 102:1389–1393.
- Manach, C., Scalbert, A., Morand, C., Remesy, C., and Jimenez, C. (2004). Polyphenols: Food sources and bioavailability. American Journal of Clinical Nutrition 79:727-747.
- Oyalinka, A. A. and Anthony I. O. (2010). Preliminary phytochemical screening and in vitro antioxidant activities of the aqueous extract of Helichrysum longifolium DC. BMC Complement Altern Med, 10:21.
- Damien Dorman, H. J., Kosar M., Kahlos K., Holm Y., Hiltunen, R. (2003). Antioxidant properties and composition of aqueous extracts from Mentha species, hybrids, varieties, and cultivars. Journal of Agricultural and Food Chemistry. DOI: 10.1021/jf034108k.
- Morrison J. F and Twumasi S. K. (2010). Comparative studies on the in vitro antioxidant properties of methanolic and hydro-ethanolic leafy extracts from eight edible leafy vegetables of Ghana African Journal of Biotechnology Vol. 9(26). 28 June, 2010 ISSN 1684–5315 2010 Academic Journals.
- Odukoya, O. A., Inya-Agba, S. I., Segun, F. I., Sofidiya, M. O. and Ilori O. O. (2007). Antioxidant activity of selected Nigerian green leafy vegetables. American Journal of Food Technology, 2:169-175.
- Yen, G-C., Duh, P. D. (1993). Antioxidative properties of methanolic extracts from peanut hulls. Journal of Americal Oil Chemistry Society, 70:383-386.
- Gordon, M. H. (1990). The mechanism of antioxidant action in Vitro. In Food Antioxidants; Hudson, B. J. F., Ed.; Elsevier Applied Science: London, U.K. pp 1-18.
- Yamaguchi, T., Takamura, H., Matoba, T., & Terao, J. (1998). HPLC method for evaluation of the free radical-scavenging activity of foods by using 1,1-diphenyl-2-picrylhydrazyl. Bioscience, Biotechnology, and Biochemistry, 62:1201–1204.
- Lu, X. and Rasco B. A. (2012). Determination of antioxidant content and antioxidant activity in foods using infrared spectroscopy and chemometrics. Critical review in Food science Nutrition, accepted. (IF 2012: 4.510)
- Schulz, H., & Baranska, M. (2007). Identification and quantification of valuable plant substances by IR and Raman spectroscopy. Vibrational Spectroscopy, 43(1):13–25.
- Mordechai, S., Mordechai, J., Ramesh, J., Levi, C., Huleihel, M., Erukhimovitch, V., et al. (2001). Application of FTIR microspectroscopy for the follow-up of childhood leukaemia chemotherapy. Proceedings of SPIE Subsurface and Surface Sensing Technologies and Applications III, 4491:243–250.
- Andrus, P. G. (2006). Cancer monitoring by FTIR spectroscopy. Technology in Cancer Research and Treatment, 5(2):157–167.


