International Journal of Chemical and Biomolecular Science, Vol. 1, No. 4, December 2015 Publish Date: Sep. 18, 2015 Pages: 238-243
Mapping Risk of Metals (Pb and Cd) Using a Geostatistical Approach in Mangrove Sediments of Persian Gulf – Iran
Mohammad Taheri1, *, Alireza Riyahi Bakhtiari1, Babak Naimi2,
Mehdi Gholamalifard1, Arash Ketabforoush Badri3
1Department of Environmental Sciences, Faculty of Natural Resource, Tarbiat Modares University, Noor, Mazandaran, Iran
2Imperial College London, Silwood Park Campus, Berks, United Kingdom
3Department of Economics, College of Management and Accounting, Qazvin Branch, Islamic Azad University, Qazvin, Iran
Abstract
Due to existing of oil pollution in Persian Gulf, Iranian mangrove forests have been exposed to a serious risk. This study used geostatistical approach and aimed to assess the risk by exploring the concentration and spatial distribution of two of the most toxic pollutants, lead and cadmium, in surface sediments of mangrove forests. 42 sediment samples were collected and results showed that the average concentrations of recruited metals are 1.89±0.07 µg/g dw and 0.17±0.01 µg/g dw, respectively. Spatial distribution pattern of both metals were followed from spatial variable, because the variance of sampling stations in terms of toxic metals concentrations was increased with increasing the distance. Depicted maps showed that the highest concentration of both metals has often focused in Khamir Port and eastern side of Middle part. Generated information by pollution risk maps can provide a useful tool for managers about pollution status of mangrove ecosystems.
Keywords
Metals, Geostatistics, Risk Maps, Sediment, Mangrove
Received: August 27, 2015
Accepted: September 8, 2015
Published online: September 17, 2015
@ 2015 The Authors. Published by American Institute of Science. This Open Access article is under the CC BY-NC license. http://creativecommons.org/licenses/by-nc/4.0/
1. Introduction
Environmental pollution is one of the major complications of imbalance in nature and among the various pollutants, metal accumulation in natural ecosystems has been considered as one of the biggest concerns for the environment and human health (Wang et al. 2010). Sediments are an important sink for metals and other pollutants (Sin et al. 2001). Among metals, Cadmium (Cd) and Lead (Pb) are heavy metals that can be toxic when introduced into a human body by ingestion or inhalation in sufficient quantities (Even and Ghaffari 2011). Also, these two metals are elements that are required neither by plants nor by animals. Because of their high toxicity and large quantity, present in the environment, Pb and Cd are emerging as a serious global human health concern (Zamani-Ahmadmahmoodi et al. 2013). The presence of Cd in the environment is strongly influenced by human activities and enters in the environment through using fertilizers, burning of fossil fuels, mining and other industrial activities (Liu et al. 2006).
Environmental geochemistry of sediments has been widely used in the recent years as a tool to estimate the pollution level and evaluate of their origin in an area (Paul 2001). Sediments are sensitive indicators for monitoring pollutants as they act as a sink and a carrier for contaminations in aquatic environment (Bai et al. 2011). For this reason, sediments are not only the sink of heavy metals, but also potential secondary sources of heavy metals in aquatic system (Li et al. 2013). Spatial continuous data play a significant role in planning, risk assessment and decision making in environmental management (Li and Heap, 2008). Environmental surveys are almost always based on samples, but in general the measurements represent a continuum in space from which the sample has been drawn (Oliver and Webster, 2014). Therefore, the spatial distribution of the pollutants across the entire area cannot be methodically determined (Ouyang et al. 2002). On the other hand, the current literature highlights the importance of determining the spatial distribution of pollutants when assessing the status of environmental contamination (Raulinaitis et al. 2012).
The development of Geographic Information Systems (GIS) has greatly improved spatial representation and spatial analysis of all kinds of information and data. So, as a consequence of the development of GIS technology, environmental risk mapping of pollutants has developed rapidly as well. Risk maps help risk analysts and scientists to explore the spatial nature of pollutant concentrations, exposure and effects, but they also constitute a very powerful tool to communicate the outcome of complex environmental risk assessment (Lahr and Kooistra, 2010). One method to investigate the spatial distribution and producing of regional pollution and risk maps is the interpolation approach using geostatistical techniques (Isaaks and Srivastava 1989). Geostatistics provides the possibility of exploring whether the data are spatially structured and can be spatially described. So mapping based on Geographic Information Systems (GIS) and geostatistical techniques are advantageous approaches for the assessment of such spatial patterns and for this reason it is recommended the use of GIS techniques in the study of the distribution of contaminants in the environment (Zhou et al. 2007).
Persian Gulf due to providing a significant portion of the global oil and gas energy is known as an offshore area potentially exposed to oil pollution (de Mora 2004). One of the most important and most sensitive ecosystems that are found in Persian Gulf is mangrove forests. In this study, we will try to determine the concentrations of two toxic metals, lead and cadmium in surface sediments of mangrove forests. Also in another part of work, the principles of geostatistics and kriging technique will be used for mapping the levels of distribution of metals to investigate the relationship between the concentrations of toxic metals in surface sediments of mangrove forests with spatial variations. Kriging is a generic name for a family of generalized least-squares regression algorithms that provide the best linear unbiased estimations (BLUE) and also some non-linear types of prediction (Negreiros et al. 2010).
2. Methods and Materials
2.1. The Sample Collection
The study area was mangrove forests (26˚51'N, 55˚40'E) on the Persian Gulf in southern Iran. Mangrove ecosystems have many environmental and socio – economical functions. These ecosystems are very rich in terms of biodiversity and are regarded as an important habitat for many species (Nagelkerken et al. 2008). In order to determine the concentration of the two metals, Pb and Cd, surface sediment samples were collected from 42 stations (Fig. 1). Area of forests was about 9026 hectares and sampling was performed randomly in three parts of these forests which were: Qeshm Island, Middle part and Khamir Port. Samples were taken from the surface layer of sediments with four replicates in April 2011 and finally geographic location and characteristics of each station was recorded. All the samples were kept in ice boxes and then transported to laboratory.
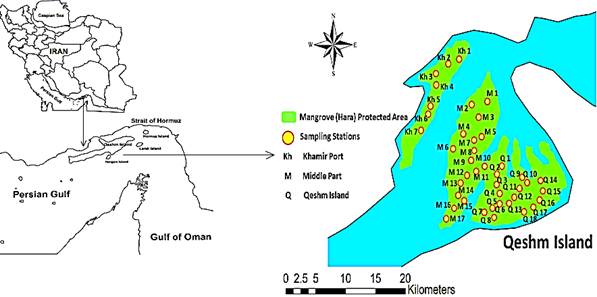
Fig. 1. The distribution of sediment sampling stations in mangrove forests in Persian Gulf-Iran.
2.2. Laboratory Analysis
For determination of metals concentrations, the samples were placed in an oven at 105°C for 16 hours (Tanner et al. 2000). Then the samples were crushed in a stone mortar and came into powder. 1 g of each dried sample were digested on Hot Block Digester by a combination of nitric acid and perchloric acid into volumetric ratio of 4:1 initially for 1 h at 40°C and then for 3 h at 140°C. The digested samples were diluted to 25 ml by using Double Distilled Water (DDW) and diluted samples were filtered using filter paper Whatman No. 1 (Yap et al. 2002). Pb and Cd concentrations in sediment samples were determined using atomic absorption spectrometry with graphite furnace (GFAAS) Shimadzu Model AA-670G based on µg/g of sample dry weight (dw). All samples were analyzed in four replicate. Previously in order to avoid the possible contamination, all glassware and equipment used was acid washed. To evaluate the precision of the analytical method relative standard deviation (RSD) was calculated. The RSD was 0.4 % (n = 4) and 1.6 % (n = 4) for Cd and Pb, respectively. Limits of detection were 0.4 µg/L for Cd and 10 µg/L for Pb.
2.3. Statistical Analysis
After determining the concentration, to understand the normal distribution of metals, Kolmogorov – Smirnov test was performed on the data (Solgi et al. 2012). SQGS and NOAA world standards were used to determine the extent of contamination to the investigated metals in surface sediments of mangrove forests (Long et al. 1996; Niu et al. 2009). To determine significant differences of metals concentrations in sediments with these standards, One-Sample t-Test was used. All of the data analysis in this stage was carried out by SPSS Version 19. Because of the most important condition for the use of geostatistical predictors is normality of data distribution, before everything the data were tested for normality using a Kolmogorov–Smirnov test (Solgi et al. 2012). The level of significance was set at p<0.05. Finally values are presented in means ± standard errors (SEM).
2.4. Geotatistical Analysis
Geostatistics uses the variogram techniques for measuring the spatial variability of regional variable and provides the input parameters for spatial interpretation by kriging (Webster and Oliver 2001). Kriging is a weighted linear combination predictor and the most important of its feature is minimizing the variance of the estimation (Cinnirella et al. 2005). Geostatistics is based on the theory of regionalized variables and able to offer an extensive collection of statistical predictors (Metternicht and Zinck 1996). The modeling of spatial distribution of variables using a geostatistical approach uses three basic steps: 1) Spatial dependence modeling, 2) Model fitting and 3) Kriging and simulation. So firstly in order to completely define the possible nature of the spatial variations in data sets, the variogram as a visual technique was used to detect and evaluate the Pb and Cd spatial variations (Li and Heap 2008):
![]()
Where Z is the variable, Z(x,) is the value of Z at location of xi, h is the distance lag and N (h) is the number of pairs of sample points separated by distance lag h. The variogram has three important characteristics (Zhang and Selinus 1997): Sill (C0+C), that shows the amount of variability in the absence of spatial continuity, Range (A), which implies the distance there is no evidence of spatial continuity for investigated variable, Nugget effect (C0), the nugget effect is the variogram at the original point. In the second stage of modeling, the obtained variogram in the first stage will be analyzed and interpreted. The main objective of this phase is a visual and formulaic fitting of a theoretical and continuous model to variogram which offers the pattern of spatial variability of the study area (Li 2008).
Finally in the third phase, information generated by the variogram was used to calculate the weighting factors of samples and the interpolation of study area is done by kriging technique (Lark and Ferguson 2004). In this study, variography and kriging of Pb and Cd concentrations in surface sediments were performed using gstat package version 2.5.1 in R developing environment (R development core team, 2011) and spatial distribution maps of metals were produced using ArcGIS 9.3 software. To evaluate the accuracy of built models, the calibration-validation method was used. So that after generation of variogram models, two-thirds of the total data which were randomly selected were used for modeling the spatial distribution pattern and the one-thirds remaining data were used for validation. Finally observed and predicted values were compared and to evaluate the performance of the employed geostatistical method, we used the statistical model, Root Mean Squared Error (RMSE) (Wakernagel 2003).
3. Results and Discussion
In general, average concentrations of metals, Pb and Cd in surface sediments of mangrove forests were obtained respectively 1/89±0/07 µg/g dw and 0/17±0/01 µg/g dw. The results of Kolmogorov-Smirnov test showed that the Cd does not follow a normal distribution and logarithmic transformation was used to solve the problem. Concentrations of both metals in the study area showed significant difference compared to SQGS and NOAA standards (p<0/05) and the concentrations of both metals in the area were lower than the standards.
As already mentioned in the materials and methods, in order to investigate whether the spatial variable can explain the spatial distribution pattern of pollutants in the study area or not, the variogram was used. The best experimental variogram of each pollutant was drawn after fitting and reviews of various models and the results showed that the spatial distribution pattern of both metals follows from the spatial variable, because the variance of the sampling stations in terms of toxic metals concentrations was increased with increasing the distance. Results from the model fitting showed that the toxic metals Cd and Pb respectively are following the circular and exponential models (Fig. 2).
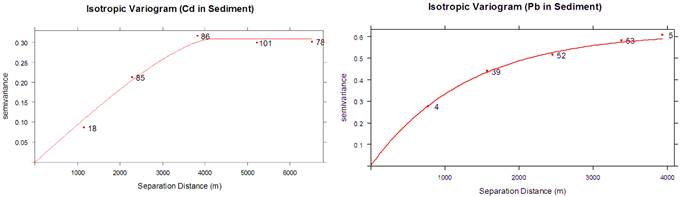
Fig. 2. The Experimental variograms of cadmium and lead in surface sediments of mangrove forests with fitted models.
Corresponding model-fitted parameters are listed in (Table 1). In the present study, the Ordinary Kriging estimator was employed to provide the quantitative prediction maps of the spatial distribution of metals (Fig. 3). Depicted risk maps showed that the spatial distribution of Pb and Cd is similar and the highest concentration of both metals has often focused in Khamir Port and eastern side of the Middle part. Performance evaluation of used estimator by Root Mean Square Error (RMSE) presented acceptable results. Ordinary kriging estimation error in estimation of the spatial distribution patterns of Pb and Cd were respectively 0/675 and 0/001 µg/g dw.
Table 1. Parameters of the best-fitted variogram models for isotropic variograms of Pb and Cd concentrations in sediments of mangrove forests.
| Metal | Model | Nugget (C0) | Sill (C0+C) | Range A (m) | R2 | RSS |
| Lead (Pb) | Exponential | 0/003 | 0/615 | 1299/749 | 0/95 | 1/88×10-9 |
| Cadmium (Cd) | Circular | 0/014 | 0/301 | 4145/592 | 0/89 | 3/49×10-3 |
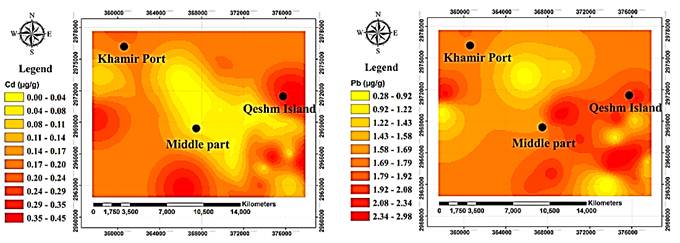
Fig. 3. The spatial distribution maps of cadmium and lead (µg/g dw) in in surface sediments of mangrove forests.
Due to low concentrations of metals in sediments in comparison with the standards and also integrated and homogenous structure of mangrove forests, it was presumed that these pollutants likely to come from a natural source such as sea water or the earth's crust. However, previous studies conducted in the mangrove forests of Iran revealed other truths. Ghaffari et al. (2012) obtained interesting results in a study conducted in order to determine the origin and distribution of n-alkanes in surface sediments of mangrove forests in the north of the Qeshm Island. The indicators of the origin of n-alkanes reveal that the origin of n-alkanes in Khamir Port is due to pouring of oil and this portion of the mangrove forests are affected by oil pollution. However, the source of the same n-alkanes in Qeshm Island is often herbaceous and is derived from the leaves of mangrove trees. But the origin of n-alkanes in sediments of the Middle part were diagnosed a combination of oil and herbaceous origins.
The results of their study are consistent with risk maps that were prepared for metals, because the eastern areas of the Middle part and mangrove forests of Qeshm Island were present closely similar values for these two metals and with moving towards the western areas of the Middle part, these values were amenable to similar values in Khamir Port. So we cannot say with certainty that all of these pollutants come from natural sources and the probabilities that these are the result of anthropogenic origins are rises. The petroleum and anthropogenic origins for metals Pb and Cd can be attributed to reception of these pollutants from maritime transportations especially around the Khamir Port. Although the concentrations of these pollutants in the study area in terms of the toxicity were not in threatening range for living organisms but it can be one of the most serious risks for mangrove ecosystems. Oil pollution in mangrove ecosystems will affect the health of a wide range of living organisms.
The present study was conducted with the aim of evaluation of pollution condition and mapping risk of heavy metals, Cd and Pb in sediments of highly sensitive mangrove forests ecosystem in Persian Gulf. Pollution of sediments with heavy metals has recently become a subject of many studies because of the serious risk it represents for the environment and human health (Giaccio et al. 2012). Hence it seems essential to carry out a detailed analysis to clarify the exact origin of pollutants in valuable and vulnerable ecosystems such as mangrove forests. The study of the spatial distribution and source identification of heavy metals in sediments is very important in order to identify pollution hot-spots and assess the potential sources of pollutants (Yuan et al. 2013). In most cases, the identification of pollutant sources is conducted with the aid of classic statistical analysis especially multivariate statistics (Sollitto et al. 2010). Furthermore, geostatistical analysis and GIS-based spatial risk mapping have been used to study spatial distribution patterns and possible hot-spots of elevated concentrations of heavy metals contamination in environment (Zhou et al. 2007; Zamani-Ahmadmahmoodi et al. 2013).
4. Conclusion
Contamination risk maps are very suitable for planning future activities in such a way that risks to the human population and to ecosystems can be prevented or at least reduced. Also, simulation and modeling of the risks in time will help decision makers to look at different scenarios for future developments and to evaluate the effects of policy measures well in advance (Lahr and Kooistra 2010). Using prepared risk maps, we have identified contaminated areas and potential sources of pollution in mangrove forests. If we only cite the results of instrumental analysis and classical statistics, mistakenly thought that the concentrations of metals Pb and Cd in study area arises from natural origins such as earth's crust and risk maps, along with previous studies conducted in the area helped us to have regard to the distribution of metals concentrations and know what areas are more contaminated to be looking for reasonable causes of pollution and reached to the conclusion that low concentrations of pollutants in mangrove forests can be caused by anthropogenic origins. Risk maps in this study were also as a warning to authorities and managers to do no wrong decisions and carry out anticipatory measures for protection of this important ecosystem.
References
- Bai J, Cui B, Chen B, Zhang K, Deng W, Gao H, Xiao R (2011) Spatial distribution and ecological risk assessment of heavy metals in surface sediments from a typical plateau lake wetland, China. Ecol Model, 222: 301–306.
- Cinnirella S, Buttafuoco G, Pirrone N (2005) Stochastic analysis to assess the spatial distribution of groundwater nitrate concentrations in the Po catchment (Italy). Environ Pollut 133: 569–580.
- de Mora S, Fowler S.W, Wyse E, Azemard S (2004) Distribution of heavy metals in marine bivalves, fish and coastal sediments in the Gulf and Gulf of Oman. Mar Pollut Bull 49: 410–424.
- Even J, Ghaffari S (2011) Determination of cadmium and lead in Northern pike from the Missouri River. Am J Undergrad Res 10: 15–20.
- Ghaffari et al., 2012. unpublished data.
- Giaccio L, Cicchella D, De Vivo B, Lombardi G, De Rosa M (2012) Does heavy metals pollution affects semen quality in men? A case of study in the metropolitan area of Naples (Italy). J Geochem Explor 112: 218–225.
- Isaaks E.H, Srivastava R.M (1989) Applied Geostatistics. Oxford University Press, New York.
- Lahr J, Kooistra L (2010) Environmental risk mapping of pollutants: state of the art and communication aspects.Sci Total Environ408: 3899–3907.
- Li F, Huang J, Zeng G, Yuan X, Li X, Liang J, Wang X, Tang X, Bai B (2013) Spatial risk assessment and sources identification of heavy metals in surface sediments from the Dongting Lake, Middle China.J Geochem Explor132: 75–83.
- Li J, Heap AD (2008) A review of spatial interpolation methods for environmental scientists (Vol. 137). Canberra: Geoscience Australia.
- Liu X, Wu J, Xu J (2006) Characterizing the risk assessment of heavy metals and sampling uncertainty analysis in paddy field by geostatistics and GIS. Environ Pollut 141: 257–264.
- Long E.R, Robertson A, Wolfe D.A, Hameedi J, Sloane G.M (1996) Estimates of the spatial extent of sediment toxicity in major US estuaries. Environ Sci Tech 30: 3585–3592.
- Nagelkerken I, Blaber S.J.M, Bouillon S, Green P, Haywood M, Kirton L.G, Somerfield P.J (2008) The habitat function of mangroves for terrestrial and marine fauna: a review. Aquat Bot 89: 155–185.
- Negreiros J,Painho M,Aguilar F,Aguilar M(2010). Geographical information systems principles of ordinary kriging interpolator. J Appl Sci 10: 825-867.
- Niu H, Deng W., Wu Q, Chen X (2009) Potential toxic risk of heavy metals from sediment of the Pearl River in South China. J Environ Sci 21: 1053–1058.
- Ouyang Y, Higman J, Thompson J, O'Toole T, Campbell D (2002) Characterization and spatial distribution of heavy metals in sediment from Cedar and Ortega rivers subbasin. J Contam Hydrol 54: 19–35.
- Paul S.K (2001) Geochemistry of bottom sediments from a river estuary shelf mixing zone on the tropical southwest coast of India. Bull Geol Surv Jpn 52: 371–382.
- Raulinaitis M, Ignatavicˇius G, Sinkevicˇius S, Oškinis V (2012) Assessment of heavy metal contamination and spatial distribution in surface and subsurface sediment layers in the northern part of Lake Babrukas. Ekologija 58: 33–43.
- Sin S.N, Chua H, Lo W, Ng L.M (2001) Assessment of heavy metal cations in sediments of Shing Mun River, Hong Kong. Environ Int 26: 297–301.
- Solgi E, Esmaili-Sari A, Riyahi-Bakhtiari A, Hadipour M (2012) Soil Contamination of Metals in the Three Industrial Estates, Arak, Iran. Bull Environ Contam Toxicol, 88: 634–638.
- Sollitto D, Romic M, Castrignanò A, Romic D, Bakic H (2010) Assessing heavy metal contamination in soils of the Zagreb region (Northwest Croatia) using multivariate geostatistics. Catena, 80: 182–194.
- Tanner P.A, Leong L.S, Pan S.M (2000) Contamination of heavy metals in marine sediment cores from Victoria Harbour, Hong Kong. Mar Pollut Bull 40: 769–779.
- Wackernagel H (2003) Multivariate geostatistics. Springer Verlag.
- Wang S, Jia Y, Wang S, Wang X, Wang H, Zhao Z, Liu B (2010) Fractionation of heavy metals in shallow marine sediments from Jinzhou Bay, China. J Environ Sci 22: 23–31.
- Webster R, Oliver M.A (2007) Geostatistics for environmental scientists. Wiley.
- Webster R, Oliver M.A (2014) A tutorial guide to geostatistics: Computing and modelling variograms and kriging. CATENA 113: 56–69.
- Yap C.K, Ismail A, Tan S.G, Omar H (2002) Correlations between speciation of Cd, Cu, Pb and Zn in sediment and their concentrations in total soft tissue of green-lipped mussel (Perna viridis) from the west coast of Peninsular Malaysia. Environ Int 28: 117–126.
- Yuan G.L, Sun T.H, Han P, Li J, Lang X.X (2013) Source identification and ecological risk assessment of heavy metals in topsoil using environmental geochemical mapping: Typical urban renewal area in Beijing, China. J Geochem Explor 136: 40–47.
- Zamani-Ahmadmahmoodi R, Esmaili-Sari A, Mohammadi J, Bakhtiari A.R, Savabieasfahani M (2013) Spatial Analysis of Cd and Pb in the Pike (Esox lucius) from Western Anzali Wetlands of Iran. Bull Environ Contam Toxicol90: 460–464.
- Zhou F, Guo H, Hao Z (2007) Spatial distribution of heavy metals in Hong Kong’s marine sediments and their human impacts: a GIS-based chemometric approach. Mar Pollut Bull 54: 1372–1384.


