International Journal of Chemical and Biomolecular Science, Vol. 1, No. 4, December 2015 Publish Date: Sep. 11, 2015 Pages: 211-217
Development and Validation of a RP-HPLC Method with PDA Detection for the Simultaneous Estimation of Acetylsalicylic Acid, Paracetamol and Caffeine in Fixed Dose Combination Tablets
Akwasi Acheampong1, *, Sylvester Addai-Arhin1, 2, J. Apau1, Wilfred O. Gyasi1
1Department of Chemistry, College of Science, Kwame Nkrumah University of Science and Technology, Kumasi, Ghana
2Department of Pharmaceutical Science, Faculty of Medicine and Health Science, Kumasi Polytechnic, Kumasi, Ghana
Abstract
Acetylsalicylic acid and paracetamol are often formulated together in combination with caffeine, an adjuvant, for the relief of pain, fever and inflammations. A new RP-HPLC method with PDA detection has been developed and validated for the simultaneous estimation of acetylsalicylic acid, paracetamol and caffeine in fixed dose combination tablets. A Brownlee analytical column RP-C8 (5 µm, 150 x 4.6 mm) was used as the stationary phase and a mobile phase composed of acidic water/methanol mixture (60/40 v/v). Isocratic elution was employed. All the three components were eluted within 5.5 minutes with retention times of 2.05 ± 0.0062 for Paracetamol, 2.45 ± 0.0030 for Caffeine, and 5.03 ± 0.0140 for acetylsalicylic acid. The method was found to be accurate with mean recoveries of 99.39 ± 1.58 %, 99.69 ± 1.45 % and 100.56 ± 1.60 % for acetylsalicylic acid, paracetamol and caffeine respectively. It was also found to be linear (R2 ˃ 0.99), precise (RSD ˂ 2.0), specific, robust, sensitive and cost effective. Two brands of tablets containing the three active ingredients were successfully assayed by the validated method. The validated method can be used in routine quality control analysis of fixed dose combination tablets containing these three active ingredients.
Keywords
Acetylsalicylic Acid, Paracetamol, Caffeine, Validation, RP-HPLC, Multi-component Drug
Received: August 26, 2015
Accepted: August 31, 2015
Published online: September 10, 2015
@ 2015 The Authors. Published by American Institute of Science. This Open Access article is under the CC BY-NC license. http://creativecommons.org/licenses/by-nc/4.0/
Contents
1. Introduction 2. Experimental 2.1. Chemicals and Reagents 2.2. Instrumentation 2.3. Preparation of Standard Stock Solutions 2.4. Preparation of Sample Solutions 2.5. LC Procedure 2.6. Method Validation 3. Results and Discussion 3.1. Method Development and Optimization 3.2. Method Validation 3.3. Application 4. Conclusion
1. Introduction
Most multi-component drug formulations usually contain two or more active ingredients which are responsible for a combined therapeutic activity of the drug. This concept is beneficial when the selective agents have different mechanisms of action that provide additive or synergistic efficacy [Li et al., 2010]. Due to increased efficacy, increased resistance of microorganisms to single component formulations and dependency and/or tolerance, there is increased production of multicomponent drug formulation which has further led to increased drug counterfeiting and adulteration [Mackey and Liang, 2011]. However, the methods of analysis in most official compendia are for single component drugs and those common to most local Pharmaceutical manufacturing companies in the analysis of multi-component drug formulations involve multiple and repeated extractions making such methods laborious and cumbersome.
To help facilitate easy and quick analysis of multi-component drugs, many scientist have worked at developing various RP-HPLC methods for the simultaneous estimation of various active components in multi-component drugs [Sawyer and Kumar, 2003; Cesar et al., 2008; Suresh et al., 2010; Tsvetkova et al., 2012; Chandra and Sharma, 2013; Malakar et al., 2013].
Combinations of analgesics as active pharmaceutical ingredients (APIs) in commercial pharmaceutical preparations usually contains two or more of the most common, i.e. acetyl salicylic acid (ASA), salicylamide, paracetamol, and codeine, together with central nervous stimulants such caffeine [Ramos-Martos et al., 2001]. Due to this, researchers have developed various methods that aim at simultaneous determination of some or all of these active ingredients. Such methods include kinetic, partial least-squares treatment of FTIR data (PLS-FTIR), PLS-UV, spectrophotometric, fluorimetry, electrochemistry, HPLC-UV and so on [La Guardia, 1996; Bouhsain et al., 1997; Abu-Qare and Abou-Donia, 2001; Ramos-Martos et al., 2001; Franeta et al., 2002; Sena and Poppi, 2004; Karim et al., 2006; Sanghavi and Srivastava, 2010; Sawant et al., 2010; Murtaza et al., 2011; Chandra et al., 2012; Chandra and Sharma, 2013].
In developing countries where state of the art facilities for drug analysis do not abound, it is important that methods are developed which are accurate, cheap, easy to use and require the use of uncomplicated equipment in order to enable easy estimation of the amounts of active ingredients in fixed dose combination tablets. The main objective of this work, therefore, is to develop and validate a new, simple, accurate, linear, precise, specific, robust, sensitive and cost effective RP-HPLC method for simultaneous estimation of acetylsalicylic acid, paracetamol and caffeine in fixed dose combination tablets.
2. Experimental
2.1. Chemicals and Reagents
The reference standards of acetylsalicylic acid (100.07 %) (Alta Labs Ltd, India), paracetamol (100.46 %) (Hebei Jiheng (Group) Pharmaceutical Co. Ltd., China), and caffeine (100.65%)(AARTI Industries Ltd, India) were used in the study. Effpac tablets (Amponsah Effah Pharmaceuticals Ltd, Ghana) and Cafalgin tablets (M&G Pharmaceuticals Ltd, Ghana) were procured from a local Pharmacy shop. Methanol and glacial acetic acid (Analar nomapur)( HPLC grade) and distilled water were used.
2.2. Instrumentation
A High Performance Liquid Chromatograph from Perkin Elmer (chromera version 4.1.0.6386) consisting of a Flexar LC quartenary pump, autosampler and a photodiode array detector (PDA) and HP Chemstation software was used for the method development. The mobile phase was acidic water/methanol (60/40 v/v). The acidic water was a combination of distilled water: glacial acetic acid (75:0.2 v/v) ratio. The stationary phase was a C8 (5 µm, 150 x 4.6 mm) column from Brownlee Analytical Ltd. Components were eluted at a wavelength of 270 nm and injection volume was 10 µL at a flow rate of 1 ml/min. Isocratic elution was employed.
2.3. Preparation of Standard Stock Solutions
Stock solutions containing 2000 µg/mL of ASA, 50 µg/mL of Paracetamol and 50 µg/mL of Caffeine were prepared using the mobile phase as the dissolution medium. Serial dilution was done for each stock solution to obtain standard solutions of concentrations 20-100 µg/mL for ASA, 2.5-20 µg/mL for Paracetamol and 1.25-10 µg/mL for Caffeine.
2.4. Preparation of Sample Solutions
Approximately 0.100 g quantity of each powdered tablet sample was accurately weighed, dissolved in some quantity of the mobile phase, transferred into a 100 mL volumetric flask and made up to the mark using the mobile phase. 1.5 ml of each tablet sample solution was further diluted to 50 mL and filtered.
2.5. LC Procedure
10 uL aliquot of each final working solution containing the analytes (reference standards and tablets) in their linear dynamic concentration ranges was injected into the liquid chromatograph: 20-100 µg/mL for acetylsalicylic acid, 2.5-20 µg/mL for Paracetamol and 1.25-10 µg/mL for Caffeine. A flow rate of 1 mL/min and working column temperature of 25°C were used. The compounds were separated on a reversed phase C8 (5 µm, 150 x 4.6 mm) Brownlee Analytical column, with a mobile phase of acidic water/methanol (60/40 v/v) employing isocratic elution. Triplicate injections were carried out for each solution. Absorbance peak areas were measured in all cases and mean peak areas computed.
2.6. Method Validation
The method was validated based on International Conference on Harmonization (ICH) guidelines. Validation parameters included accuracy, linearity, precision, specificity, robustness, limit of detection (LOD) and limit of quantification (LOQ).
2.6.1. Linearity
The linearity of the developed method was determined from the calibration plot of peak area against concentrations of standard solutions for each component. The correlation coefficient (r2) values obtained for each curve depicted the linear relationship existing between the peak areas and the concentration of the standard solutions. The linearity of the developed method was analysed statistically. Triplicate determinations for each concentration of each component of interest were carried out.
2.6.2. Accuracy
The accuracy of the developed method was determined by calculating the percentage recovery. Five (5) different concentrations of the standard solutions for the three components of interest were run in triplicate determinations for each concentration. Percentage recovery (% R) was calculated based on the formula:
% R = ![]()
The recoveries of the APIs from the tablet samples were also determined and used as a measure of the accuracy of the method.
A second method was also used in the assessment of the accuracy of the method. Here, acetyl salicylic, paracetamol and caffeine standards were accurately weighed and added to a mixture of tablet excipients at three different concentrations of 50, 100 and 200 µg/mL. Samples were prepared in triplicates at each level, and the percentage recoveries were determined.
2.6.3. Precision
Precision of the developed method was determined based on intra-day and inter-day parameters. The intra-day precision was evaluated by analysing six sample solutions (n=6) each of 20 and 100 µg/mL for ASA, 15 and 20 µg/mL for paracetamol and 2.5 and 5 µg/mL for Caffeine, calculating the actual concentrations of these standard solutions. The inter-day precision was evaluated in three consecutive days (n=18). The concentrations of the three APIs were determined and relative standard deviations (RSD) were calculated.
2.6.4. Specificity
Specificity of the developed was evaluated by preparing a solution of the reference standards of the three APIs in the presence of excipients. Five (5) injections of this solution were carried out to observe any interfering peaks.
2.6.5. Robustness
Robustness was established by varying certain HPLC conditions and keeping certain conditions constant. Six sample solutions were prepared and analysed using the established chromatographic conditions and by varying some of the conditions including the flow rate, mobile phase composition, mobile phase pH, and column temperature. These parameters were varied to determine the influence of these chromatographic conditions on the developed method. Data obtained was subjected to statistical analysis using analysis of variance (ANOVA test) [Cesar et al., 2008].
2.6.6. Limit of Detection (LOD) and Limit of Quantification (LOQ)
The LOQ and LOD of the developed method was established based on the calibration curve and using the relation:
LOD = ![]() and LOQ =
and LOQ = ![]() where σ = standard deviation of the calibration curve and s = slope of the calibration curve.
where σ = standard deviation of the calibration curve and s = slope of the calibration curve.
3. Results and Discussion
3.1. Method Development and Optimization
3.1.1. Mobile Phase Selection
In the selection of mobile phase for RP-HPLC method development, certain factors such as cost of solvent(s), polarities of solvent(s) and that of the analyte(s) of interest and the solubility of the analyte(s) were considered [Ahuja and Rasmussen, 2007; Kenkel, 2003; Skoog et al., 2004]. Preliminary studies with several solvent systems were performed to select the most effective solvent system for the separation of the three active pharmaceutical ingredients (APIs). Solvents such as ethanol, isopropyl alcohol, chloroform, and some phosphate buffers at various pH values were tried. Some of the eluents gave good resolution but a lengthy run time. Others also gave poor resolution of peaks. The mobile phase of acidic water/methanol was tried in different proportions. However, acidic water/methanol (60/40 v/v) was chosen because it produced the best resolution of peak symmetry and separation of all components within the least retention times. Glacial acetic acid was added to provide an optimum pH of 2.5 for the mobile phase since pH has a lot of influence on the retention times of ionisable compounds [Suresh et al., 2010; Singh, 2013; Ahuja and Rasmussen, 2007; Kenkel, 2003; Skoog et al., 2004]. This mobile phase composition also aided fastest elution of all the three components with retention times of 5.03 ± 0.014 for ASA, 2.05 ± 0.0062 for Paracetamol and 2.45 ± 0.0030 for Caffeine as depicted in Figure 1. The two components of the mobile phase are cheaper compared to all the others. Chandra and Sharma used the same mobile phase, though on a C-18 stationary phase, to achieve good separation and resolution for paracetamol and caffeine in formulated tablets [Chandra and Sharma, 2013].
3.1.2. Stationary Phase Selection
The stationary phase was also chosen based on the polarities of the analytes of interest. Since the analytes of interest are drug molecules which are polar, a non-polar ODS C8 (5 µm, 150 x 4.6 mm) column was chosen in order to reduce the time of interaction between the stationary phase and the analytes. This reduced the affinity of the analytes for the stationary phase, increased interaction of the analytes with the mobile phase, hence reducing the total time for the analysis [Ahuja and Rasmussen, 2007; Kenkel, 2003; Skoog et al., 2004] as depicted in Figure 1.
3.1.3. Chromatographic Conditions
The mobile phase of acidic water-methanol (60:40 v/v) ratio and a flow rate of 1 ml/min aided a better resolution of peaks and separation of components. These together with the column C8 (5 µm, 150 x 4.6 mm), wavelength of 270 nm and isocratic mode of elution gave a well-defined chromatographic conditions that resulted in a better peak resolution and separation of components within elution period of 5.5 minutes. This is illustrated in Figure 1.
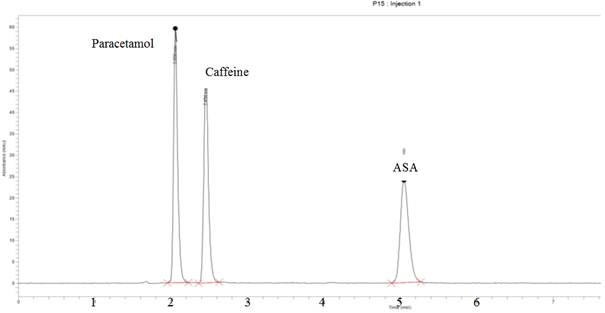
Figure 1. Chromatogram of ASA, Paracetamol and Caffeine in a ternary mixture.
3.2. Method Validation
Standard calibration graphs for the analytes were constructed by plotting peak areas produced by injection of standard solutions against the concentrations used. The calibration graphs were analysed by regression analysis, and the equation, correlation coefficient, slope, and y-intercept were calculated. Results are found in Table 1.
Table 1. Calibration curve data for ASA, Paracetamol and Caffeine.
| Regression Parameters | ASA | Paracetamol | Caffeine |
| Regression Equation | Y=1.912x – 3.009 | y=14.42x – 0.102 | y=28.49x – 3.972 |
| Correlation coefficient (r2) | 0.9933 | 0.9978 | 0.9991 |
| Slope | 1.913 | 14.428 | 28.498 |
| Y-intercept | -3.009 | -0.103 | -3.9728. |
| Concentration range (µg/mL) | 20-100 | 2.5-20 | 1.25 - 10 |
| Number of points | 5 | 5 | 5 |
3.2.1. Linearity
Linearity of the developed method was determined from the standard calibration graphs using regression analysis. The developed method was found to be linear with correlation coefficient (r2) values of more than 0.99 for each component in the assayed range. The regression analysis is presented in Table 1.
3.2.2. Accuracy
The accuracy of the developed method was computed for by calculating the percentage recoveries of five different concentration of each component in the ternary mixture. The percent recovery values are presented in Table 2.
3.2.3. Precision
Precision of the developed method was also determined based on inter and intra-days precisions. Results are presented in Table 4. It can be seen that the method is precise since the RSD values for both inter-day and intra-day precision were far below 2.0.
Table 2. Mean recovery of acetylsalicylic acid, paracetamol and caffeine from the ternary mixture.
| Acetylsalicylic acid | Paracetamol | Caffeine | ||||||
| Amount injected (µg/mL) | Amount recovered (µg/mL) | % recovery | Amount injected (µg/mL) | Amount recovered (µg/mL) | % recovery | Amount injected (µg/mL) | Amount recovered (µg/mL) | % recovery |
| 20 | 21.70 | 101.50 | 2.5 | 2.42 | 98.85 | 1.25 | 1.33 | 102.51 |
| 40 | 37.39 | 98.52 | 5 | 4.29 | 99.20 | 2.5 | 2.34 | 98.45 |
| 60 | 58.66 | 97.77 | 10 | 10.21 | 100.75 | 5 | 5.07 | 101.40 |
| 80 | 83.67 | 10059 | 15 | 15.45 | 101.60 | 7.5 | 7.57 | 100.93 |
| 100 | 98.55 | 98.55 | 20 | 19.61 | 98.05 | 10 | 9.95 | 99.50 |
| ∑=99.39 | ∑=99.69 | ∑=100.56 | ||||||
| SD = 1.58 | SD = 1.45 | SD= 1.60 | ||||||
The mean recovery values of 99.39 ± 1.58 for ASA, 99.69 ± 1.45 for paracetamol and 100.56 ± 1.60 for caffeine depicts the accuracy of the method. The method was also accurate in the presence of tablet excipients as shown in Table 3. The mean recoveries and standard deviations at all three levels of determination, were very good for all three APIs.
Table 3. Mean recovery of acetylsalicylic acid, paracetamol and caffeine in the presence of tablet excipients.
| Acetylsalicylic acid | Paracetamol | caffeine | |||
| Amount added (µg/mL) | Mean recovery (%) ± SD | Amount added (µg/mL) | Mean recovery (%) ± SD | Amount added (µg/mL) | Mean recovery (%) ± SD |
| 50 | 101.34 ±0.25 | 50 | 100.38 ±1.02 | 10 | 101.60 ±0.95 |
| 100 | 99.95 ±1.02 | 150 | 101.15 ±0.65 | 20 | 100.25 ±0.85 |
| 200 | 100.25 ±0.58 | 300 | 99.90 ±0.78 | 40 | 99.65 ±0.88 |
3.2.4. Robustness
Robustness of the method was examined by examining changes in different experimental conditions. The developed method showed a high level of robustness as changes in mobile phase pH (±0.2 pH units), methanol composition in mobile phase (±2%), wavelength (± 2 nm), and temperature (± 3°) did not adversely affect the developed method. Statistical results obtained with these changes in chromatographic conditions were almost the same as statistical results from the original chromatographic conditions.
3.2.5. Specificity
The method was very specific to the three APIs under consideration. Peak purities higher than 99% were obtained for all three APIs in the chromatograms of sample solutions. It showed no interfering peaks on the retention times of the APIs in the presence of excipients. This was very evident in the chromatograms of the tablet sample as illustrated in Figure 2;
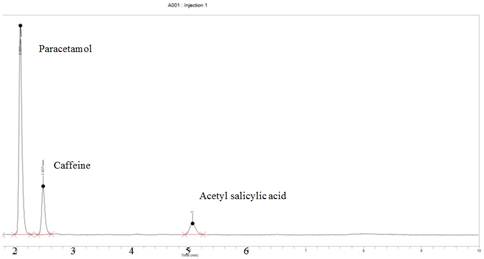
Figure 2. Typical chromatogram produced by a tablet sample showing the separation of paracetamol, caffeine and acetyl salicylic acid using the developed method.
3.2.6. Limit of Detection and Limit of Quantification
This is a measure of the sensitivity of the developed method and the HPLC equipment (Chromera version 4.1.0.6386) used for the method development. The results are presented in Table 4. The lowest amount of ASA, Paracetamol and Caffeine that could be detected and quantified were 1.078 x 10⁻⁵; 3.267 x 10⁻⁵ µg/mL, 0.00; 0.00 and 1.237 x 10⁻⁷; 2.193 x 10⁻⁶ µg/mL respectively. These values are very small and indicate that even the smallest amount of the analyte(s) can be detected using the developed method and the HPLC equipment under consideration. Hence the method and the equipment are very sensitive. The zero LOD and LOQ of paracetamol indicates that Paracetamol has virtually no detection and quantification limit, hence the smallest amount can be detected and quantified by the developed method.
Table 4. Summary of validation parameters of Acetyl salicylic acid, Paracetamol and Caffeine.
| Parameter | ASA | Paracetamol | Caffeine |
| Linearity (R2) | 0.9933 | 0.9978 | 0.9991 |
| Intra-day precision (% RSD) | 0.108 | 0.056 | 0.17 |
| Inter-day precision (% RSD) | 0.143 | 0.091 | 0.207 |
| LOD (ppm) | 1.078 x 10⁻⁵ | 0.00 | 7.237 x 10⁻⁷ |
| LOQ (ppm) | 3.267 x 10⁻⁵ | 0.00 | 2.193 x 10⁻⁶ |
| Accuracy (%) | 100 ± 5.91 | 99.15 ± 3.22 | 100.36 ± 4.59 |
| Robustness | Robust | Robust | Robust |
| Specificity | Specific | Specific | Specific |
3.3. Application
The developed method was used for the simultaneous estimation of the APIs in fixed dose combination tablets. Two such tablets on the market, EFPAC and CAFALGIN, were analysed with the proposed method and the results are presented in Table 5. The content (mg) and percentages of each API in each tablet sample was also computed using peak areas and the regression equations from the calibration curves. The mean content obtained for ASA, paracetamol and caffeine in both formulated products were very close to the labelled amount. The results show that the method is accurate in determining the content of the three active ingredients in fixed dose combination tablets.
Table 5. Content of acetylsalicylic acid, paracetamol and caffeine in the fixed dose combination tablets.
| Tablet Samples | Acetylsalicylic acid | Paracetamol | caffeine | |||
| Label claim (mg) | Mean Content (%) ± S.D. | Label claim (mg) | Mean Content (%) ± S.D. | Label claim (mg) | Mean Content (%) ± S.D. | |
| EFFPAC | 150 | 101.34 ±0.86 | 250 | 100.38 ±0.98 | 30 | 103.60 ±0.65 |
| CAFALGIN | 230 | 98.16 ±0.59 | 150 | 99.18 ±1.01 | 30 | 102.10 ±1.10 |
4. Conclusion
A new RP-HPLC method with PDA detection has been developed and validated for the simultaneous identification and quantitation of acetylsalicylic acid, paracetamol and caffeine in fixed dose combination tablets. The developed RP-HPLC method is simple, precise, accurate, linear, specific, robust and cheap, and can be used in routine quality control analysis for the simultaneous quantification and estimation of fixed dose combination tablets containing acetylsalicylic acid, paracetamol and caffeine in fixed dose combination tablets. The two brands of tablets analysed by the validated method had contents of the three APIs very close to the label claim, and therefore showed adequate quality.
References
- Abu-Qare, A. W., & Abou-Donia, M. B. (2001). A validated HPLC method for the determination of pyridostigmine bromide, acetaminophen, acetylsalicylic acid and caffeine in rat plasma and urine. Journal of pharmaceutical and biomedical analysis, 26(5), 939-947.
- Ahuja, S., Rasmussen, H. HPLC Method Development for Pharmaceuticals. Volume 8. Johnson and Johnson Pharmaceutical Research and Development, LLC. Raritan; New Jersey: 2007.p. 1–533.
- Bouhsain, Z., Garrigues, S., & de la Guardia, M. (1997). PLS-UV spectrophotometric method for the simultaneous determination of paracetamol, acetylsalicylic acid and caffeine in pharmaceutical formulations. Fresenius' journal of analytical chemistry, 357(7), 973-976.
- Chandra, P., Rathore, A. S., Lohidasan, S., & Mahadik, K. R. (2012). Application of HPLC for the simultaneous determination of aceclofenac, paracetamol and tramadol hydrochloride in pharmaceutical dosage form. Scientia pharmaceutica, 80(2), 337.
- Chandra, R., and Sharma, K.D. (2013). Quantitative determination of paracetamol and caffeine from formulated tablets by reversed phase-HPLC separation technique. International Journal of Chromatographic science, 3(2), 31-34.
- César Da Costa, I., Nogueira, F. H. A., & Pianetti, G. A. (2008). Simultaneous determination of artemether and lumefantrine in fixed dose combination tablets by HPLC with UV detection. Journal of Pharmaceutical and biomedical analysis, 48(3), 951-954.
- Franeta, J. T., Agbaba, D., Eric, S., Pavkov, S., Aleksic, M., & Vladimirov, S. (2002). HPLC assay of acetylsalicylic acid, paracetamol, caffeine and phenobarbital in tablets. Il Farmaco, 57(9), 709-713.
- Karim, M. M., Jeon, C. W., Lee, H. S., Alam, S. M., Lee, S. H., Choi, J. H., & Das, A. K. (2006). Simultaneous determination of acetylsalicylic acid and caffeine in pharmaceutical formulation by first derivative synchronous fluorimetric method. Journal of fluorescence, 16(5), 713-721.
- Kenkel, J. Analytical Chemistry for Technicians. Third Edition. Published by CRC Press LLC; USA: 2003. p. 1–545.
- La Guardia, M. (1996). Simultaneous stopped-flow determination of paracetamol, acetylsalicylic acid and caffeine in pharmaceutical formulations by Fourier transform infrared spectrometry with partial least-squares data treatment. Analyst, 121(12), 1935-1938.
- Li, S., Zhang B.O., and Zhang, N. (2010). Network target for screening synergistic drug combination with application to traditional Chinese medicine. BMC Systems Biology, 5(1), 1-13.
- Mackey, T. K., & Liang, B. A. (2011). The global counterfeit drug trade: patient safety and public health risks. Journal of pharmaceutical sciences, 100(11), 4571-4579.
- Malakar, P., Deb, A. R., Adhikary, S., Ahmed, S., & Maloth, R. (2013). Simultaneous estimation of phenylephrine hydrochloride, paracetamol, caffeine and cetirizine dihydrochloride from tablet dosage form using RP-HPLC. International Journal of Biological & Pharmaceutical Research, 4, 368-376.
- Murtaza, G., Khan, S. A., Shabbir, A., Mahmood, A., Asad, M. H. H. B., Farzana, K., & Hussain, I. (2011). Development of a UV-spectrophotometric method for the simultaneous determination of aspirin and paracetamol in tablets. Scientific research and Essays, 6(2), 417-421.
- Ramos-Martos, N., Aguirre-Gómez, F., Molina-Díaz, A., & Capitán-Vallvey, L. F. (2001). Application of liquid chromatography to the simultaneous determination of acetylsalicylic acid, caffeine, codeine, paracetamol, pyridoxine, and thiamine in pharmaceutical preparations. Journal of AOAC International, 84(3), 676-683.
- Sanghavi B, and Srivastava A. (2010). Simultaneous voltammetric determination of acetaminophen, aspirin and caffeine using an in situ surfactant-modified multiwalled carbon nanotube paste electrode. Electrochimica Acta, 55, 8638-8648.
- Sawant, R., Bhangale, L., Joshi, R., & Lanke, P. (2010). Validated spectrophotometric methods for simultaneous estimation of Paracetamol, Domperidone and Tramadol HCl in pure and tablet dosage form. Journal of chemical metrology, 4(1), 21-27.
- Sawyer, M., & Kumar, V. (2003). A rapid high-performance liquid chromatographic method for the simultaneous quantitation of aspirin, salicylic acid, and caffeine in effervescent tablets. Journal of chromatographic science, 41(8), 393-397.
- Sena, M. M., & Poppi, R. J. (2004). N-way PLS applied to simultaneous spectrophotometric determination of acetylsalicylic acid, paracetamol and caffeine. Journal of pharmaceutical and biomedical analysis, 34(1), 27-34.
- Singh, R. (2013). HPLC Method Development and Validation - An Overview. J Pharm Educ Res., 4(1), 26–33.
- Skoog, D. A., West, D. M., Holler, J. F., Crouch, S. R. Fundamentals of Analytical Chemistry. 8th Edition. Published by David Harris, Belmont; USA: 2004. p. 1–1157.
- Suresh, S. K., Latif, J. D., Krishnamurthy, B., Prashant, B., Vasantharaju, S. G., Udupa, N. (2010). Analytical Method Development and Validation for Aspirin. International Journal of ChemTech Research, 2(1), 389–399.
- Tsvetkova, B., Pencheva, I., Zlatkov, A., & Peikov, P. (2012). Simultaneous high-performance liquid chromatography determination of paracetamol and ascorbic acid in tablet dosage forms. African Journal of Pharmacy and Pharmacology, 6(17), 1332-1336.


