International Journal of Chemical and Biomolecular Science, Vol. 1, No. 4, December 2015 Publish Date: Sep. 18, 2015 Pages: 227-237
Behaviour of Metals and Thyroid Hormones in Hyperthyroid Patients
Saadia R. Tariq1, *, Asma Rashid Tariq2, Samra Lateef1, Farhana Mazhar1
1Department of Chemistry, Lahore College for Women University, Lahore, Pakistan
2Institute of Chemistry, the University of Punjab, Lahore, Pakistan
Abstract
Trace metals are known to trigger many biological reactions. Any imbalance in their levels may cause various thyroid disorders like hyperthyroidism. It is therefore, quite important to study the relationships between trace metals and thyroid hormones to help understand the etiology of disease and search for an appropriate treatment regime. To this effect, the levels of selected trace metals were determined in fifty one patients of hyperthyroidism and their age and gender matched healthy controls by using flame atomic absorption spectrophotometer following wet digestion method and the levels of free T3, T4 and TSH were determined by radioimmunoassay technique available at the laboratories of Jinnah Hospital, Lahore. The study evidenced that all the selected trace metals (Cr, Co, Cd, Fe, Ni) were present at enhanced levels in the blood of patients as compared to healthy controls. These metals may affect the thyroid functions (like conversion of T4 to T3) by disturbing the activity of thyroid peroxidase like enzymes. An increasing trend in the concentration of all the metals except Ni was observed with age. Correlation study evidenced Co to be significantly positively correlated with TSH. Gender based studies revealed higher mean values of metals in male patients than in female patients. The exposure of individuals to various metals may lead to the enhanced levels of these metals in the blood. These metals being catalysts for many biological reactions may cause imbalance in thyroid hormones, leading to thyroid dysfunction.
Keywords
Hyperthyroidism, Metals, T4, Thyroid Stimulating Hormone, Triiodothyronine
Received: August 5, 2015
Accepted: September 2, 2015
Published online: September 17, 2015
@ 2015 The Authors. Published by American Institute of Science. This Open Access article is under the CC BY-NC license. http://creativecommons.org/licenses/by-nc/4.0/
1. Introduction
Hyperthyroidism is a condition representing a hyperactive thyroid gland that results from endocrine maladies1.The statistics have shown that about 200 million people worldwide suffer from thyroid disorders with half of these being undiagnosed. Hyperthyroidism corresponds to about 20 % of all these diagnosed thyroid dysfunction cases. The individuals suffering from hyperthyroidism experience muscular weakness increased urinations, breathlessness, laboured respiration, and sleep apnea2. Hyperthyroidism causes accelerated heart rate and fatigue, even at rest. Actually, it produces lower exercise tolerance due to accelerated protein and fat catabolism that lead to the build-up of ketones. Hyperthyroid people often show a fine tremor in their hands. Some experience high overloads of thyroid hormones that accelerate their heart rate to as high as 300 beats a minute - a very life threatening condition that can cause an arrhythmia or heart attack. The clinical investigations have evidenced hyperthyroidism to be associated with elevated T4 and T3 levels and suppressed TSH levels. The normal ranges for these parameters have been reported to be as T4 = 5.6 - 13.7 g. dL-1, T3 = 70-180 ng. dL-1, TSH = 0.3 - 3.0 m IU. L-1 3 these levels are vital for the developmental and physiological functioning of the central nervous system and also for the regulation of synaptogenesis and neuronal growth 4.
The trace metals have been evidenced to be involved in various endocrine functions 5, 6. Similarly, hormones have been shown to influence the trace metal metabolism (i.e. their excretion and transport). In a study, thyroid hormone was evidenced to modulate the binding activity of iron regulatory protein to an iron responsive element 7. The nodular goitre patients were found to exhibit significantly lower concentrations of trace metals such as Fe3+ and Se than healthy individuals8, 9. Lower T3 values were found in individuals with high blood Pb levels because Pb damages the thyroid function by inhibiting the deiodination of T410.
Heavy metals have long been known to interfere with thyroid function. Cadmium is one of the toxic heavy metal that has been shown to trigger an autoimmune hyperthyroidism 11. That’s why the children with alterations in thyroid hormones were found to exhibit high blood levels of Cd 12. Studies have also evidenced a positive association between cadmium exposure and thyroid hormones in adults 13. Cadmium-induced thyroid dysfunction was shown to be synergistically controlled by selenium and zinc 14. Similarly, lead exposure through air, water and food was linked to thyroid disorders 15-17. Elevated mercury levels may also cause autoimmune thyroid disorders 18. Organic mercury was found to be linked to alterations in thyroid hormones via the mechanism of selenium depletion, that is essential for proper thyroid function 19. There is also evidence that exposure to arsenic can affect thyroid health 20, possibly by affecting the thyroid hormone receptors 21.
In view of these considerations, the present study was formulated to evaluate the metal and thyroid hormone levels in hyperthyroid patients and their age and gender matched controls. The correlation coefficient matrix between blood trace metals and thyroid hormones was also accomplished in parallel with previous studies whereby the involvement of various metals in different diseases was established22-26.On overall basis, the study focused on tracing any significant link between hyperactive thyroid function and selected metals that may help in the treatment of disease.
2. Experimental Methodology
2.1. Sampling and Pre-treatment
For the present study, the patients with diagnosed symptoms of hyperthyroidism were included in the study. The hyperthyroidism was diagnosed on the basis of T3, T4 and TSH values of these patients. A total of fifty one patients of hyperthyroidism belonging to both genders having ages between 11 - 50 years were included in the study and the blood samples were collected at an early stage of disease just after diagnosis. The entire protocol of the study was approved by the ethical committee of respective hospital. A 5.0 mL portion of the blood was collected from antecubital vein of each patient and healthy donor in pyrogen free disposable syringes by trained phlebotomists to avoid any discomfort or discrepancy in the quality or quantity of the sample, in accordance with standard recommended protocols27. Hemolysed blood samples were discarded. For the determination of thyroid hormones, serum was extracted from blood samples by allowing it to clot and subsequently centrifuging at 3000 rpm for fifteen minutes28. The serum samples thus separated were stored at −20 C into evacuated polystyrene vials duly labelled with relevant codes.
The T3, T4 and TSH values were determined at the pathology laboratories of Jinnah Hospital Lahore by using radioimmunoassay technique just after sample collection to avoid any error in measurement. From the clinical picture and thyroid function tests i.e. free thyroxin (T4), free triiodothyronine (T3), thyroid stimulating hormone (TSH), the patients were diagnosed as having hyperthyroidism. Volunteer healthy donors (n=51) belonging to same areas, with age and gender matched groups were also included in the study. The information related to the donor’s name, age, gender T3, T4 and TSH values were all recorded and compiled on regular proforma at the time of sampling. Written consent of patients and healthy volunteers here after called controls was obtained prior to study. Utmost care was taken to avoid all potential pre-analytical contamination and preserve the integrity of the sample during specimen acquisition. The time elapsed between blood collection and subsequent processing was kept as small as possible29. During the study good laboratory practices were maintained throughout. The subjects were informed about the objectives of study and written consent was duly obtained from the volunteers.
2.2. Blood Metal Analysis
Wet acid digestion method was used for blood metal analysis by AAS. Here, the blood samples were treated with nitric acid and perchloric acid (10:1 v/v) mixture in a micro-digestion flask. Subsequently, the contents were heated moderately until white dense fumes evolved and a clear solution was obtained. The contents were cooled to room temperature and diluted to appropriate volume30. The blanks were prepared by following the same procedure but without blood to avoid any contamination of samples. To ensure the precision, blanks were run after every ten samples. The solution thus obtained was used for direct aspiration onto Hitachi AA spectrophotometer Model AA-5000, equipped with Zeeman background correction facility for the estimation of selected metals (i.e. Fe, Co, Ni, Cr and Pb), as atomic absorption spectrophotometer has been referred to as an ideal instrument for the determination of the metals present in biological samples31. Standard optimum analytical conditions were maintained and periodically checked on AAS for each metal as per manufacturer’s instructions.
All the chemicals and reagents used during the analysis were of spectroscopic grade with a certified purity of 99.99% obtained from E-Merck, Germany. The processing and preparation of samples was carried out all in pyrex glassware. To establish the precision of the results, three sub samples of each sample were run onto FAAS and mean of these three values was then used. The inter-laboratory comparison of the metal data was furnished by parallel analysis of samples at The University of the Punjab (PU), Lahore. The results of two laboratories differed not more than 5.0%.
2.3. Statistical Data Treatment
The data obtained for TSH, T3 and T4 levels and the metal concentrations were subjected to statistical treatment for a better understanding of various aspects of study. This statistical treatment included evaluation of basic statistical parameters like minimum, maximum, mean, standard deviation and standard error etc. Pearson correlation coefficient matrix was also extracted to determine the metal-to-metal and metal-to-thyroid hormone correlations. The age and gender based differences in the studied parameters was also studied.
3. Results and Discussion
The data for T3, T4 and TSH values and levels of various metals i.e. Cr, Co, Ni, Pb and Fe determined in the blood samples of fifty one patients of hyperthyroidism and their age and gender matched healthy controls is elaborated in Table 1 in terms of mean, SD and SE etc. The T3 values of these patients ranged from 1.3 to 403 ng.mL-1 with a mean value of 125 ng.mL-1. The T4 values were found to exhibit a mean value of 11.97 µg. d L-1. TSH (thyroid stimulating hormone), was recorded at the mean value of 2.143 mIU. L-1. In case of controls the TSH values ranged from 1.71 to 12.33 with the mean value standing at 5.021 mIU. L-1. The mean T3 and T4 levels in hyperthyroid patients were found to be present at much enhanced levels and TSH was found at much reduced levels than controls -a condition indicative of hyperthyroidism32.
Fe in the blood of patients was present at a mean concentration of 1.019 mg. L-1 against the mean concentration of 0.673 mg. L-1 recorded for controls. It has been shown that enhanced Fe levels may increase the activity of thyroid peroxidase enzyme and thus increase the conversion of T4 to T333. Therefore, the present study suggests a continuous monitoring of Fe along with T3, T4 and TSH during the treatment of disease. The mean concentrations of Co, Ni and Pb were found to be comparable i.e. 0.330, 0.329 and 0.350 mg. L-1 respectively. Chromium was found to be present at the least mean level of 0.195 mg. L-1 in patients. The order of mean levels of various metals in the blood of patients thus remained Fe > Pb > Co > Ni > Cr. A comparison of mean metal levels of patients with healthy donors revealed the enhanced levels for almost all the metals. The selected metals though are essential for most of the biochemical processes but their enhanced levels arising from exposure to their sources may lead to various biochemical disorders 34, 35. The sources of exposure of these metals may be either occupational or the contaminated food. Enhanced exposure to paints and emulsions may lead to elevated lead levels in the blood. Similarly, consumption of vegetable ghee or working in Ni-Cd battery manufacturing unit may cause high Ni levels in blood. Ni-chromium electroplating has also been shown to be the contributor to Cr. Thus the individuals working in metal contaminated environments must adopt standard operating procedures and protect themselves as much as possible from the hazardous exposures.
The correlation coefficient matrix is an important tool that helps in understanding the influence of one parameter on the other on mass basis. The data for metal-to-metal and metal-to-hormone correlation coefficients for patients and controls is provided in Table 2. Here age of the patients was found to be significantly negatively correlated with T3 (r -value of - 0.348) indicative of the fact that with the increase in the age of the patients their triiodothyroxin levels decreased, but no such correlation was observed in healthy donors. Similar results were also obtained by Silva and Williams, (1991)35. T3 was also found to be significantly negatively correlated with TSH thereby evidencing an increase in concentration of one parameter, with the decrease in the concentration of other. This correlation was attributed to a negative feedback mechanism of TSH for T336.
Most of the metal pairs were found to be significantly positively correlated with each other in the blood samples of hyperthyroidism patients. The strongest positive correlation was observed between Cr and nickel with an r-value of 0.867. Pb was found to be correlated with nickel with r –value of 0.798. Similarly Co was significantly positively correlated with Ni with an r-value of 0.613. Other metal pairs that were found to be significantly positively correlated included Cr-Co (r-value 0.527), Cr- Pb (r-value 0.730), and Pb-Co (r-value 0.687). None of the metals were found to be significantly correlated with the age of patients. Co was the only metal that was found to be significantly positively correlated with TSH. Co is known to functions as a cofactor of many enzymes in biological systems37. Thus, its correlation with TSH is worth considering and thus requires further investigation. Ni was also found to be positively correlated with TSH, though non-significant, but this correlation was also important because Ni affects the biological processes by acting on certain metallo-enzymes38. In case of healthy donors, Co was found to be significantly positively correlated with T4. Moreover, Fe and Pb were found to be significantly negatively correlated with each other contradictory to the patients. Thus different correlation patterns were observed among the measured parameters in the healthy controls and patients pointing towards the altered behaviour of metals in hyperthyroid conditions.
3.1. Age Based Studies
The human body metabolism has been shown to be affected with age. Thus it is imperative to study the changes in metal levels and thyroid hormones with the age of patients. The data set was divided into four groups corresponding to ages, 11-20 years, 21-30 years, 31-40 years, and 41-50 years respectively and depicted in Table 3. For the patients belonging to 11-20 years of age, the mean age was found to be 13.4 years. Among these patients, the prevailing mean T3 value was 196.5 ng. mL-1 against a maximum value of 237 ng. mL-1. The mean T4 and TSH values observed for this group of patients were 8.423 µg. d L-1 and 1.955 mI U. L-1 respectively. Among the metals, the highest mean concentration was observed for iron (0.618 mg .L-1) which was found to range from 0.34-0.99 mg. L-1. Co was the metal that secured second highest mean value standing at 0.362 mg. L-1. It was followed by lead being present at mean level of 0.288 mg. L-1. The mean concentrations of Ni and Cr were found to be 0.257 and 0.206 mg. L-1 respectively. The order for the mean levels of metals was: Fe > Co > Pb > Ni > Cr.
The descriptive statistics for the patients of age group 21 - 30 years exhibited the mean age of patients to be 26.5 years. These patients exhibited reduced T3 values (i.e. 177.7 ng. mL-1) than Group I. On the other hand T4 and TSH values exhibited an increasing trend which was reflected not only in their mean values but also maximum values observed. The order observed for mean levels of metals for this group of patients was Fe > Pb > Co > Ni > Cr.
With an average age of 35.67 years, the Group III (ages between 31 - 40 years) again exhibited the highest mean value for T3 standing at 106 ng. mL-1, while the mean values observed for T4 and TSH were 5.473 µ. dL-1 and 1.541 mI U. L-1 respectively. Among all the metals, the maximum mean values were observed for Fe being present at 0.831 mg. L-1- a value slightly smaller than observed in Group II. Ni exhibited the mean level of 0.374 mg. L-1. The next higher mean values were observed for Pb at 0.357 mg. L-1. The least concentrations in blood were observed for Cr being present at mean value of 0.215 mg. L-1, quite comparable to the values observed in previous group. Thus the overall order of the mean levels of metals in the blood of patients was: Fe > Ni > Pb > Co > Cr. The data evidenced that the levels observed for Fe, Co and Pb were lower than the previous group while the values observed for the Cr and Ni were somewhat enhanced with the age of the patients.
The descriptive statistics for the metal levels in the blood samples of the patients of Group IV (ages between 41-50 years) also showed that the maximum mean values were observed for Fe standing at 0.563 mg. L-1, this level was quite low as compared to one found for the previous three groups. It was followed by the levels for Ni whose mean value was recorded at 0.261 mg. L-1. Pb was present at maximum level of 0.670 mg. L-1 against the mean value of 0.245 mg. L-1. Cobalt and Cr were present at mean levels of 0.207 and 0.145 mg. L-1 respectively. Thus the order of mean metal levels was found to be: Fe > Ni > Pb > Co > Cr. The mean age of this group of patients was 44.9 years. They exhibited reduced T3 values and elevated T4 and TSH values than all other groups. The data set ensured that with the increase in the age of the patients up to 30 years, the mean concentration levels for all the metals were increased. Afterwards a decline in the mean levels of all the metals was observed with the exception of Cr and Ni that were increased up to an age of 40 years and decreased in the next decade of life. Previous studies have evidenced that in normal individuals T3 values exhibited an increasing trend after second decade of life. In the present study, the abnormal thyroid function has resulted in a decreasing trend36, 39, 40.
A comparison of mean metal levels and thyroid hormones of patients of various age groups with their age matched controls is presented in Figure 1. The T3 values of the patients included in all age groups was found to be much enhanced than healthy donors, while a reverse pattern was observed for mean TSH levels in Groups I and III, marking a condition of hyperthyroidism. In the remainder of the two groups, slightly enhanced levels of TSH were observed for patients than for healthy controls. Fe was present at higher levels in controls than in patients of all age groups, while Co, Cr and Ni were found to be present at much enhanced levels in all age groups. This indicated that Fe is depleted under the condition of hyperthyroidism. The levels of Pb were present at approximately the same levels in 1st age group, while they were enhanced in second and third age group in patients. In case of fourth age groups they were enhanced among the controls than in patients. There are evidences that Pb may disrupt thyroid function41. Previous studies have also evidenced elevated level of Cr in hyperthyroidism as observed in present study42.
The correlation coefficient matrix for the various age groups of the patients is presented in Table 4. The data set for Group I exhibited a very strong negative correlation between TSH and T4 values with an r-value of 0.879, evidencing that T4 values are decreased with increase in the value of TSH, which are quite parallel to the previous studies of Ahmed et al., whereby decreased level of TSH led to elevated T3 and T4 levels due to negative feedback mechanism36. A very strong positive correlation was observed between T3 and cobalt levels (r = 0.803) which is quite important and needs the attraction of scientists to probe for underlying relation between the two. It may also be suggested that by controlling the Co levels, perhaps T3 levels and hence hyperthyroidism may be controlled. Only naïvely significant positive relationship was observed between T4 and Fe. The strongest positive correlation among the blood metals of this group of patients was observed between Fe - Cr (r-value = 0.972). Another strong relation was found between Ni-Pb (0.881). The age of the patients was also found to be strongly positively correlated with the Co levels evidencing the accumulation of cobalt with the increase in the age of patients. With the increase in the age of patients, the exposure to metal at workplace is enhanced. This environmental exposure may lead to enhanced metal levels in blood thereby leading to abnormal enzymatic activity as Co is a cofactor of many enzymatic systems.
The correlation coefficient matrix for second age group (21 - 30 years) of patients depicted that none of the thyroid hormone was correlated significantly with each other. A significant positive correlation (r-value 0.546) was observed between T4 and Fe levels showing an increase in Fe levels with the increase in T4 values. Almost all the metals here were found to be significantly positively correlated. Among these, the strongest relationship was observed between Cr - Ni (r - value 0.902) pair, which was followed by Pb-Ni (r - value 0.893). The other significantly correlated metal pairs included Fe - Pb (r - value 0.885), Pb - Cr (r-value 0.824), Ni - Fe (r-value 0.768), Fe - Cr (r-value 0.717), and Fe - Co (r-value 0.654) etc. Iron was the only metal that was found to be significantly positively correlated with T4. The age of the patients was also found to be positively correlated with the cobalt levels. So up to an age of thirty years Co levels exhibited an increasing trend.
For the third group of patients, a significant correlation was observed between T3 and T4 values with an r-value of 0.667. The age of the patients was also found to be significantly positively correlated with T3 and T4 values. All the correlations observed among the metal pairs here were significant, similar to the previous group. In contrast to the previous two age groups, the age of the patients here was found to be significantly negatively correlated (r-value -0.542) with Co.
Quite different correlations were observed in Group IV patients corresponding to the ages 41 - 50 years as compared to previous cases. Here a significant correlation was observed between T4 and TSH with r-value of 0.525 which was quite in contrast to group I where these parameters were found to be negatively correlated. Here again all metal pairs were found to be positively correlated. The most significant correlation was observed between Cr and Ni with an r-value of 0.926 evidencing that in 92.6% cases the concentrations of Ni and Cr went hand in hand. Cr was also found to be significantly correlated with Fe (r = 0.644), Co (r = 0.645) and Pb (r-value 0.617). Fe was significantly correlated with Pb with r-value of 0.643 and Co (r-value 0.564).
On overall basis, up to an age of forty years, increased blood iron levels of the patients were observed. Co and Pb levels also followed an increasing trend up to an age of 30 years and decreased afterwards.
3.2. Gender Based Studies
The gender based distribution of various metals and thyroid hormones in the blood samples of patients of hyperthyroidism is presented in Table 5. The mean T3 values for male patients were found to be 120 ng. mL-1 with a maximum value of 327 ng. mL-1. The T4 and TSH values observed for these patients ranged from 1.2-87.20 µg. d L-1 and 0.16-5.50 µg. d L-1 respectively with the mean values standing at 11.68 µg. d L-1 and 1.793 m IU. L-1 respectively. The higher mean values for all the three hormones were observed for the female patients i.e. 128 ng. mL-1, 12.14 µg. d L-1 and 2.301 m I U. L-1 for T3, T4 and TSH respectively. These facts are in contrast to the trends observed in normal males and females where T4 levels were found to be higher for males than for females in accordance with previous studies36.
Twenty male patients with an average age of 34.5 years exhibited the highest mean values of 1.498 mg. L-1 for Fe among the studied metals. Quite low mean Fe values were observed for the 31 female patients belonging to an average age of 32.3 years. A comparative evaluation revealed that female patients exhibited higher mean Co levels in the blood than male patients. The situation observed for Pb, Cr and Ni was quite opposite. For these metals higher mean values were observed for male patients. The order observed for mean metal levels in male patients was: Fe > Pb > Ni > Co > Cr while the order observed for female patients was: Fe > Co > Pb > Ni > Cr. A comparison of these metal levels in various gender based groups and the controls is presented in Figure 2, where in case of both the male and female patients, enhanced levels were observed for all the metals with the exception of Fe which was found to be present at higher levels in healthy female donors than in patients. In both male and female gender categories the T3 and T4 levels were found to be depressed in healthy donors than in patients.
The correlation coefficient matrix for the male and female patients is depicted in Table 6. A number of significant correlations were observed among various parameters in both the genders. In female patients, the age was found to be significantly positively correlated with T4 values (r-values 0.394) quite in agreement with results of Sack. T3 values exhibited a significant decrease with the increase in age of the patients quite in parallel with previous studies39, 43. TSH was also negatively correlated with T3 with r-value of 0.333. In case of male patients, T3 and TSH levels were found to be negatively correlated with age but the relationship was not significant. Ertek et al., (2010) has also reported the similar findings44. Among the female patients, the most significant correlation was observed among Ni-Cr pair with an r-value of 0.943. The male patients also exhibited a significant correlation among these two metals with r-value of 0.750. Cr in both the male and female patients was observed to be significantly positively correlated with Pb but a significant positive correlation found between Ni –Fe and Cr-Fe pairs in female patients was lacking in male patients.
Pb and Co pairs in both male and female subjects were associated significantly positively with r-values of 0.867 and 0.607 respectively. In female patients, these metals were found to be significantly correlated with Fe but no such correlation was observed in male patients. Cr of the male patients was significantly positively correlated with T3 values, similarly, Co was found to be correlated with T4 while no such significant correlation was observed in female patients. TSH was significantly positively correlated with Ni in female patients but this correlation was not significant in male patients.
Table 1. Descriptive statistics for levels of trace metals and thyroid hormones in blood of patients of hyperthyroidism and healthy controls (n= 51).
| Age (year) | Fe (mg. L-1) | Co (mg. L-1) | Pb (mg. L-1) | Cr (mg. L-1) | Ni (mg. L-1) | T3 (ng. mL-1) | T4 (µg. d L-1) | TSH (mIU. L-1) | ||
| Patients (n=51) | Min. | 1 | 1.222 | 0.068 | 0.001 | 0.003 | 0.006 | 1.3 | 0.8 | 0.16 |
| Max. | 50 | 13.82 | 0.64 | 0.9 | 0.37 | 0.62 | 403 | 149 | 7.3 | |
| Mean | 33 | 1.019 | 0.33 | 0.35 | 0.195 | 0.329 | 125 | 11.97 | 2.143 | |
| S.D. | 11.93 | 185.6 | 20.52 | 24.56 | 10.88 | 18.29 | 125 | 24.42 | 1.577 | |
| S.E. | 1.639 | 25.5 | 2.819 | 3.373 | 1.494 | 2.512 | 17.17 | 3.354 | 0.221 | |
| Controls (n=51) | Min. | 1 | 0.565 | 0.003 | 0.196 | 0.002 | 0.003 | 0.96 | 7.13 | 1.71 |
| Max. | 50 | 1.185 | 0.165 | 0.394 | 0.05 | 0.48 | 2.13 | 9.51 | 12.33 | |
| Mean | 32.5 | 0.673 | 0.084 | 0.295 | 0.026 | 0.031 | 1.437 | 8.32 | 5.021 | |
| S.D. | 11.84 | 0.187 | 0.034 | 0.038 | 0.013 | 0.065 | 0.268 | 0.584 | 0.188 | |
| S. E. | 1.658 | 0.026 | 0.005 | 0.005 | 0.002 | 0.009 | 0.037 | 0.082 | 0.026 |
Table 2. Correlation coefficient matrix for levels of trace metals and thyroid hormones in blood of patients of hyperthyroidism (n= 51).
| Age | Fe | Co | Pb | Cr | Ni | T3 | T4 | ||
| Patients | Fe | -0.049 | |||||||
| Co | -0.036 | 0.156 | |||||||
| Pb | 0.105 | 0.219 | 0.687 | ||||||
| Cr | -0.091 | 0.107 | 0.527 | 0.730 | |||||
| Ni | 0.116 | 0.154 | 0.613 | 0.798 | 0.867 | ||||
| T3 | -0.348 | 0.124 | -0.041 | -0.112 | 0.029 | 0.001 | |||
| T4 | 0.165 | -0.015 | -0.030 | -0.125 | 0.052 | 0.158 | -0.157 | ||
| TSH | -0.076 | -0.072 | 0.242 | 0.169 | 0.151 | 0.225 | -0.239 | 0.095 | |
| Healthy donors | Fe | 0.150 | |||||||
| Co | -0.058 | -0.221 | |||||||
| Pb | 0.068 | -0.347 | 0.065 | ||||||
| Cr | 0.048 | 0.151 | -0.097 | -0.105 | |||||
| Ni | -0.221 | -0.166 | -0.109 | 0.159 | 0.135 | ||||
| T3 | 0.125 | 0.098 | 0.142 | -0.202 | 0.024 | -0.003 | |||
| T4 | -0.159 | -0.173 | 0.241 | 0.106 | -0.180 | -0.165 | -0.136 | ||
| TSH | -0.157 | -0.184 | -0.023 | 0.172 | 0.161 | 0.206 | -0.356 | 0.102 | |
Bod values are significant at p ≤ 0.05.
Table 3. Age based distribution of trace metals and thyroid hormones in patients of hyperthyroidism (n=51).
| Age | Fe | Co | Pb | Cr | Ni | T3 | T4 | TSH | ||
| Years | (mg. L-1) | (ng. mL-1) | (µg. d L-1) | (mIU. L-1) | ||||||
| Group I (11-20 years) n=6 | Min. | 11.00 | 0.340 | 0.068 | 0.001 | 0.090 | 0.140 | 113.0 | 4.400 | 0.890 |
| Max. | 20.00 | 0.990 | 0.620 | 0.660 | 0.370 | 0.560 | 237.0 | 10.60 | 4.07 | |
| Mean | 13.42 | 0.618 | 0.362 | 0.288 | 0.206 | 0.257 | 196.5 | 8.423 | 1.955 | |
| S.D. | 6.859 | 26.53 | 28.05 | 21.77 | 11.79 | 15.56 | 49.05 | 2.513 | 1.138 | |
| S.E. | 2.800 | 10.83 | 11.45 | 8.889 | 4.814 | 6.353 | 20.03 | 1.026 | 0.465 | |
| Group II (21-30 years) n=20 | Min. | 22 | 0.122 | 0.07 | 0.076 | 0.033 | 0.06 | 1.3 | 0.8 | 0.4 |
| Max. | 30 | 2.11 | 0.64 | 0.72 | 0.36 | 0.61 | 403 | 87.2 | 7.3 | |
| Mean | 26.5 | 0.850 | 0.383 | 0.405 | 0.212 | 0.358 | 177.7 | 10.28 | 2.436 | |
| S.D. | 2.140 | 56.02 | 21.33 | 24.47 | 11.84 | 20.92 | 144.5 | 18.41 | 1.863 | |
| S.E. | 0.478 | 12.53 | 4.769 | 5.471 | 2.647 | 4.679 | 32.32 | 4.117 | 0.427 | |
| Group III (31-40 years) n=12 | Min. | 31.0 | 0.221 | 0.130 | 0.015 | 0.0385 | 0.155 | 1.900 | 1.200 | 0.427 |
| Max. | 40.0 | 1.290 | 0.630 | 0.680 | 0.350 | 0.580 | 327.0 | 17.80 | 2.9 | |
| Mean | 35.67 | 0.831 | 0.322 | 0.357 | 0.215 | 0.374 | 106 | 5.473 | 1.541 | |
| S.D. | 3.143 | 38.64 | 18.21 | 24.83 | 10.69 | 17.38 | 123.5 | 4.763 | 0.826 | |
| S. E. | 0.907 | 11.16 | 5.258 | 7.168 | 3.086 | 5.016 | 35.65 | 1.375 | 0.238 | |
| Group IV (41-50 years) n=13 | Min. | 41.0 | 0.235 | 0.070 | 0.0150 | 0.043 | 0.091 | 1.800 | 1.200 | 0.160 |
| Max. | 50.0 | 1.120 | 0.600 | 0.670 | 0.360 | 0.540 | 245.0 | 149.0 | 5.4 | |
| Mean | 44.9 | 0.563 | 0.207 | 0.245 | 0.145 | 0.261 | 59.82 | 23.07 | 2.435 | |
| S.D. | 3.499 | 28.62 | 14.42 | 19.16 | 8.641 | 13.57 | 90.63 | 42.75 | 1.813 | |
| S.E. | 0.970 | 7.937 | 3.998 | 5.314 | 2.396 | 3.762 | 25.137 | 11.857 | 0.503 | |
Table 4. Correlation coefficient matrix* for metals and thyroid hormones in the patients of various age groups (n=51).
| Age | Fe | Co | Pb | Cr | Ni | T3 | T4 | ||
| Group-I (11-20 years ) n=6 0.73 significant | Fe | 0.176 | |||||||
| Co | 0.833 | 0.086 | |||||||
| Pb | 0.498 | 0.629 | 0.687 | ||||||
| Cr | 0.012 | 0.972 | -0.086 | 0.568 | |||||
| Ni | 0.534 | 0.487 | 0.591 | 0.881 | 0.453 | ||||
| T3 | 0.450 | -0.348 | 0.803 | 0.477 | -0.444 | 0.479 | |||
| T4 | 0.065 | 0.583 | 0.071 | 0.222 | 0.460 | 0.213 | -0.166 | ||
| TSH | 0.415 | -0.441 | 0.356 | 0.053 | -0.412 | 0.048 | 0.383 | -0.879 | |
| Group II (21-30 years), n=20 | Fe | 0.114 | |||||||
| Co | 0.381 | 0.654 | |||||||
| Pb | 0.035 | 0.885 | 0.654 | ||||||
| Cr | -0.019 | 0.717 | 0.539 | 0.824 | |||||
| Ni | 0.008 | 0.768 | 0.590 | 0.893 | 0.902 | ||||
| T3 | -0.154 | 0.025 | -0.060 | 0.067 | 0.208 | 0.176 | |||
| T4 | -0.088 | 0.546 | 0.283 | 0.283 | 0.252 | 0.258 | -0.171 | ||
| TSH | -0.034 | -0.064 | 0.126 | 0.105 | 0.015 | 0.063 | -0.294 | -0.146 | |
| Group III (31-40 years), n=12 | Fe | -0.462 | |||||||
| Co | -0.542 | 0.742 | |||||||
| Pb | -0.368 | 0.917 | 0.828 | ||||||
| Cr | -0.236 | 0.680 | 0.751 | 0.688 | |||||
| Ni | -0.181 | 0.690 | 0.746 | 0.726 | 0.982 | ||||
| T3 | 0.650 | -0.251 | -0.412 | -0.300 | 0.104 | 0.191 | |||
| T4 | 0.612 | -0.407 | -0.368 | -0.270 | -0.294 | -0.141 | 0.667 | ||
| TSH | -0.474 | 0.102 | 0.242 | 0.168 | 0.048 | 0.030 | -0.433 | -0.337 | |
| Group IV (41-50 years), n=13 | Fe | -0.267 | |||||||
| Co | -0.113 | 0.564 | |||||||
| Pb | 0.070 | 0.643 | 0.459 | ||||||
| Cr | -0.174 | 0.644 | 0.645 | 0.617 | |||||
| Ni | 0.021 | 0.472 | 0.589 | 0.461 | 0.926 | ||||
| T3 | -0.311 | 0.183 | 0.135 | -0.338 | -0.164 | -0.235 | |||
| T4 | 0.336 | -0.313 | -0.241 | 0.038 | -0.293 | -0.103 | -0.266 | ||
| TSH | -0.189 | -0.306 | -0.110 | -0.131 | -0.077 | 0.088 | -0.156 | 0.525 |
*Bold values are significant at p ≤ 0.05.
Table 5. Basic statistics for various parameters of patients of various genders of hyperthyroidism (n = 51).
| Male Patients n=20 | Age | Fe | Co | Pb | Cr | Ni | T3 | T4 | TSH | ||||
| Years | (mg. L-1) | (ng. mL-1) | (µg.dL-1) | (mIU. L-1) | |||||||||
| Minimum | 11.00 | 0.274 | 0.068 | 0.015 | 0.043 | 0.091 | 1.800 | 1.200 | 0.160 | ||||
| Maximum | 50.00 | 13.82 | 0.640 | 0.900 | 0.370 | 0.620 | 327.0 | 87.20 | 5.500 | ||||
| Mean | 34.50 | 1.498 | 0.292 | 0.354 | 0.211 | 0.339 | 120 | 11.68 | 1.793 | ||||
| S.D. | 15.85 | 295.7 | 0.189 | 25.14 | 11.08 | 0.188 | 118.3 | 18.21 | 1.403 | ||||
| S.E. | 3.543 | 66.12 | 4.227 | 5.620 | 2.476 | 4.198 | 26.44 | 4.072 | 0.314 | ||||
| Female Patients n=31 | Minimum | 11.5 | 0.122 | 0.070 | 0.010 | 0.033 | 0.060 | 1.300 | 0.800 | 0.400 | |||
| Maximum | 50.0 | 1.700 | 0.630 | 0.720 | 0.360 | 0.610 | 403.0 | 149.0 | 7.3 | ||||
| Mean | 32.2 | 0.729 | 0.353 | 0.347 | 0.185 | 0.321 | 128.073 | 12.142 | 2.301 | ||||
| S.D. | 8.963 | 42.00 | 21.39 | 24.59 | 10.81 | 18.25 | 130.6 | 27.78 | 1.643 | ||||
| S.E. | 1.560 | 7.312 | 3.724 | 4.280 | 1.882 | 3.177 | 22.739 | 4.836 | 0.285 | ||||
Table 6. Correlation coefficient matrix* for metals and thyroid hormones in male and female patients of hyperthyroidism (n=51).
| Age | Fe | Co | Pb | Cr | Ni | T3 | T4 | TSH | ||||
| Male (n=20) | Age | 1 | -0.030 | -0.270 | -0.113 | 0.012 | 0.024 | -0.414 | 0.394 | -0.001 | Age | Female (n=31) |
| Fe | -0.084 | 1 | 0.512 | 0.872 | 0.816 | 0.809 | -0.078 | -0.282 | 0.135 | Fe | ||
| Co | 0.240 | 0.208 | 1 | 0.607 | 0.557 | 0.563 | -0.046 | -0.185 | 0.261 | Co | ||
| Pb | 0.314 | 0.159 | 0.867 | 1 | 0.880 | 0.865 | -0.115 | -0.295 | 0.238 | Pb | ||
| Cr | -0.217 | -0.051 | 0.552 | 0.499 | 1 | 0.943 | -0.174 | -0.021 | 0.241 | Cr | ||
| Ni | 0.201 | 0.054 | 0.749 | 0.693 | 0.750 | 1 | -0.205 | 0.115 | 0.307 | Ni | ||
| T3 | -0.317 | 0.258 | -0.046 | -0.105 | 0.408 | 0.375 | 1 | -0.153 | -0.333 | T3 | ||
| T4 | -0.113 | 0.072 | 0.411 | 0.294 | 0.242 | 0.280 | -0.176 | 1 | 0.102 | T4 | ||
| TSH | -0.339 | -0.192 | -0.032 | -0.014 | 0.107 | 0.140 | 0.060 | 0.088 | 1 | TSH |
*Bold values are significant at p ≤ 0.05.
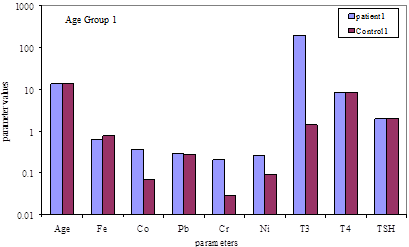
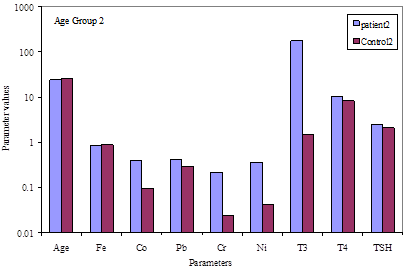
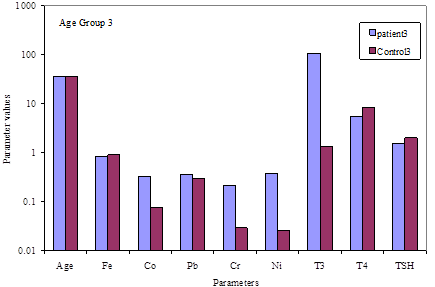
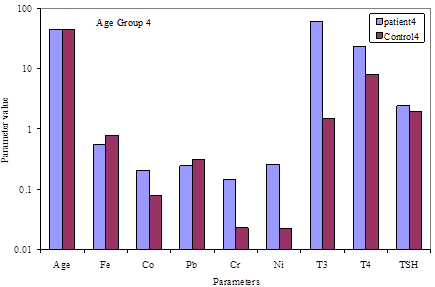
Fig. 1. Comparative distribution of various parameters in hyperthyroid patients and healthy donors of various age groups.
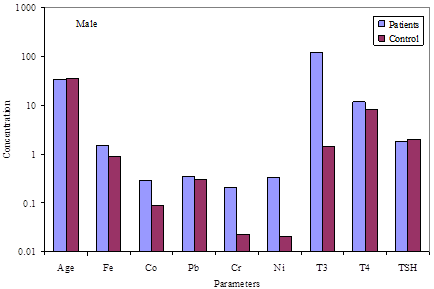
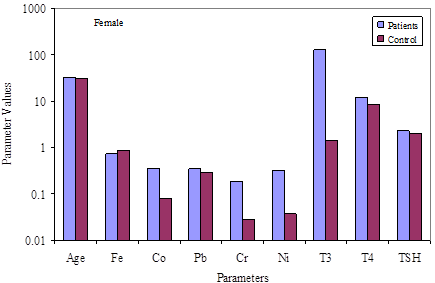
Fig. 2. Comparative distribution of various parameters in hyperthyroid patients and healthy donors of two genders.
4. Conclusions
The study evidenced that under the conditions of hyperthyroidism, not only the levels of thyroid hormones were disturbed, but also the concentrations of trace metals were enhanced. Moreover, all the metals exhibited an increasing trend with the increasing age of patients at least up to 30 years with the exception of Ni. In all the age groups, Fe and Cr were found to be strongly positively correlated. Most interestingly, Co and Fe were found to be significantly positively correlated with T3 and T4 in age groups I and II respectively. A strong positive correlation was also observed between Co and age of the patients in age group 11-20 years while in elderly patients corresponding to age group 31-40 years a significant negative correlation was prevalent. Gender based studies revealed higher mean values of all the three hormones i.e. T3, T4 and TSH in female patients than in male patients, while a reverse situation was observed for the mean metal levels.
References
- Virtanen J.K., Rissanen T.H., Voutilainen S., Tuomainen T.P. Mercury as a risk factor for cardiovascular diseases.J Nut Biochem. 2007; (18): 75-85.
- Whitnall M., Richardson D.R. Iron: A. New Target for Pharmacological Intervention in Neurodegenerative Diseases.Seminars in Pediatric Neurology. 2006; (13):186-197.
- Andreali T.E., Carpenter C.C.1., Bannet 1.C., Cecil P.F., Textbook of Medicine, 4th Edition. Philadelphia: W.B. Saunder & Co; 1997; p. 952–3.
- Ahmed O. M., El-Gareib A.W., Bakery A., Abd Al Tawab S. M., Ahmed A., Thyroid hormones states and brain development interactions. Int J Dev Neurosci, 2007; 26(2): 147-209.
- Pearce EN, Braverman LE. Environmental pollutants and the thyroid. Best Pract Res Clin Endocrinol Metab.2009; 23(6): 801–813.
- Beckett G.J., Arthur J.R. Selenium and endocrine systems. J Endocrinol. 2005; (184):455–65.
- Thomson A.M., Rogers J.T., Leedman P.J., Review, Iron-regulatory proteins, iron- responsive elements and ferritin mRNA translation. The Intl J. Biochem. & Cell Biol. 1999; 31: 1139-1152.
- Adair B.M., Cobb G.P. Improved preparation of small biological samples for mercury analysis using cold vapor atomic absorption spectroscopy.Chemosphere. 1999; (38): 2951-2958.
- Błażewicz A., Dolliver W., Sivsammye S., Deol A., Randhawa R., Orlicz-Szczęsna G., Błażewicz R. Determination of Cd, Co, Cu, Fe, Mn and Zn in thyroid glands of patients with diagnosed nodular goiter using ion chromatography.J Chromat B. 2010; (878): 34-38.
- Li Q.R., Liao R.Q., Su S.H., Huang S.H., Pan R.H., Huang J.L., Effect of Pb on thyroid function of occupationally exposed workers. Zhonghua Lao Dong Wei Sheng Zhi Ye Bing Za Zhi 2003; (212): 111-3.
- Bigazzi P.E., Autoimmunity and heavy metals,Lupus, 1994; 3(6): 449-53.
- Osius N., Karmaus W., Kruse H., Witten I., Exposure to polychlorinated biphenyls and levels of thyroid hormones in children. Environ Health Perspect. 1999; 107(10): 843-849.
- Chen A., Kim S.S., Chung E., Dietrich K.N., Thyroid hormones in relation to lead, mercury and cadmium exposures in the national health and nutrition survey, 2007-2008, Environ Health Perspect. 2013; 121(2): 181–186.
- Hammouda F., Messaoudi I., El-Hani J., Baati T., Saïd K., Kerkeni A., Reversal of cadmium-induced thyroid dysfunction by selenium, zinc, or their combination in rat.Biol Trace Elem Res.2008; 126(1-3):194-203.
- Abdelouahab, N.; Mergler, D.; Takser, L.; Vanier, C.; St-Jean, M.; Baldwin, M.; Spear, P.A.; Chan, H.M.Gender differences in the effects of organochlorines, mercury, and lead on thyroid hormone levels in lakeside communities of Quebec (Canada)Environ Res. 2008; 107(3): 380-392.
- Liang Q.R., Liao R.Q., Su S.H., Huang S.H., Pan R.H., Huang J.L., Effects of lead on thyroid function of occupationally exposed workers.Zhonghua Lao Dong Wei Sheng Zhi Ye Bing Za Zhi.2003; 21(2):111-3.
- Bledsoe M. L., Pinkerton L. E., Silver S., Deddens J. A. and Biagini R. E., Thyroxine and Free Thyroxine Levels in Workers Occupationally Exposed to Inorganic Lead, Environ Health Insights. 2011; 5 55–61.
- Gallagher, C.M. and Meliker J.R., Mercury and thyroid autoantibodies in U.S. women, NHANES 2007-2008.Environ. Intl. 2012; 40: 39-43.
- Soldin O.P., O'Mara D.M., Aschner M. Thyroid hormones and methylmercury toxicity.Biol Trace Elem Res.2008; 126(1-3):1-12.
- Ciarrocca M., Tomei F., Caciari T., Cetica C., Andrè J.C., Fiaschetti M., Schifano M.P., Scala B., Scimitto L., Tomei G., Sancini A., Exposure to arsenic in urban and rural areas and effects on thyroid hormonesInhal Toxicol.2012; 24(9):589-98.
- Davey J. C., Nomikos A. P., Wungjiranirun M., Sherman J. R., Ingram L., Batki C., Lariviere J. P., Hamilton J. W., Environ Health Perspect. 2008; 116(2): 165–172.
- Kazi T.G., Afridi H.I., Kazi N., Jamali M.K., Arain M.B., Sarfraz R.A. et al., Distribution of Zn, Cu & Fe in biological samples of Pakistani myocardial infarction (1st, 2nd and 3rd heart attack) patients and controls.Clinic Chim Acta. 2008; (389): 114-119.
- . Kim K.M. Hair Fe and other mineral levels in breast cancerpatients.Biol. Trace Elem Res. 2009; (129): 28–35.
- Parizadeh S.M., Moohebati M., Ghafoori M.F. Ghayour-Mobarhan M., Kazemi-Bajestani S.M., Tavallaie S. Serum selenium and glutathione peroxidase concentrations in Iranian patients with angiography-defined coronary artery disease. Angiology. 2009; (60):186–191.
- Sayre L.M., Moreira P.I., Smith M.A., Perry G. Ions and oxidative protein modification in neurological disease. Ann Ist Super Sanita. 2005; (41): 143–164.
- Yuan X.M., Li W. Iron involvement in multiple signaling pathways of atherosclerosis: a revisited hypothesis. Curr Med Chem. 2008; (15): 2157–2172.
- Holland N.T., Smith M.T., Eskenazi B. Biological sample collection and processing for molecular epidemiological studies.Mutat Res.2003; (543):217–3.
- Sadat A.F.M. N., Hussain M. I., Serum Trace Elements and Immunoglobin Profile in lung cancer patients. J Appl Res. 2008; (8): 24-33.
- Caporaso N., Vaught J. Collection, processing, and analysis of preneoplastic specimens. In: Franco EL, Rohan TE, editors. Cancer precursors: epidemiology, detection, and prevention. New York: Springer-Verlag 2002; 33–45.
- Sansoni B., Panday V.K., Sample treatment of human biological materials, In: Herber RFM, Stoeppler M., editors, Trace element Analysis in biological samples. Amsterdam; Elsevier Sciences 1994; p. 21-52.
- Alonso M.L., Montana F.P., Miranda M., Castillo C., Hernandez T., Bendito J.C., Interactions between toxic (As, Cd, Hg and Pb) and nutritional essential (Ca, Co, Cr, Cu, Fe, Mn, Mo, Ni, Se, Zn) elements in the tissues of cattle from NW Spain. Bio Metals. 2004; (17): 389-397.
- Shashi A., Kaur V., Sharma N. Thyroid disorders: Prevalence and clinical relevance, Asian J Microbiol, Biotech & Environ Sci. 2009; (11): 819-824.
- Beard J.L., Green W., Miller L., Finch C., Effects of iron deficiency anemia on hormone levels and thermoregulation during acute cold exposure. Am J Physiol. 1984; (247): R114-R119.
- Glusker J.P., Katz A.K., Bock C.W. Metal ions in biological systems, Rigaku J. 1999; (16): 8-17.
- Silva J.J.R.F.D., Williams R.J.P. The Biological Chemistry of the Elements, Clarendon Press: Oxford. 1991.
- Ahmed Z., Khan M.A., Haq A. Effect of race, gender and age on thyroid and thyroid stimulating hormone levels in NWFP, Pakistan. J Ayub Med Coll Abbottabad. 2009; (21): 21-24.
- Rodionov D.A., Vitreschak A.G., Mironov A.A., Gelfand M. S., Comparative Genomics of the Vitamin B12 Metabolism and Regulation in Prokaryotes. J Biol Chem. 2003; (27842): 41148-41159.
- Cammack R.,Nickel in metalloproteins. Ads Inorg Chem. 1988; (32), 297-333.
- Muslim S., Khalil Z. Effect of Age, Sex, Salt, Water and Climate on T3, T4 and TSH in Healthy Individuals, Deptt Zool Peshawar University 2000.
- Nissinen A., Kivelä S.L., Pekkanen J., et al., Thyroid function tests in elderly Finnish men. Acta Med Scand 1986; 220: 63–9.
- Dundar B., Oktem F., Arslan M.K., Delibas N., Baykal B., Arslan C., et al., The effect of long-term low-dose lead exposure on thyroid function in adolescents. Environ Res 2006; (101): 140-145.
- Hasan H. G., J. Mahmood T., Ismael P. A., Studies on the Relationship Between Chromium(III) ion and Thyroid Peroxidase Activity in Seran of Patients with Thyroid Dysfunction, Ibn Al- Haitham J. For Pure & Appl. Sci. 2011. 24 (2).
- Sack J., Bar-On Z., Shemesh J., Becker R. Serum T4, T3 and TBG concentrations during puberty in males. Eur J Pediatr. 1982; (138): 136–7.
- Ertek S., Cicero A. F. G., Caglar O., Erdogan G., Relationship between serum zinc levels, thyroid hormones and thyroid volume following successful iodine supplementation, Hormones, 2010, 9(3): 263-268.


