
International Journal of Chemical and Biomolecular Science, Vol. 1, No. 3, October 2015 Publish Date: Sep. 1, 2015 Pages: 179-184
Ontology Similarity Measuring and Ontology Mapping Algorithms Via Graph Semi-Supervised Learning
Yun Gao1, *, Li Liang2, Wei Gao2
1Department of Editorial, Yunnan Normal University, Kunming, China
2School of Information Science and Technology, Yunnan Normal University, Kunming, China
Abstract
Ontology similarity calculation is important research topics in information retrieval and widely used in biology and chemical. By analyzing the technology of semi-supervised learning, we propose the new algorithm for ontology similarity measure and ontology mapping. The ontology function is obtained by learning the ontology sample data which is consisting of labeled and unlabeled ontology data. Via the ontology semi-supervised learning, the ontology graph is mapped into a line consists of real numbers. The similarity between two concepts then can be measured by comparing the difference between their corresponding real numbers. The experiment results show that the proposed new algorithm has high accuracy and efficiency on ontology similarity calculation and ontology mapping.
Keywords
Ontology, Similarity Measure, Ontology Mapping, Semi-Supervised Learning
Received: August 3, 2015
Accepted: August 26, 2015
Published online: September 2, 2015
@ 2015 The Authors. Published by American Institute of Science. This Open Access article is under the CC BY-NC license. http://creativecommons.org/licenses/by-nc/4.0/
1. Introduction
As a conceptual shared and knowledge representation model, ontology has been used in knowledge management, image retrieval and information retrieval search extension. Furthermore, acted as an effective concept semantic model, ontology is employed in other fields except computer science, including medical science, social science, pharmacology science, geography science and biology science (see Przydzial et al., [1], Koehler et al., [2], Ivanovic and Budimac [3], Hristoskova et al., [4], and Kabir et al., [5] for more detail).
The ontology model is a graph G=(V,E) such that each vertex v expresses a concept and each directed edge e=vivj denote a relationship between concepts vi and vj. The aim of ontology similarity measure is to get a similarity function Sim: V×V ![]()
![]() U {0} such that each pair of vertices is mapped to a non-negative real number. Moreover, the aim of ontology mapping is to obtain the link between two or more ontologies. In more applications, the key of ontology mapping is to get a similarity function S to determine the similarity between vertices from different ontologies.
U {0} such that each pair of vertices is mapped to a non-negative real number. Moreover, the aim of ontology mapping is to obtain the link between two or more ontologies. In more applications, the key of ontology mapping is to get a similarity function S to determine the similarity between vertices from different ontologies.
In recent years, ontology similarity-based technologies were employed in many applications. By virtue of technology for stable semantic measurement, a graph derivation representation based trick for stable semantic measurement is presented by Ma et al., [6]. Li et al., [7] determined an ontology representation method which can be used in online shopping customer knowledge with enterprise information. A creative ontology matching system is proposed by Santodomingo et al., [8] such that the complex correspondences are deduced by processing expert knowledge with external domain ontologies and in view of novel matching technologies. The main features of the food ontology and several examples of application for traceability aims is reported by Pizzuti et al., [9]. Lasierra et al., [10] pointed out that ontologies can be employed in designing an architecture for taking care of patients at home. More ontology learning algorithms can refer to [11-22].
In this paper, we present the new ontology similarity computation and ontology mapping algorithms relied on the semi-supervised learning which was proposed in Zhang et al., [23]. The basic idea of such learning approach is intending to fully use the unlabeled ontology data in the learning processing. In terms of the ontology function, the ontology graph is mapped into a real line and vertices are mapped into real numbers. Then the similarity between vertices is measured by the difference between their corresponding real numbers.
2. Main Ontology Algorithms
Let V be an instance space. For any vertex in ontology graph G, its information (including its attribute, instance, structure, name and semantic information of the concept which is corresponding to the vertex and that is contained in its vector) is denoted by a vector with p dimension. Let v=![]() be a vector which is corresponding to a vertex v. For facilitating the expression, we slightly confuse the notations and denote v both the ontology vertex and its corresponding vector. The purpose of ontology learning algorithms is to get an optimal ontology function f: V
be a vector which is corresponding to a vertex v. For facilitating the expression, we slightly confuse the notations and denote v both the ontology vertex and its corresponding vector. The purpose of ontology learning algorithms is to get an optimal ontology function f: V![]()
![]() , then the similarity between two vertices is determined by the difference between two real numbers which they correspond to. The essence of such algorithm is dimensionality reduction, that is to say, use one dimension vector to represent p dimension vector. From this point of view, an ontology function f can be regarded as a dimensionality reduction map f:
, then the similarity between two vertices is determined by the difference between two real numbers which they correspond to. The essence of such algorithm is dimensionality reduction, that is to say, use one dimension vector to represent p dimension vector. From this point of view, an ontology function f can be regarded as a dimensionality reduction map f: ![]()
![]()
![]() .
.
Let ![]() be a positive semi-definite kernel function and K be the
be a positive semi-definite kernel function and K be the ![]() kernel matrix with
kernel matrix with ![]() =
=![]() . The ontology graph Laplacian matrix is defined as
. The ontology graph Laplacian matrix is defined as ![]() =
=![]() such that D
such that D![]()
![]() is a diagonal degree matrix with
is a diagonal degree matrix with ![]() =
=![]() , and the normalized version of ontology graph Laplacian is denoted by
, and the normalized version of ontology graph Laplacian is denoted by ![]() =
=![]() , where I is the identity matrix. Assume that a prediction ontology function
, where I is the identity matrix. Assume that a prediction ontology function ![]() is evaluated on ontology data set
is evaluated on ontology data set ![]() , and the prediction is expressed as
, and the prediction is expressed as ![]()
![]()
![]() with
with ![]() =
=![]() . The smoothness of ontology function
. The smoothness of ontology function ![]() with regard to the ontology graph is formulated by
with regard to the ontology graph is formulated by
![]() =
=![]() .
.
Its minimization is called the Laplacian regularization. For fixed labeled ontology data ![]() and unlabeled ontology data
and unlabeled ontology data ![]() with u=n-l. Let
with u=n-l. Let ![]() be the Reproducing Kernel Hilbert Space norm of the prediction ontology function,
be the Reproducing Kernel Hilbert Space norm of the prediction ontology function, ![]() be the associated balance parameter, and
be the associated balance parameter, and ![]() be the balance parameter for the smoothness. In terms of an ontology loss function
be the balance parameter for the smoothness. In terms of an ontology loss function![]() , the Laplacian regularized semi-supervised learning in ontology setting can be denoted by
, the Laplacian regularized semi-supervised learning in ontology setting can be denoted by ![]() According to representer theorem, the minimizer of this optimization ontology problem has the following form:
According to representer theorem, the minimizer of this optimization ontology problem has the following form:
![]() =
=![]()
where ![]() are called the kernel expansion coefficients.
are called the kernel expansion coefficients.
Given an ontology data ![]() and
and ![]() , then kernel matrix K, degree matrix D, the ontology graph Laplacian L and normalized graph Laplacian
, then kernel matrix K, degree matrix D, the ontology graph Laplacian L and normalized graph Laplacian ![]() are determined. In what follows, we define
are determined. In what follows, we define ![]() =
=![]()
![]()
![]() as the rows in the kernel matrix corresponding to the labeled samples, where
as the rows in the kernel matrix corresponding to the labeled samples, where![]() =
=![]() .
.
By virtue of representer theorem, we have![]() =
=![]() with kernel expansion coefficient
with kernel expansion coefficient ![]()
![]()
![]() . The above ontology problem can be rewritten as
. The above ontology problem can be rewritten as ![]() with
with ![]()
![]()
![]() is the labels of the labeled ontology samples. Let Q=
is the labels of the labeled ontology samples. Let Q= ![]() and c=
and c=![]() . Then, the objective ontology function can be further denoted equivalently as
. Then, the objective ontology function can be further denoted equivalently as
![]() . (1)
. (1)
In our article, we use low-rank approximation of symmetric, positive semi-definite matrices ![]()
![]()
![]() such that
such that
![]()
![]()
![]() ,
, ![]()
![]()
![]() ,
, ![]() . (2)
. (2)
Here ![]() is the rank-m approximation of matric
is the rank-m approximation of matric![]() . For an
. For an ![]() kernel matrix, we selects a collection of m rows (or columns)
kernel matrix, we selects a collection of m rows (or columns) ![]()
![]()
![]() , calculate an eigenvalue decomposition on the intersection of given rows and columns
, calculate an eigenvalue decomposition on the intersection of given rows and columns![]()
![]()
![]() , and thus approximate the kernel matrix as
, and thus approximate the kernel matrix as
![]()
![]()
![]() .
.
Hence, the kernel matrix can be expressed in the following form
![]()
![]()
![]() ,
, ![]() =
=![]() .
.
Let ![]() =
=![]() . The Hessian matrix (1) can be formulated by
. The Hessian matrix (1) can be formulated by
Q=![]()
=![]()
=![]()
Let P=![]() ,
, ![]() =
=![]() . Therefore, it has a multiplicative form:
. Therefore, it has a multiplicative form:
Q=![]() .
.
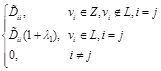
We emphasize that the degree matrix D can be approximated by
D![]()
![]() . (3)
. (3)
For given l labeled ontology samples and m landmark ontology vertices, with l<m. Then the landmark vertex set Z are selected from two parts: (i) the labeled ontology samples; (ii) a set of unlabeled vertices by the conventional sampling plan. For deduced m land mark vertices Z, and approximate the kernel matrix K. Let E=![]() , W=
, W=![]() and
and
![]() =
= . (4)
. (4)
Then both P and ![]() in the matrix Q can be determined by
in the matrix Q can be determined by
D![]()
![]()
![]() =
=![]() . (5)
. (5)
In view of (3) and (4), the matrix can be decomposed into a low-rank factorization form as
D![]()
![]()
F=![]() . (6)
. (6)
Assume that the matrix Q in (1) is positive definite and has the eigenvalue decomposition
Q=![]() . (7)
. (7)
Then the ontology problem in (1) is equivalent to the following regression:
![]() (8)
(8)
in that they have the same objective value given the same variable ![]() . Here,
. Here, ![]() is a constant independent of any variables, and
is a constant independent of any variables, and
A=![]() , b=
, b=![]() . (9)
. (9)
For determined (5), the top m eigenvectors of Q can be approximated as follows. Compute the eigenvalue decomposition of the ![]() matrix
matrix ![]() =
=![]() ¼. Then the eigenvalue and eigenvectors of Q can be approximated by
¼. Then the eigenvalue and eigenvectors of Q can be approximated by
![]() =
=![]() (10)
(10)
and
![]() =
=![]() . (11)
. (11)
The whole ontology algorithm is presented in Algorithm 1.
Algorithm 1. Given l labeled ontology samples, u unlabeled ontology samples, landmark size m, output model coefficients ![]()
Step 1: Select the landmark set Z by using labeled ontology samples and m-l unlabeled samples.
Step 2: Determine ![]() ,
, ![]() (2) and
(2) and ![]() (3).
(3).
Step 3: Get low-rank form of Q by (4), (5), and (6).
Step 4: Use (10) and (11) for approximate eigenvectors of Q.
Step 5: Transform (1) by (7), (8) and (9).
Step 6: Use sparse solver to obtain optimal coefficients ![]() . Thus get the ontology function.
. Thus get the ontology function.
Step 7: Determine the similarity between two vertices ![]() and
and ![]() according to the value of
according to the value of ![]() .
.
3. Experiments
Two simulation experiments on ontology similarity measure and ontology mapping are designed in this section. We perform our experiments on a Windows 7 machine with 8GB RAM. And, we implement our algorithm using C++.
3.1. Ontology Similarity Measuring on Biology Data
The "Go" ontology O1 was constructed by http: //www. geneontology. org. (Fig. 1 presents the graph structure of O1). We use P@N (defined by Craswell and Hawking [24]) to determine the equality of the experiment result.
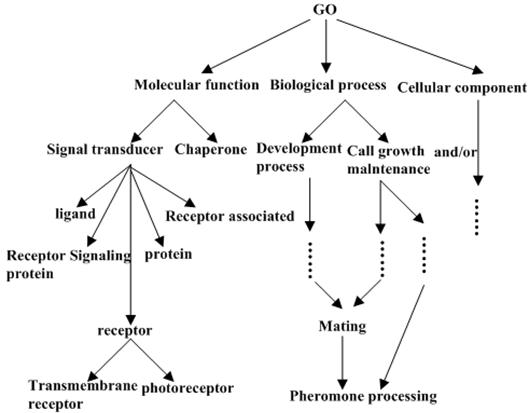
Figure 1. "Go" ontology.
The experiment shows that, P@3 Precision Ratio is 34.54%, P@5 Precision Ratio is 42.19%, P@10 Precision Ratio is 51.58%, P@20 Precision Ratio is 62.66%. Thus the algorithm have high efficient.
3.2 Ontology Mapping on Chemical Data
For our second experiment, we use "Chemical Index" ontologies O2 and O3 (part of the graph structures of O2 and O3 are presented in Fig. 2 and Fig. 3 respectively). Note that the Figure 2 and Figure 3 only show the part of vertices on O2 and O3. Actually, the number of vertex on O2 is 24, and the number of vertex on O3 is 17. The purpose of this experiment is to construct the ontology mapping between O2 and O3. Again, P@N criterion is applied to measure the equality of the experiment results.
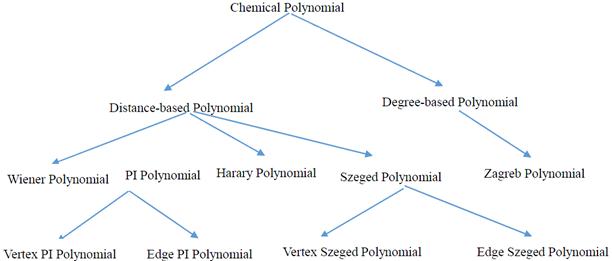
Figure 2. "Chemical Index" Ontology O2.
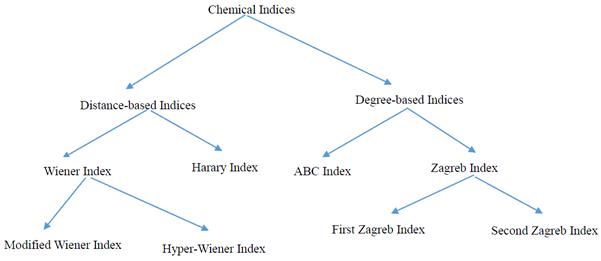
Figure 3. "Chemical Index" Ontology O3.
The experiment shows that, P@1 Precision Ratio is 31.71%, P@3 Precision Ratio is 44.72%, P@5 Precision Ratio is 60.00%. Thus the algorithm have high efficient.
4. Conclusions
Ontology, as a data representation model, has been widely used in various fields and proved to have a high efficiency. The core of ontology algorithm is to get the similarity measure between vertices on ontology graph. One learning trick is mapping each vertex to a real number, and the similarity is judged by the difference between the real number which the vertices correspond to.
In our article, a new algorithm for ontology similarity measure and ontology mapping application is presented by virtue of semi-supervised learning method. Furthermore, experiment results reveal that our new algorithm has high efficiency in both biology and chemical index data. The ontology algorithm presented in our paper illustrates the promising application prospects for ontology use.
Acknowledgment
We thank the reviewers for their constructive comments in improving the quality of this paper. The research is financed by: NSFC (No.11401519).
References
- J. M. Przydzial, B. Bhhatarai, and A. Koleti, GPCR ontology: development and application of a G protein-coupled receptor pharmacology knowledge framework. Bioinformatics, 29(24) (2013) 3211-3219.
- S. Koehler, S. C. Doelken, and C. J. Mungall, The human phenotype ontology project: linking molecular biology and disease through phenotype data. Nucleic Acids Research, 42(D1)(2014) 966-974.
- M. Ivanovic and Z. Budimac, An overview of ontologies and data resources in medical domains. Expert Systerms and Applications, 41(11)(2014) 5158-15166.
- A. Hristoskova, V. Sakkalis, and G. Zacharioudakis, Ontology-driven monitoring of patient's vital signs enabling personalized medical detection and alert. Sensors, 14(1)(2014) 1598-1628.
- M. A. Kabir, J. Han, and J. Yu, User-centric social context information management: an ontology-based approach and platform. Personal and Ubiquitous Computing, 18(3)(2014) 1061-1083.
- Y. L. Ma, L. Liu, K. Lu, B. H. Jin, and X. J. Liu, A graph derivation based approach for measuring and comparing structural semantics of ontologies. IEEE Transactions on Knowledge and Data Engineering, 26(3)(2014) 1039-1052.
- Z. Li, H. S. Guo, Y. S. Yuan, and L. B. Sun, Ontology representation of online shopping customers knowledge in enterprise information. Applied Mechanics and Materials, 483(2014) 603-606.
- R. Santodomingo, S., Rohjans, M. Uslar, J. A. Rodriguez-Mondejar, and M.A. Sanz-Bobi, Ontology matching system for future energy smart grids. Engineering Applications of Artificial Intelligence, 32(2014) 242-257.
- T. Pizzuti, G. Mirabelli, M. A. Sanz-Bobi, and F. Gomez-Gonzalez, Food Track & Trace ontology for helping the food traceability control. Journal of Food Engineering, 120(1)(2014) 17-30.
- N. Lasierra, A. Alesanco, and J. Garcia, Designing an architecture for monitoring patients at home: Ontologies and web services for clinical and technical management integration. IEEE Journal of Biomedical and Health Informatics, 18(3)(2014) 896-906.
- Y. Y.Wang,W.Gao, Y. G.Zhang,and Y.Gao,Ontology similarity computation use ranking learning Method.The 3rd International Conference on Computational Intelligence and Industrial Application,Wuhan, China, 2010, pp.20-22.
- X.Huang,T. W.Xu,W.Gao,and Z. Y.Jia,Ontology similarity measure and ontology mapping via fast ranking method.International Journal of Applied Physics and Mathematics, 1(2011)54-59.
- W.Gao, and L.Liang,Ontology similarity measure by optimizing NDCG measure and application in physics education.Future Communication, Computing, Control and Management,142(2011)415-421.
- Y.Gao,and W.Gao,Ontology similarity measure and ontology mapping via learning optimization similarity function.International Journal of Machine Learning and Computing,2(2)(2012)107-112.
- X.Huang,T. W.Xu,W.Gao,and S.Gong,Ontology similarity measure and ontology mapping using half transductive ranking.In Proceedings of 2011 4th IEEE international conference on computer science and Information technology, Chengdu, China,2011, pp.571-574.
- W. Gao, Y. Gao, and L. Liang, Diffusion and harmonic analysis on hypergraph and application in ontology similarity measure and ontology mapping. Journal of Chemical and Pharmaceutical Research,5(9)(2013) 592-598.
- W. Gao and L. Shi, Ontology similarity measure algorithm with operational cost and application in biology science. BioTechnology: An Indian Journal, 8(11)(2013) 1572-1577.
- W. Gao and T. W. Xu, Ontology similarity measuring and ontology mapping algorithm based on MEE criterion. Energy Education Science and Technology Part A: Energy Science and Research, 32(3)(2014) 3793-3806
- W.Gao, Y. Gao, and Y. G. Zhang,Strong and weak stability of k-partite ranking algorithm.Information,15(11A)(2012)4585-4590.
- W.Gaoand T. W. Xu, Stability analysis of learning algorithms for ontology similarity computation.Abstract and Applied Analysis,2013, 9 pages,http://dx.doi.org/10.1155/2013/174802.
- W. Gao and L. L. Zhu, Gradient learning algorithms for ontology computing. Computational Intelligence and Neuroscience, 2014, 12 pages, http://dx.doi.org/10.1155/2014/438291.
- W. Gao, L. Yan, and L. Liang, Piecewise function approximation and vertex partitioning schemes for multi-dividing ontology algorithm in AUC criterion setting (I). International Journal of Computer Applications in Technology, 50 (3/4)(2014) 226-231.
- K. Zhang, Q. J. Wang, L. Lan, Y. Sun, I. Marsic, Sparse semi-supervised learning on low-rank kernel, Neurocomputing, 129(2014) 265–272.
- N. Craswell and D. Hawking, Overview of the TREC 2003 web track. Proceeding of the Twelfth Text Retrieval Conference, Gaithersburg, Maryland, NIST Special Publication, 2003, pp. 78-92.


