
International Journal of Chemical and Biomolecular Science, Vol. 1, No. 3, October 2015 Publish Date: Sep. 9, 2015 Pages: 193-196
Fatty Acid Profile Composition of Chicken Skin
Lilia L. Méndez-Lagunas1, *, Samuel Siles-Alvarado2, Juan Rodríguez-Ramírez1, Laura A. Aquino-González1
1Instituto Politécnico Nacional, Centro Interdisciplinario de Investigación Para el Desarrollo Integral Regional, Oaxaca, México
2Instituto Politécnico Nacional, Escuela Superior de Ingeniería Química e Industrias Extractivas, Distrito Federal, México
Abstract
Chicken is one of the most consumed protein source worldwide. In recent years, commercial presentations of poultry meat have had the skin removed with the intent of reducing fat intake. This work evaluates the fatty acid (FA) composition in subcutaneous adipose chicken tissue and cholesterol content using GC-MS and enzymatic method, respectively. A total of 11 FA were identified: 8 saturated and 3 monounsaturated fatty acids. Oleic, palmitic, palmitoleic and stearic acids are the most prevalent. Long chain saturated fatty acids (12:0-18:0), which are associated with an increase in the risk of CVD, were found. A cholesterol value of 131 mg/100 g was found.
Keywords
Fatty Acid Profile, Chicken, Cardiovascular Disease
Received: July 31, 2015
Accepted: August 24, 2015
Published online: September 7, 2015
@ 2015 The Authors. Published by American Institute of Science. This Open Access article is under the CC BY-NC license. http://creativecommons.org/licenses/by-nc/4.0/
1. Introduction
In recent years consumer interest in the fat content of food products has increased, due to a number of epidemiological studies relating dietary fat intake and cholesterol with an increase in cardiovascular disease (CVD), giving meat consumption a bad image due to its high fat and cholesterol content. In response, the food industry has produced numerous "low-fat" products and has significantly reduced fat in the commercial presentation of meat. A great deal of emphasis has been placed on reducing fat content and evaluating the impact of meat consumption on serum cholesterol levels1,2. Such practices include the selection of breeds and genetic lines within breeds and changing animal feeding practices, among others3. Studies on the composition and quantification of fatty acids (FA) in a variety of plant and animal based food products have been carried out in terms of the effects on cardiovascular syndrome and diseases risk factors as well as the control of hyperglycemia and dyslipidemia4,5.
Fatty acid composition of subcutaneous adipose tissue and muscle from pigs, sheep and cattle has been studied6. The replacement of red meat with chicken meat has been associated with a decrease in apolipoprotein B and total cholesterol levels in diabetic patients. This effect is most likely related to the higher polyunsaturated fatty acid (PUFA) content in chicken compared to beef7. The fatty acid content has been studied in chicken thighs and breast8, chicken meat8 as well as in the meat of the ratite family: ostrich, rhea and emu9,10,11. In chicken, one of the most commonly consumed fowls; lipids are primarily deposited in the abdominal cavity and subcutaneous tissue. Chicken skin represents between 8 and 20% of the total weight12. The fat in the abdominal cavity is normally removed during the butchering and organ removal process, while the skin, where the subcutaneous fat is located, is not.
The objective of this work is to identify the fatty acid composition in chicken skin and the effects of its consumption.
2. Materials and Methods
2.1. Extraction of Raw Oil
10 g of chicken skin (Gallus gallus domesticus) was cut into small pieces and homogenized with a household blender. The fat was extracted using the microwave method13. The skin was exposed to microwave energy for 8 min a 1000 W in a household microwave. The extract was then filtered with Whatman paper 1.
2.2. Fatty Acid Identification
2.2.1. Saponification
One gram of extract was subjected to saponification adding 6 ml of methanol and shaking until becoming uniform. A 4 ml solution of KOH in methanol at 0.5 N was added and subjected to reflux for 20 min. at 90°C.
2.2.2. Methylation
1ml of BF3 was added to 2 ml of saponified oil and submitted to reflux for 30 min with constant agitation using a magnetic stirrer. Agitation was maintained during cooling and 3 ml of distilled water was added. The organic phase of the sample was extracted 3 times with 2 ml of hexane using a separatory funnel. The organic phases were mixed and 0.5 g of anhydrous MgSO4 was added to eliminate excess humidity. Whatman #1 paper was used to filter out the MgSO4.
2.2.3. Gas Chromatography–Mass Spectrometry (GC-MS)
The methyl extracts were analyzed with a Perkin Elmer gas chromatograph coupled with a TurboMass-Autosystem XL mass spectrometer connected to flame ionization detector (FID) and a computer with Total Chrom Navegator Software (Perkin-Elmer). The samples were injected in a 20% splitless mode in an Elite WAX column (polyethylene glycol of 30 m, 0. 32 mm, Perkin Elmer, Palo Alto, CA). Injector and FID temperatures were maintained at 230°C. The oven temperature programing was as follows: 180°C for 3 min followed by an increase of 20°C/min until 200°C. This temperature was maintained for 15 min. Argon was used as a carrier gas at a constant flow rate of 15 lb/min. FAME standards (Sigma 47885-U) were used to confirm retention times.
2.3. Cholesterol Analysis
Sample preparation: A 2 gr sample was placed in a round-bottomed flask and 10 ml of a methanolic potassium hydroxide solution (1M) was added. The solution was heated under reflux for 25 min, cooled and transferred to a 25 ml volumetric flask. The round-bottomed flask was rinsed three times with small quantities of isopropanol and added to the volumetric flask. 1ml of HCl (8M) was added and the flask was then filled to the line with isopropanol and placed in an ice bath for 10 min. The turbid solution was quickly filtered through filter paper Whatman #1.
The samples and one blank were analyzed with an enzymatic kit (Cat. 10 139 050 035; Boehringer Mannheim/R-Biopharm, Darmstadt, Germany) in accordance with the manufacturer’s instructions and read at 405 nm. The simple cholesterol content, expressed in en g cholesterol/100g, was calculated as follows:
![]()
Where:
![]()
V = final volume [ml]
v = sample volume [ml]
Mw = molecular weight of the substance to be assayed [g/mol]
d = light path [cm]
ε = extinction coefficient of the lutidine-dye at 405 nm = 7.4 [l × mmol-1 × cm-1]
![]() =Absorbance of sample – absorbance of blank
=Absorbance of sample – absorbance of blank
3. Results
Figure 1 shows the full GC-MS scan of fatty acids in chicken skin. A total of 11 FA were identified: 8 saturated and 3 monounsaturated fatty acids (Table 1). The relative concentration (Fig. 1) showed that the oleic acid is the most prevalent fatty acid, followed by palmitic, palmitoleic and stearic acid. Six fatty acid: C14:0, C16:0, C16.1, C18.1ω9, C18.2ω6, C18.3ω3 were reported by Feddern et al.14 wich 3 are similar to those found in this work.
Research presented at the Summary of the Scientific Conference on Dietary Fatty Acids and Cardiovascular Health15 concluded that individual FA have remarkably diverse effects on CVD risk factors and that little is known about the individual effects of FA on the risk factors for other degenerative diseases. In chicken skin (Table 1) we find medium and long chains of saturated and monounsaturated FA. Chicken skin tissue has more saturated fatty acids (30.5%) than chicken muscle (26.7%) and ostrich meat (21.4%)16, but less than dark chicken meat (36.34%)8. Moreover, the relative presence of monounsaturated fatty acids is greater in chicken tissue (69.45%) than in dark chicken meat (42.35%), ostrich meat (34.2%) and chicken meat (33.8%)8.
An individual analysis of the FA profile shows the effect that the consumption of skin chicken tissue can have on diverse diseases.
Different classes of saturated fatty acids have different effects on plasma lipid and lipoprotein levels17. Long chain saturated fatty acids (12:0,14:0,16:0,18:0) were associated with an increment in CVD risk factors while the consumption of short to medium chain saturated fatty acids (4:0-10:0) was not18. Mensink19 studied the effects of dietary fats on the risk of coronary artery disease (CAD) using the ratio of total to HDL cholesterol as a more specific marker of CAD. Myristic, palmitic and lauric acid decreased the ratio of total to HDL cholesterol in different proportions. Among the cholesterol-raising saturated fatty acids, myristic acid (14:0) appears to be more potent than lauric acid (12:0) or palmitic acid (16:0), but the data is not entirely consistent19,20.
The fatty acid with the highest relative content (57.54%) is oleic acid. According to recent studies omega-9’s are more beneficial than omega-6’s4. Both types of fats have a similar positive effect on total and LDL cholesterol levels, but omega 9’s have a supplementary effect on HDL cholesterol levels, hypertension and insulin sensibility.
Palmitoleic acid and cis-10 heptadecenoic acid were two cis-monounsaturated fatty acids (MUFA) found in the FA profile. MUFA are generally considered to have a neutral effect on serum cholesterol levels have not been related to CVD21.
It is important to note that linoleic acid (18:2 cis 9 fatty acids), a FA found in poultry and emu meat, was not found in this study. Studies on the presence of fatty acid trans-isomers in the atheromatous plaque relate the presence of linoleic acid to plaque formation.
The skin’s cholesterol content was 131 mg/100 g, a value superior to that reported in beef cuts (60.63-63.44 mg/100 g)8, dark chicken meat (98.82-104.31 mg/100 g)8, chicken thighs (98.82 mg/100 g)8, ostrich meat (56.61-71.12 mg/100 g)22,33,24, turkey skin (81 mg/100 g)25 , turkey meat (80-44 mg/100 g)26and chicken skin (71 mg/100 g)27. In contrast, values of 170-43.4 mg/100 g have been reported in poultry meat26. Some authors have noted that different quantification methods and cuts of meat from which the sample is obtained significantly affect the reported cholesterol content28,29, besides to the differences in the type of feeding chickens. In addition, most of the cholesterol in poultry is in the skin30, which would explain the differences.
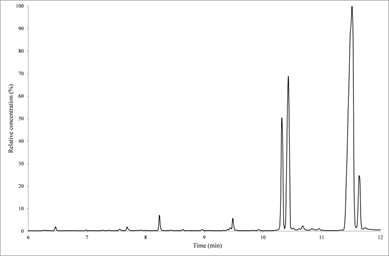
Fig. 1. Full scan GC-MS of fatty acid in chicken skin.
Table 1. Profile of fatty acid of chicken.
| Chemical name | Retention time (min) | Relative amount (%) | Common name | Lipid number |
| Caprylic Acid Methyl Ester | 6.47 | 0.341 | Caprylic acid | C8:0 |
| Nonanoic Acid, 9-oxo-Methyl Ester | 8.23 | 1.120 | Pelargonic acid | C9:0 |
| Laurate Acid Methyl Ester | 8.66 | 0.096 | Lauric acid | C12:0 |
| Methyl Myristate | 9.48 | 1.418 | Myristic acid | C14:0 |
| Methyl Pentadecanoate | 9.92 | 0.111 | Pentadecanoic acid | C15:0 |
| Methyl Palmitoleate (Methyl cis-9-oleic methyl ester) | 10.32 | 11.66 | Palmitoleic acid | C16:1 cis 9 |
| Methyl Palmitate | 10.45 | 20.76 | Palmitic acid | C16:0 |
| Cis-10-Heptadecenoic Acid Methyl Ester | 10.84 | 0.255 | Cis-10 Heptadecenoic acid | C17:1 cis 10 |
| Methyl Heptadecanoate | 10.95 | 0.222 | Margarit acid | C17:0 |
| 9-Octadecenoic Acid (z)- Methyl Ester | 11.50 | 57.54 | Oleic acid | C18:1 w9 |
| Methyl Stearate | 11.69 | 6.456 | Stearic acid | C18:0 |
4. Conclusion
The lipid profile of chicken skin reveals the presence of long chain saturated FA (12:0,14:0,16:0,18:0), short to medium chain saturated FA (4:0-10:0) and monounsaturated FA. The cholesterol level is higher than those reported in other birds’ meat but less than that reported for poultry meat.
Compared with other poultry meat, chicken meat has more saturated fatty acids, which justifies the practice of removing the skin in order to reduce fat consumption and the search for alternatives in reducing the subcutaneous fat in poultry.
In order to take advantage of the type of fatty acids in the skin of chicken and considering that abdominal and subcutaneous fat are regarded as the main sources of waste in the slaughterhouse, the lipids of the skin can be used as raw materials for biodiesel31, 32.
Acknowledgements
The authors wish to thank to the Instituto Politécnico Nacional for the facilities provided to carry out this investigation and to Isad Espinoza Vasquez, for her help with laboratory analysis.
References
- H.D. Hafs, R.G. Zimbelman, Academic Press, New York, 1994.
- G.J. Brisson, Pig News Inf., 1987, 8, 9-14.
- R. Chizzolini, E. Zanardi, V. Dorigoni and S. Ghidini, Trends Food Sci. Technol., 1999,10, 119–128.
- L. G. Gillingham, S.Harris-Janzand P.J.Jones,Lipids, 2011, 46(3), 209-228.
- A. Garg,Am. J. Clin. Nutr.1998,67(3 Suppl), 577S-582S.
- J.D. Wood, M. Enser, A.V. Fisher, G.R. Nute, P.R. Sheard, R.I. Richardson, S.I. Hughes and F.M. Whittington, Meat Sci., 2008, 78, 343–358.
- J.L. Gross, T. Zelmanovitz, C.C. Moulin, V. de Mello, M. Perassolo, C. Leitao, A. Hoefel, A. Paggi and M.J. Azevedo, D. Care, 2002, 25, 645-651.
- J. Carnevale de Almeida, M. S. Perassolo, J.L. Camargo, N. Bragagnolo and J.L. Gross,Rev. Bras.Cienc. Farm., 2006, 42(1), 109-117.
- M.C.Craig-Schmidt, A. Brown and P.C. Smith, Inform, 1995, 6, 450.
- M.C. Craig-Schmidt, Lipid Tech. Newslett., 1999, 5, 80–83
- L. M. Beckerbauer, R. Thiel-Cooper,D. U. Ahn, J. L. Sell,F. C. Jr. Parrish and D. C. Beitz, Poult. Sci., 2001, 80, 187–194.
- H. Fereidoun, A. Bahram, K.S. Sadraddin, A. Abbass and H.Pouria, Int. J. Poul. Sci., 2007,6 (1): 43-47.
- L.L. Méndez-Lagunas, A.M. Pineda-Reyes, L.R. Hernández-Ochoa and J. Rodríguez-Ramírez,Eur. J. Lipid. Sci. Tech., 2011, 113(6),780-785.
- V. Feddern, L. Kupski, E.P. Cipolatti, G. Giacobbo, G. L. Mendes, E. Badiale-Furlong and L A. de Souza-Soares, Eur. J. Lipid Sci. Technol., 2010, 112, 1277–1284.
- P. Kris-Etherton, S.R. Daniels, R.H. Eckel, M. Engler, B.V. Howard, R.M. Krauss, A.H. Lichtenstein, F. Sacks, S. St. Jeor, M. Stampfer, R.H. Eckel, S. M. Grundy, L. J. Appel, T. Byers, H. Campos, G. Cooney, M.A. Denke, B.V. Howard, E. Kennedy, R. M. Krauss, P. Kris-Etherton, A.H. Lichtenstein, P. Marckmann, T.A. Pearson, G. Riccardi, L. L. Rudel, M. Rudrum, F. Sacks, D. T. Stein, R. P. Tracy, V. Ursin, R.A. Vogel, P.L. Zock, L. T. Bazzarre and J. Clark, Circulation, 2001, 103(7), 1034-1039.
- R.G. Cooper and J.O. Horbanczuk, Animal Sci. J., 2002,73(3), 167-173.
- P. Kris-Etherton and S. Yu, Am. J. Clin. Nutr., 1997, 65(Suppl), 1628S–1644S.
- F.B. Hu, M.J. Stampfer, J.E. Manson, A. Ascherio, G.A. Colditz, F.E. Speizer, C.H. Hennekens and W.C. Willett, Am. J. Clin. Nutr.1999, 70, 1001–1008.
- R.P. Mensink, P.L. Zock, A.D.M. Kester and M.B. Katan, Am. J Clin. Nutr.,2003, 77:1146–1155.
- E. Temme, R.P. Mensink and G. Hornstra, Am. J. Clin. Nutr., 1996, 63, 897–903.
- D.M. Hegsted, R.B. McGandy, M.L. Myers and F. J Stare, Am. J. Clin. Nutr.,1965, 17, 281–295.
- J. Sales, D. Marais, M. Kruger, J. Food Comp. Anal., 1996, 9, 85-89
- A. Girolami, I. Marsico, G. D'Andrea, A. Braghieri, F. Napolitano, G.F. Cifun, Meat Sci., 2003, 64(3), 309-315
- J Sales, J.L Navarro, M.B Martella, M.E Lizurume, A Manero, L Bellis, P.T Garcia, Meat Sci., 1999, 53(2), 73-75
- S.R. Baggio, E. Vicente and N. Bragagnolo, J. Agric. Food Chem. 2002, 50 (21), 5981-5986.
- K.O. Honikel and W. Arneth, Fleischwirtschaft, 1996, 76, 1244-1253.
- P. van de Bovenkamp and M. B. Katan, J. Food Sci., 1981, 46(1), 291.
- D.P. Smith, D.L. Fletcher, R.T. Buhr and R.S.Bayer, Poultry Sci., 1993, 72, 202-208
- X. Fernández, J. Mourot, A. Mounier and P. Ecolan, Meat Sci., 1995, 41, 335-343.
- E.A Enas, A. Senthilkumar, H. Chennikkara and M.A. Bjurlin, Ind. Heart J., 2003, 55, 310-338.
- S. Lebedevas, and A. Vaicekauskas, Energy Fuels, 2006, 20, 2274-2280.
- C-W. Lin and S-W. Tsai, J. Energy South. Africa, 2015, 26, 36-45.


