
International Journal of Chemical and Biomolecular Science, Vol. 1, No. 3, October 2015 Publish Date: Sep. 2, 2015 Pages: 185-192
Spectrophotometric Quantification of Vardenafil in Bulk and Tablets
Atkuru Veera Venkata Naga KrishnaSunil Kumar1, *, Chandra Bala Sekaran2, Tamanampudi Varahala Reddy3
1Department of Chemistry, NRI Institute of Technology, Pothavarappadu, Andhra Pradesh, India
2Department of Pharmaceutical Biotechnology and Pharmaceutical Analysis, Medarametla Anjamma Mastan Rao College of Pharmacy, Narasaraopet, Andhra Pradesh, India
3Department of Chemistry, Mallareddy College of Engineering, Secundrabad, Andhra Pradesh, India
Abstract
The purpose of the present investigation is to develop and validate three spectrophotometric methods (1, 2 & 3) for the determination of vardenafil (VDL). Method 1 is based on the oxidation of VDL with KMnO4 in 0.6 M NaOH at room temperature and measurement of the green colored manganate ions at 630 nm. Method 2 involves the formation of yellow colored chloroform extractable ion-pair complex of VDL with bromocresol green under acidic condition. The colored ion-pair complex is quantitated spectrophotometrically at 420 nm. Method 3 is based on the inner molecular complex formation of the VDL with acetaldehyde and sodium nitroprusside in alkaline medium. The colored inner molecular complex is measured at 560 nm. Under the optimized experimental conditions, the absorbance vs concentration plot was linear over the range of 10-100 µg/ml, 5-60 µg/ml and 2-20 µg/ml with molar absorptivities of 4.299 x 103,3.755 x 104and 4.079 x 10⁴L/mole/cm for methods 1, 2 and 3, respectively. The limits of detection and quantification values were calculated to be 0.335 & 1.015 µg/ml (method 1), 0.055 & 0.166 µg/ml (method 2) and 0.013 & 0.039 µg/ml (method 3). The relative standard deviations obtained in the intra- and inter-day analyses were in the range of 0.082%-0.890% (method 1), 0.114%-1.515% (method 2) and 0.372%-0.942% (method 3). The methods are successfully applied to the quantification of VDL tablets with percentage recovery in the range of 99.30-99.88% (method 1), 99.60-99.88% (method 2) and 99.80-99.90% (method 3). Common excipients present in tablet formulations did not interfere with the assay. The results demonstrate that the proposed methods are accurate, reproducible and can be useful for routine analysis of VDL in tablets.
Keywords
Vardenafil, Ion-Pair Complex, Oxidoreduction, Inner Molecular Complex, Spectrophotometric Analysis
Received: July 29, 2015
Accepted: August 23, 2015
Published online: September 2, 2015
@ 2015 The Authors. Published by American Institute of Science. This Open Access article is under the CC BY-NC license. http://creativecommons.org/licenses/by-nc/4.0/
Contents
1. Introduction 2. Experimental 2.1. Instruments 2.2. Reagents and Materials 2.3. Reference Drug and Tablet Dosage Forms 2.4. Standard Solutions 2.5. Tablet Sample Solution 2.6. Construction of Calibration Graphs 2.7. Assay of Vardanafil in Tablet Sample Solutions 3. Results 3.1. Basis of Colour Reaction 3.2. Optimization of Experimental Conditions 3.3. Method Validation 3.4. Application of the Proposed Methods for the Analysis of Dosage Forms 4. Discussion 5. Conclusion Acknowledgements
1. Introduction
Vardenafil (1-3) is a selective inhibitor of cyclic guanosine monophosphate-specific phosphodiesterase type 5. Chemically, vardanafil is designated as piperazine, 1-[[3-(1,4-dihydro-5-methyl-4-oxo-7-propylimidazo[5,1-f] [1,2,4]triazin-2-yl)-4-ethoxyphenyl] sulfonyl]-4-ethyl-, monohydrochloride. VDL is considered as a first-line treatment option in men who are suitable for oral specific phosphodiesterase type 5 inhibitor therapy. VDL is used to treat men with mild to severe erectile dysfunction.
Individual quantification of VDL in bulk, tablet dosage forms and biological fluids have been developed with the help of a variety of analytical tools including HPLC with UV detection (4), stability indicating liquid chromatography with UV detection (5), HPLC with chemiluminescence detection (6), stability indicating UPLC (7), capillary electrophoresis with diode-array detection(8), micellar electrokinetic capillary chromatography(9) and LC–ESI–MS (10). A significant attention is being paid to the development of visible spectrophotometric method as it is simple, sensitive, cost effective, does not require sophisticated instrumentation, reliable and accurate technique. To the best of our knowledge, there is no report found in the literature for the determination of VDL by spectrophotometric method. Hence, our work aimed at the development of three new spectrophotometric methods for the quantification of vardanafil.
2. Experimental
2.1. Instruments
• An ELICO recording ultraviolet-visible spectrophotometer (Elico Ltd, Hyderabad, India) model SL 159 with matched 1-cm quartz cells was used.
• An Shimazdu (Tokyo, Japan) electronic weighing balance model BL 220H was used for weighing the sample
2.2. Reagents and Materials
All the chemicals used were of analytical grade and distilled water was used all through the work. All the reagents were freshly prepared daily.
2.2.1. Method 1
• Sodium hydroxide (Sdfine-Chem limited, Mumbai, India) was prepared as 0.6 M in distilled water.
• Potassium permanganate (Sdfine-Chem limited, Mumbai, India) solution was prepared as 0.01% (w/v) in distilled water.
2.2.2. Method 2
• Bromocresol green (Sdfine-Chem limited, Mumbai, India) solution was prepared as 0.12 % (w/v) in water.
• Hydrochloric acid was obtained from Fisher Scientific (Mumbai, India), 0.1N solution was prepared.
• Chloroform was obtained from Merck, Mumbai, India.
2.2.3. Method 3
• Acetaldehyde was obtained from Fisher Scientific (Mumbai, India). 10% (v/v) aqueous solution was prepared.
• Sodium nitroprusside (1% w/v aqueous solution) was purchased from Sdfine-Chem limited, Mumbai, India.
• Sodium hydroxide (1 M aqueous solution) was obtained from Sdfine-Chem limited, Mumbai, India.
2.3. Reference Drug and Tablet Dosage Forms
Rainbow Pharma Training Labs (Hyderabad, India) kindly supplied a pure sample of VDL. The commercial tablets containing 10 mg, 20 mg and 25 mg of VDL per tablet, product of Bayer healthcare pharmaceuticals Inc, Wayne, were purchased from local pharmacy stores
2.4. Standard Solutions
Stock standard solution of VDL was prepared by dissolving 100 mg of VDL in 100 ml distilled water. Working standard solutions (500 μg/ml-methods 1 & 2; 100 μg/ml-method 3) were obtained by appropriate dilution of the stock standard solution with distilled water.
2.5. Tablet Sample Solution
Twenty tablets were accurately weighed and finely powdered. A quantity of the tablet powder equivalent to 100 mg of VDL was transferred into a 100 ml calibrated flask, dissolved in 30 ml water, swirled and sonicated for 5 minutes. The contents of the flask was completed to volume with the water and filtered.
2.6. Construction of Calibration Graphs
2.6.1. Method 1
To a set of 10 ml volumetric flasks, aliquot volumes (0.2-2.0 ml) containing the VDL in the concentration range of 10-100 μg/ml were quantitatively transferred. To each flask 2 ml of 0.6 M NaOH followed by 2 ml of 0.01% KMnO4 were added and mixed well. The solutions were kept at room temperature for 30 minutes. The solutions were made up to volume with distilled water. The absorbance was measured at 630 nm against a reagent blank. The calibration graph was constructed by plotting the absorbance versus the final concentration of the VDL (μg/ml). Alternatively, the corresponding regression equation was derived.
2.6.2. Method 2
To a set of 125 ml separating funnels, aliquot volumes (0.1-1.2 ml) containing the VDL over the concentration range of 5-60 μg/ml were quantitatively transferred. To each funnel 1 ml of 0.1 N HCl followed by 3 ml of 0.12% bromocresol green (BCG) solution was added and mixed well. Five ml of chloroform was added into each separating funnel and shaken well for 5 min and kept aside for 5 min. The VDL-BCG complex was extracted into the chloroform layer and it was separated into a set of 10 ml volumetric flasks. The flasks were made up to volume with chloroform. The absorbance was measured at 420 nm against the reagent blank. To get the calibration graph, the values of the absorbance were plotted against the final concentration of VDL in μg/ml, alternatively the regression equation was derived.
2.6.3. Method 3
To a set of 10 ml volumetric flasks, aliquot volumes (0.2-2.0 ml) containing the VDL over the concentration range of 2-20 μg/ml were quantitatively transferred. A volume of 0.5 ml of 1M NaOH was added to each flask followed by 1 ml of 10 % acetaldehyde solution and 1 ml of 1% sodium nitroprusside solution. The solutions were mixed well and left at room temperature for 5 min. The flasks were completed to the volume using distilled water. The absorbance was measured at 560 nm against a reagent blank. The absorbance was plotted versus the final concentration of the VDL (μg/ml) to obtain the calibration graph. Alternatively, the corresponding regression equation was derived.
2.7. Assay of Vardanafil in Tablet Sample Solutions
The sample solution prepared in the section "Tablet sample solution" was diluted appropriately with distilled water to obtain concentrations: 500 μg/ml for methods 1 & 2 and 100 μg/ml for method 3. The procedures described under "Construction of calibration graph" were performed. The concentration of VDL in tablets was calculated either from the formerly plotted calibration graphs or using the corresponding regression equations.
3. Results
3.1. Basis of Colour Reaction
3.1.1. Method 1
In the method 1, VDL is oxidized by potassium permanganate in alkaline medium. During the oxidation, the potassium permanganate reduced to green colored manganate ion (MnO42−). The manganate ion formed is monitored spectrophotometrically at 630 nm.
3.1.2. Method 2
Method 2 was based on the reaction of VDL with BCG in acidic medium, producing a yellow ion-pair complex which was extracted into chloroform. The VDL-BCG ion pair complex shows maximum absorbance at 420 nm.
3.1.3. Method 3
In the method 3, the secondary amino group of VDL reacts with acetaldehyde resulting in the formation of N-alkyl vinyl amine. This is followed by the formation of colored inner molecular complex between sodium nitroprusside and N-alkyl vinyl amine. The colored inner molecular complex exhibits absorption maxima at 560 nm.
3.2. Optimization of Experimental Conditions
The experimental parameters affecting the colored complex development and their stability in the methods 1, 2 & 3 were carefully studied and optimized. The experimental parameters studied are:
Method 1:
• Volume of 0.6 M NaOH
• Volume of 0.01% potassium permanganate
• Reaction time
Method 2:
• Volume of 0.12% bromocresol green
• Volume of 0.1 N HCl
• Extraction solvent
Method 3:
• Volume of 10% acetaldehyde
• Volume of 1% sodium nitoprusside
• Volume of 1M NaOH
3.2.1. Method 1
(i) Effect of Alkalinity
The influence of sodium hydroxide concentration was studied by treating 1 ml of VDL (50 μg/ml) with varying volumes (0.5-3.0 ml) of 0.6M NaOH. It was found that 2 ml of 0.6M NaOH gives the highest absorbance value as shown in Figure 1. Above this volume, the absorbance remained constant. Thus, 2 ml of 0.6M NaOH was proved to be adequate for the determination process.
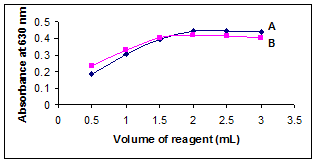
Figure 1. Effect of concentration of (A) NaOH (B) KMnO4.
(ii) Effect of Concentration of Potassium Permanganate
The effect of the concentration of KMnO4 on the color development was studied by adding different volumes (0.5–3.0 ml) of 0.01% KMnO4 to 1 ml of VDL (50 μg/ml). The maximum absorbance was reached at 2.0 ml of the KMnO4 and slightly decreased with higher volumes. Therefore, the optimum value was chosen as 2.0 ml of the 0.01% KMnO4 (Figure 1).
(iii) Effect of Reaction Time
To study the effect of reaction time on the formation of the manganate ions, 1 ml of VDL (50 μg/ml) was mixed with 2 ml of 0.6 M NaOH and of 2 ml of 0.01% potassium permanganate. The contents of the mixture were kept at room temperature for 40 minutes. The results revealed that the maximum intensity of color was obtained at 20 minutes and remained constant for 30 minutes. Further increase in the reaction time, the absorbance decreased (Figure 2). Therefore, the optimum reaction time was fixed at 20 minutes.
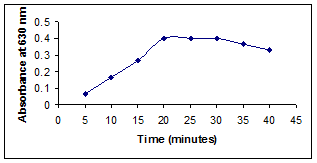
Figure 2. Effect of time.
3.2.2. Method 2
(i) Effect of Concentration of Bromocresol Green
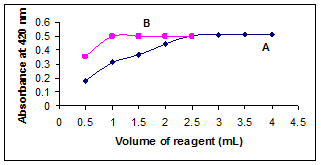
Figure 3. Effect of concentration of (A) BCG (B) HCl.
The effect of the concentration of BCG in the formation of VDL-BCG ion-pair complex was examined by adding different volumes (0.5-4 ml) of 0.12 % BCG and 1ml of 0.1N HCl to 1 ml of VDL (50μg/ml). It was found that the maximum absorbance of the yellow color was reached with 3 ml of 0.12% BCG and remained stable with higher volumes (Figure 3). Thus, 3 ml of 0.12% BCG was used all through the experimental investigations.
(ii) Effect of Acidity
The influence of acidity on the development of ion-pair complex was studied by adding 3 ml of 0.12% BCG and different volumes (0.5-2.5 ml) of 0.1N HCl to 1 ml of VDL (50 μg/ml). The maximum color intensity was observed with 1 ml of 0.1N HCl, above this volume the absorbance remained constant (Figure 3). So, 1 ml of 0.1N HCl was used throughout the experiment
(iii) Effect of Type of Extraction Solvent
To assess the extraction efficiency, different organic solvents (methanol, acetonitrile, carbon tetrachloride and chloroform) were used for the extraction of yellow colored VDL-BCG ion-pair complex. Utmost absorbance was obtained while extracted with chloroform. As a result, chloroform is considered to be the good solvent for the extraction.
(iv) Effect of Reaction Time
The formation of the VDL-BCG ion-pair complex was instantaneous and the development of the color was completed within five minutes.
3.2.3. Method 3
(i) Effect of Concentration of Acetaldehyde
To optimize the concentration of acetaldehyde, different volumes (0.5-2.5 ml) of 10% acetaldehyde were added to the mixture under study (10 μg/ml VDL). It was found that 1 ml of 10% acetaldehyde was sufficient for the formation of maximum and stable colored complex. At lower concentration of 10% acetaldehyde, there was a decrease in absorbance. Whereas, no change in absorbance was observed at higher concentration (Figure 4).
(ii) Effect of Sodium Nitoprusside
To study the effect of the concentration of sodium nitoprusside on the absorbance of the colored complex, varying volumes of (0.5–2.5 ml) 1% sodium nitoprusside were mixed with 1 ml of VDL (10 μg/ml). The results showed that the highest absorbance was obtained with 1 ml, which remained unaffected by further addition of 1% sodium nitoprusside (Figure 4). Hence, 1 ml of 1% sodium nitoprusside was used for the determination.
(iii) Effect of Alkalinity
The influence of alkalinity on the development and stability of the colored complex using different volumes (0.5–2 ml) of 1M NaOH were tested. The color intensity was observed constant at all the volumes of 1M NaOH and therefore 0.5 ml of 1M NaOH was used throughout the experiment (Figure 4).
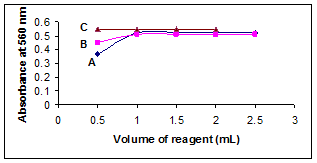
Figure 4. Effect of concentration of (A) actaldehyde (B) sodium nitroprusside (C) NaOH.
(iv) Effect of Reaction Time
The formation of the inner molecular complex was instantaneous and the development of the color was completed within five minutes.
3.3. Method Validation
According to ICH guidelines validation of the methods was performed (11).
3.3.1. Stability of the Coloured Complex
The intensity of the color developed in the proposed methods was stable for 30 minutes (method 1) and 2 hours (methods 2 & 3).
3.3.2. Linearity
The linearity of the proposed methods (1, 2 & 3) was determined by constructing a calibration curve with seven calibration points for VDL, in the concentration range of 10-100 μg/ml for method 1, 5-60 μg/ml for method 2 and 2-20 μg/ml for method 3. The absorbance values were plotted against the respective concentrations of VDL to obtain the calibration curves. The results were subjected to regression analysis by the least squares method to calculate the intercept, slope and regression coefficient. The results are presented in Table 1.
3.3.3. Sensitivity
Sensitivity parameters such as Sandell’s sensitivity, molar absorptivity, limit of detection (LOD) and the limit of quantification (LOQ) are calculated for the proposed methods. The results are compiled in Table 1.
Table 1. Linearity and sensitivity data.
| Parameters | Method | ||
| 1 | 2 | 3 | |
| Beer’s Limit (µg/ml) | 10-100 | 5-60 | 2-20 |
| Molar Absorbtivity (L/ mole/ cm) | 4.299x10³ | 3.755x10⁴ | 4.079x10⁴ |
| Sandell’s sensitivity (µg cm-2/0.001 Absorbance unit) | 1.13x10⁻² | 9.52x10⁻³ | 1.877x10⁻³ |
| Regression equation (Y= mx + c)$ | - | - | |
| Slope (m) | 0.0088 | 0.0105 | 0.0535 |
| Intercept (c) | -0.0029 | -0.0061 | 0.0045 |
| Correlation coefficient (r) | 0.999 | 0.9996 | 0.9995 |
| LOD (µg/ml) | 0.335 | 0.055 | 0.013 |
| LOQ (µg/ml) | 1.015 | 0.166 | 0.039 |
$Y = mx + c, where Y is the absorbance and x is the concentration of VDL (μg/ml)
Table 2. Intra- & inter-day precision and accuracy data.
| Method | Intra-day analysis | Inter-day analysis | ||||||
| Concentration of VDL (μg/ml) | % RSD | % Recovery | Concentration of VDL (μg/ml) | % RSD | % Recovery | |||
| Taken | Found* | Taken | Found* | |||||
| 1 | 10 | 9.98 | 0.89 | 99.98 | 10 | 9.95 | 0.874 | 99.50 |
| 50 | 49.97 | 0.184 | 99.94 | 50 | 50.02 | 0.179 | 100.04 | |
| 100 | 99.95 | 0.095 | 99.95 | 100 | 99.93 | 0.082 | 99.93 | |
| 2 | 5 | 4.95 | 1.515 | 99.00 | 5 | 4.98 | 1.305 | 99.60 |
| 30 | 29.94 | 0.28 | 99.80 | 30 | 29.89 | 0.317 | 99.63 | |
| 60 | 60.04 | 0.114 | 100.06 | 60 | 59.84 | 0.12 | 99.73 | |
| 3 | 2 | 1.89 | 0.74 | 94.50 | 2 | 1.91 | 0.942 | 95.50 |
| 10 | 9.96 | 0.652 | 99.60 | 10 | 10.02 | 0.688 | 100.20 | |
| 20 | 19.81 | 0.439 | 99.05 | 20 | 19.89 | 0.372 | 99.45 | |
* Average of five determinations
3.3.4. Precision and Accuracy
The intra- and inter-day precision and accuracy of the proposed methods (1, 2 & 3) were examined by the analysis of VDL at three different levels of concentration (10, 50 and 100 μg/ml – method 1; 5, 30 and 60 μg/ml – method 2; 2, 10 and 20 μg/ml – method 3). The intra- & inter-day precision and accuracy was assessed by the analysis of each concentration in one day and on three different days, respectively. The results are expressed as percentage recovery and percentage relative standard deviation (Table 2).
3.3.5. Recovery Studies
Accuracy of the proposed methods (1, 2 & 3) was further evaluated by spiking the preanalyzed tablet solution with pure drug. The total concentration of VDL was once again analyzed by the proposed methods (1, 2 & 3) and the percentage recovery was then calculated. The results of recovery studies are shown in Table 3.
Table 3. Recovery study data.
| Method | Concentration of VDL (mg) | % Recovery | % RSD | ||
| Labeled claim | Drug added | Found$ | |||
| 1 | 10 | 10 | 19.96 | 99.80 | 0.233 |
| 20 | 10 | 29.97 | 99.90 | 0.202 | |
| 25 | 10 | 34.95 | 99.85 | 0.144 | |
| 2 | 10 | 10 | 19.95 | 99.75 | 0.248 |
| 20 | 10 | 29.96 | 99.86 | 0.155 | |
| 25 | 10 | 34.92 | 99.77 | 0.141 | |
| 3 | 10 | 10 | 19.95 | 99.75 | 0.233 |
| 20 | 10 | 29.93 | 99.76 | 0.132 | |
| 25 | 10 | 34.95 | 99.85 | 0.163 | |
$ Average of five determinations
Table 4. Robustness data.
| Experimental parameter | Concentration of VDL (μg/ml) | % RSD | % Recovery | |
| Taken | Found$ | |||
| Method 1 | ||||
| Volume of 0.6 M NaOH (2 ± 0.1 ml) | 10 | 9.94 | 0.925 | 99.40 |
| 100 | 99.89 | 0.194 | 99.89 | |
| Volume of 0.01% KMnO4 (2 ± 0.1 ml) | 10 | 10.01 | 0.389 | 99.90 |
| 100 | 99.97 | 0.899 | 99.97 | |
| Reaction time (20 ± 2 min) | 10 | 9.96 | 0.873 | 99.60 |
| 100 | 100.5 | 0.917 | 100.05 | |
| Method 2 | ||||
| Volume of 0.1 N HCl (1 ± 0.1 ml) | 5 | 4.88 | 1.413 | 98.60 |
| 60 | 59.92 | 0.140 | 99.86 | |
| Volume of 0.12% BCG (3 ± 0.2 ml) | 5 | 4.97 | 0.840 | 99.40 |
| 60 | 59.95 | 0.457 | 99.95 | |
| Method 3 | ||||
| Volume of 1M NaOH (0.5 ± 0.1 ml) | 2 | 1.99 | 0.567 | 99.50 |
| 20 | 19.93 | 0.406 | 99.65 | |
| Volume of 1% sodium nitroprusside (1 ± 0.1 ml) | 2 | 1.97 | 0.684 | 98.50 |
| 20 | 19.96 | 0.445 | 99.8 | |
| Volume of 10% acetaldehyde (1 ± 0.1 ml) | 2 | 1.98 | 0.846 | 99.00 |
| 20 | 19.89 | 0.477 | 99.45 | |
$ Average of three determinations
3.3.6. Robustness
Method robustness was examined by making small deliberate changes in the experimental parameters. The investigated parameters are:
Method 1
• Volume of 0.6 M NaOH (2 ± 0.1 ml)
• Volume of 0.01% KMnO4 (2 ± 0.1 ml)
• Reaction time (20 ± 2 min)
Method 2
• Volume of 0.1 N HCl (1 ± 0.1 ml)
• Volume of 0.12% BCG (3 ± 0.2 ml)
Method 3
• Volume of 1M NaOH (0.5 ± 0.1 ml)
• Volume of 10% acetaldehyde (1 ± 0.1 ml)
• Volume of 1% sodium nitroprusside (1 ± 0.1 ml)
The robustness was checked at two different VDL concentration levels (10 & 100 μg/ml – method 1; 5 & 60 μg/ml – method 2; 2 & 20 μg/ml – method 3). The results (Table 4) indicated that the changes had insignificant influence on the results as revealed by small values of relative standard deviation (≤1.043).
3.4. Application of the Proposed Methods for the Analysis of Dosage Forms
The satisfactory validation results made the proposed methods (1, 2 & 3) suitable for the analysis of VDL in tablet dosage forms (Levitra tablets, labeled to contain 10 mg, 20 mg and 25 mg of VDL per tablet). The results obtained by the proposed methods were recorded in Table 5.
Table 5. Assay results for the determination of VDL in tablet dosage forms.
| Method | Concentration of VDL (mg) | % Recovery | % RSD | |
| Labeled claim | Found$ | |||
| 1 | 10 | 9.93 | 99.30 | 0.383 |
| 20 | 19.93 | 99.65 | 0.186 | |
| 25 | 24.97 | 99.88 | 0.180 | |
| 2 | 10 | 9.96 | 99.60 | 0.431 |
| 20 | 19.95 | 99.75 | 0.306 | |
| 25 | 24.97 | 99.88 | 0.157 | |
| 3 | 10 | 9.98 | 99.80 | 0.520 |
| 20 | 19.98 | 99.90 | 0.206 | |
| 25 | 24.96 | 99.84 | 0.187 | |
$ Average of five determinations
4. Discussion
The manganate ion (MnO4−) in the potassium permanganate is in the +7 oxidation state, because of which it acts as a strong oxidizing agent (12). Manganate ion (MnO4−) is reduced to +2 oxidation state of manganese(Mn2+) ion, a colorless ion, in acidic solution. Whereas in alkaline solution it is reduced to +6 oxidation state of manganate ion (MnO42−), a green colored ion. In a neutral medium, it gets reduced to the +4 oxidation state of manganese dioxide (MnO2), a brown colored product.
8 H+ + MnO4− + 5 e− → Mn2+ + 4 H2O (in acidic solution)
MnO4− + e− → MnO42−(in alkaline solution)
2 H2O + MnO4− + 3 e− → MnO2 + 4 OH−(in neutral medium)
The oxidizing property of the permanganate was used as the basis in the development of spectrophotometric method by most of the researchers (13-16).
Ion-pair spectrophotometric method is based on the formation of colored ion-pair complex between the drug and dye. This was followed by extraction of the ion-pair complex with organic solvent. The spectrophotometric analysis of many pharmaceutical compounds using bromocresol green as an ion-pair reagent has been frequently investigated (17-20).
Cullies and Waddington reported that most of the secondary amines react with sodium nitroprusside and acetaldehyde under mild alkaline conditions to produce colored products (21). This reaction has been used as a simple spot-test to identify alkaloids by Simon's test. The formation of [Fe(CN)5H2O]3- in aqueous solution of sodium nitroprusside has been reported by Wolfe and Swine hart(22). The combination of sodium nitroprusside and acetaldehyde has been applied as an analytical reagent in the spectrophotometric determination of some pharmaceutical compounds (23-25).
For the first time, the above said three reagents, potassium permanganate, bromocresol green and sodium nitroprusside, were used as analytical reagents for the determination of VDL in bulk and tablet formulations by visible spectrophotometric methods 1, 2 and 3, respectively.
The high values of molar absorptivity and low values of Sandell’s sensitivity, limit of detection and limit of quantification indicate adequate degree of sensitivity of the proposed methods (Table 1). The precision and accuracy of the proposed methods were fairly good, as indicated by the low values of relative standard deviation and high values of recovery (Table 2). This level of precision and accuracy was satisfactory for the analysis of VDL. Recovery studies gave satisfactory results indicating that none of the major excipients interfered with the assay method (Table 3). In addition, the recovery studies indicate the selectivity of the methods and its applicability for routine determination of VDL in tablet dosage forms. The proposed methods are unaffected by slight variations in experimental conditions as indicated by low percent standard deviation values (Table 4). The developed methods were applied to estimate the content of VDL in tablet formulation. The results showed good reproducibility of the recovery and precision (Table 5).
5. Conclusion
Three spectrophotometic methods (using potassium permanganate-method 1; bromocresol green-method 2; sodium nitroprusside-method 3 as analytical reagents) were developed, validated and successfully applied for the determination of VDL in bulk as well as in tablet formulations. The developed methods are simple and cost effective as they do not need sophisticated instrumentation and expertise personnel as in chromatography and electrophoretic techniques. The developed methods evidence low cost per analysis, because cheap and readily available chemicals are used. The proposed methods have the advantage of adequate sensitivity, robust, accuracy and precision in addition being free from interference from common excipients. Therefore, it is concluded that the proposed methods can be recommended for routine and quality control analysis of VDL.
Acknowledgements
One of the authors, A. V. V. N. K. S. Kumar, expresses their gratitude to the management Department of Chemistry, NRI Institute of Technology, Vijayawada for their continuous support, encouragement and for providing the necessary research facilities.
References
- G.M. Keating and L.J. Scott, Vardenafil: A review of its use in erectile dysfunction, Drugs, 2003, 63, 2673-2703.
- A.M. Morales, V. Mirone, J. Dean and P. Costa, Vardenafil for the treatment of erectile dysfunction: an overview of the clinical evidence, Clin. Interv. Aging, 2009, 4, 463-472.
- I. Eardley, J.C. Lee, R. Shabsigh, J. Dean, M. Maggi, D. Neuser and C. Norenberg, Vardenafil improves erectile function in men with erectile dysfunction and associated underlying conditions, irrespective of the use of concomitant medications, J. Sex Med., 2010, 7, 244-255.
- G. Manisha, P. Usha and P. Vandana, Development and validation of RP-HPLC method for estimation of vardenafil in bulk and pharmaceutical formulation. Am. J. PharmTech Res., 2013, 3, 928-938.
- D.V. Subba Rao, K.V. Surendranath, P. Radhakrishnan, M.V. Suryanarayana and P. Raghuram, A stability indicating LC method for vardenafil HCl, Chromatographia, 2008, 68, 829-835.
- Y. Di, M. Zhao, Y. Nie, F. Wang and J. Lv, A high-performance liquid chromatography: chemiluminescence method for potential determination of vardenafil in dietary supplement, J. Autom. Methods Manag. Chem., 2011, 2011, 1-6.
- K.K. Kumar, C.K. Rao, Y.R.K. Reddy and K. Mukkanti, A validated rapid stability-indicating method for the determination of related substances in vardenafil hydrochloride by ultra-performance liquid chromatography, American J. Anal. Chem., 2012, 3, 59-66.
- A.M. Idris and A.O. Alnajjar, Multi-Response optimization of a capillary electrophoretic method for determination of vardenafil in the bulk drug and in a tablet formulation, Acta Chromatogr., 2007, 19, 97-109.
- J.R. Flores, J.J.B. Nevado, G.C. Penalvo and N.M. Diez, Development of a micellar electrokinetic capillary chromatography method for the determination of three drugs employed in the erectile dysfunction therapy, J. Chromatogr. B., 2004, 811, 231-236.
- S.R. Gratz, C.L. Flurer and K.A. Wolnik, Analysis of undeclared synthetic phosphodiesterase-5 inhibitors in dietary supplements and herbal matrices by LC-ESI-MS and LC-UV, J. Pharm. Biomed. Anal., 2004, 36, 525-533.
- International Conference on Harmonization of Technical Requirements for Registration of Pharmaceuticals for Human Use, ICH Harmonized Tripartite Guidelines, Validation of Analytical Procedures: Text and Methodology Q2 (R1), Current Step 4 version, Nov. 1996, Geneva, Nov. 2005.
- D. Sukalyan, P. Sabita and K.M. Bijay, Oxidation by permanganate: synthetic and mechanistic aspects, Tetrahedron, 2009, 65, 707–739.
- A.P.K. Aftab,M. Ayaz,B. Shaista,K.S. Siddiqi and M.A. Abdullah, Spectrophotometric methods for the determination of ampicillin by potassium permanganate and 1-chloro-2,4-dinitrobenzene in pharmaceutical preparations, Arabian J. Chem., 2015, 8, 255–263.
- A.E.F.G. Ayman,E.S. Ragaa,E.S. Zeineb,H. Nagda andE.A. Rham, Spectrophotometric determination of pipazethate HCl and dextromethorphan HBr using potassium permanganate, Int. J. Biomed. Sci., 2008, 4, 294–302.
- S.M. Fraihat and K.M. Bahgat, Spectrophotometric methods for the determination of ketoconazole in pharmaceutical dosage forms, Trop. J. Pharma. Res., 2014, 13, 1511-1514.
- B.K. Jayanna, A facile spectrophotometric method for the determination of donepezil hydrochloride in tablets formulation using potassium permanganate, Asian J. Phar. Biol. Res., 2012, 2, 216-218.
- T. Vetrichelvan, K. Arul, M. Sumithra and B. Umadevi, Colorimetric method for the estimation of escitalopram oxalate in tablet dosage form, Indian J. Pharm. Sci., 2012, 72, 269-271.
- G. Balamma, N.S.M. Sagari, B.S.M., Kumar and P.J. Reddy, Spectrophotometric estimation of promethazine hydrochloride in bulk and pharmaceutical formulations, Int. J. Pharma. Res. Anal., 2012, 2, 6-8.
- P. Ashwin, S. Alankar, J. Anurekha and G.K. Singh, Method development and validation for estimation of trihexyphenedyl hydrochloride in tablet dosage forms, Asian J. Res. Chem., 2009, 2, 104-107.
- M. El-Adl Sobhy, M.E. Sadek, E. Hossinny and M.H. Hassan, Extractive spectro estimation of clarithromycin and clindamycin in bulk and dosage forms, Asian J. Res. Pharma. Sci., 2014, 4, 179-186.
- C. F. Cullis and C.J. Waddington, The colorimetric determination of secondary amines, Anal. Chim. Acta, 1956, 15, 158–163.
- S.K. Wolfe and J.H. Swinehart, Photochemistry of [22] pentacyanonitrosylferrate(2-), nitroprusside, Inorg. Chem., 1975, 14, 1049–1053.
- B.M. Gurupadayya, M.N. Trinath and K. Shilpa, Spectrophotometric determination of meloxicam by sodium nitroprusside and 1,10-phenanthroline reagent in bulk and its pharmaceutical formulation, Indian J. Chem. Tech., 2013, 20, 111-115.
- B. KalyanaRamu, Estimation of tianeptine in its tablet form using visible spectrophotometric methods, Asian J. Pharmaceu. Res. Health Care, 2013, 5, 72-79.
- B. Kalyanaramu, K. Raghubabu and Y. Vamsikumar, Development of a simple colorimetric determination of ramipril from pharmaceutical formulations, J. Chem. Pharm. Res., 2011, 3, 863-869.


