
International Journal of Chemical and Biomolecular Science, Vol. 1, No. 3, October 2015 Publish Date: Aug. 12, 2015 Pages: 117-122
Application of Microsatellite SSR Markers in a Number of Pomegranate (Punica granatum L.) Cultivars in Kurdistan Region/Duhok Province
Dalal Y. Sinjare*
Scientific Research Center, Duhok University, Duhok, Iraq
Abstract
In this research a set of 12 simple sequence repeat (SSR) markers was used to evaluate the genetic diversity background of 11 pomegranate (Punica granatum L.) cultivars were collected from the agricultural directorate nursery in Duhok province. These cultivars represent the main cultivars which cultivated in Kurdistan region, particularly around Duhok province. Among the developed primers, five revealed monomorphic alleles across all pomegranate populations, whereas seven loci amplified polymorphic banding patterns. A total of 25 alleles were detected with average of 2.08 alleles per locus. The mean values of expected (He) heterozygosity were 0.3315. The content average of polymorphic information was 0.2572. Genetic distance among the 11 varieties ranged from 0.0606 to 0.2683. Results of overall data and cluster analysis suggested that this set of primers can be very useful for studding genetic diversity and pedigree analysis of this important economical important fruit species.
Keywords
Pomegranate (Punica granatum L.), Microsatellite, Genetic Diversity
Received: July 20, 2015
Accepted: July 29, 2015
Published online: August 11, 2015
@ 2015 The Authors. Published by American Institute of Science. This Open Access article is under the CC BY-NC license. http://creativecommons.org/licenses/by-nc/4.0/
1. Introduction
Pomegranate (Punica granatum L.) has been cultivated for centuries in several regions with different environmental conditions. Many varieties of pomegranate grow well and of high quality in different regions of Iraq, including Diyala, Anbar. In Kurdistan, the pomegranate is growing wild and also cultivated in the orchards, such as in Hellbjh, Rania, Duhok, and several other areas (Townsend and Guest, 1964). The pomegranate species has been conventionally included in the monogeneric family Punicaceae, which consists of two species, namely, P. granatum L. and P. protopunica Balf. F. The latter is a threatened species in Socotra Island. Molecular phylogenetic and evolution analyses support the recent inclusion of Punica within the family Lythraceae (Huang and Shi, 2002). The pomegranate fruit consists of a thick skin and an enlarged calyx overlain by its persistent sepals. Pomegranate can be propagated by seeds, but vegetative propagation by saplings and cuttings is the most common. However, the distribution of genetic diversity in the pomegranate gene pool has not been well studied (Hasnaoui et al., 2011). The current distribution of pomegranate is strongly influenced by humans; hundreds of varieties/cultivars are present worldwide, and these cultivars vary extensively in morphological, agronomical, and postharvest attributes (Still, 2006; Holland et al., 2009). Despite the long history of cultivation, pomegranate has been a neglected and untapped crop; relatively little information exists on pomegranate’s botany, genetics, and agronomy (IPGRI, 2002).
Recently, this ancient fruit species has received considerable interest because of its numerous medicinal, health, and nutritional properties (Sturgeon and Ronnenberg, 2010; Tezcan et al., 2009), particularly the high nutritional value of its juice (Seeram et al., 2006). Similar to all other cultivated plants, pomegranate is susceptible to variation, and many of its forms have been considered as distinguished species (Hasnaoui et al., 2010a). Specific markers, such as simple sequence repeat (SSR) markers, and their development can facilitate studies on cultivar fingerprints, genetic diversity, evaluation of germplasm, and molecular proliferation of this economically important fruit species (Durgac et al., 2008; Zamani et al., 2007). To date, only a few specific codominant markers have been specified for pomegranate, and much work is required for identifying new markers (Hasnaoui et al., 2010b; >Pirseyedi et al., 2010). SSRs are extremely beneficial for cultivar determination, evaluation of genetic distance among organisms, and pedigree analysis (Priolli et al., 2002). SSRs also facilitate genetic diversity studies in various plants because of the abundance, codominant inheritance, and high polymorphism of these markers (Gupta et al., 1996). The current study aims to assess the genetic variability among the pomegranate varieties/cultivars in Duhok province using microsatellite analyses, as well as to determine the genetic diversity levels and genetic relationships in pomegranate varieties/cultivars based on the effectiveness of SSR analyses.
2. Materials and Methods
2.1. Sample Collection and DNA Extraction
Samples of pomegranate (P. granatum) leaves were collected from Duhok (nurseries from Directory of Agriculture). The varieties of pomegranate selected for the present study were sorsar rash vabi, dindik ger shreen, rawa duhok, duhoki, rawa mosle, sin aljamal, slami, shahraban, henar trsh, mlaise and armisht. DNA was isolated from fresh leaves of pomegranate plants following the CTAB procedure with few modifications (Doyle, 1990; Doyle, 1991).
2.2. PCR Amplification of SSR Primers
A total of 12 microsatellite primer pairs were selected from those previously reported (Hasnaoui et al., 2010; Hasnaoui et al., 2011; Soriano et al., 2010; Sergio et al., 2010).
The master mixture (23 μl) was added into 0.25 ml Eppendorf tubes, and 2 μl of DNA template of each sample was added to these tubes individually and mixed gently. Thus, each reaction mixture contains 2.5 µl of 10× PCR buffer in final concentration of 1× buffer, 2.5 mM MgCl2, 0.25 mM of each dNTP (10 mM prepared mixture), 0.2 µM of each primer (forward and reverse), 50 ng of DNA, 1 unit of Taq DNA polymerase (DreamTaq DNA Polymerase), and water, which was added to make a final volume of 25 µl. The tubes were placed in a thermocycler for amplification, which was run by specific programs that were previously updated; amplifications were performed separately for each primer pair. PCR products were visualized using 4% agarose gel and polyacrylamide gel electrophoresis. Both gels were stained with ethidium bromide.
The PCR programs of both group of selected primers include Group of Primers (Pom10, Pom 13, Pom 14, Pom 21, Pom 46, Pom 47, and Pom 55) (Hasnaoui et al., 2010; Hasnaoui et al., 2011). The touchdown program was used for the temperature profiles of the nine preselected primer pairs as follows: initial step of 3 min at 95 °C, followed by 10 touchdown cycles of 30 s at 94 °C, 40 s at 65 °C (−1 °C per cycle), 30 s at 72 °C, 25 cycles of 30 s at 94 °C, 30 s at 55 °C, and 40 s at 72 °C with final extension time of 8 min at 72 °C. The Group of Primers (Pg 33, Pg 38, Pg 91, Pg 101, and Aac1) (Soriano et al., 2010) was performed using the following temperature profiles: 94 °C for 2 min, 35 cycles of 94 °C for 30 s, and the optimized annealing temperature of each primer pair for 60 s and 72 °C for 1 min and 30 s, with final extension of 72 °C for 7 min.
2.3. Data Analysis
Based on the electrophoresis results, DNA fragments were scored as present (1) or absent (0) in allele size. Genetic diversity was analyzed based on these scores. To verify the potential of the selected markers and discriminate them among the germplasm accessions analyzed, as well as evaluate genetic diversity, various parameters were measured. POPGENE 4.2 software (Rousset, 2008) and CERVUS v.3.0.3 software 2006 (Marshal et al., 1998) were used to calculate the number of observed alleles per locus (Na), major allele frequency, observed heterozygosity (Ho), and expected heterozygosity (He). Expected heterozygosity was calculated using an unbiased formula from allele frequencies assuming Hardy–Weinberg equilibrium (HWE) (Nei, 1987; Equation 8.4). Expected heterozygosity was also used to evaluate deviation from HWE, in which all the results were adjusted for multiple simultaneous comparisons using sequential Bonferroni correction (Rice, 1989). To evaluate the informativeness of the microsatellites used, polymorphism information content (PIC) was calculated based on the allele frequencies of all the varieties analyzed (Weir, 1990). PIC was calculated as follows: ![]() , (this equation are attached in a picture )where Pij is the frequency of the jth allele for the ith marker locus and summation, which extends over n alleles. The NTSYS-PC (Numerical Taxonomy and Multivariate Analysis System) version 1.8 (Applied Biostatistics) program (Rohlf, 1993) was used for clustering and construction of dendrogram. The data were analyzed using the Similarity for Qualitative Data routine to generate genetic similarity index (Nei and Li, 1979) with the unweighted pair-group method with arithmetic mean (UPGMA).
, (this equation are attached in a picture )where Pij is the frequency of the jth allele for the ith marker locus and summation, which extends over n alleles. The NTSYS-PC (Numerical Taxonomy and Multivariate Analysis System) version 1.8 (Applied Biostatistics) program (Rohlf, 1993) was used for clustering and construction of dendrogram. The data were analyzed using the Similarity for Qualitative Data routine to generate genetic similarity index (Nei and Li, 1979) with the unweighted pair-group method with arithmetic mean (UPGMA).
3. Results and Discussion
3.1. Polymorphism of Microsatellites Markers
In this study, 12 loci (primers) yielded reproducible results, which were used to detect the genetic diversity among 11 pomegranate cultivars around Duhok province, including five populations (Duhok, Amed, Zaxo, mosel, and Akre). The overall results are presented in (Table 1). Overall data analysis revealed 25 alleles. This finding is low and varies between 1 and 4 with an average of 2.08 alleles per locus. The data revealed that five of the tested primers produced monomorphic banding patterns as follows: the primers (POM14, Pom 55, PG33, PG101, and PG AAC1), whereas seven loci (Pom 10, Pom 13, Pom 21, Pom 46, Pom 47, PG38 and PG91) showed polymorphic banding patterns.
The overall observed (Ho) and expected (He) heterozygosity frequencies ranged from 0.000 to 1.000 and 0.000 to 0.680, respectively. Given that (He) at a locus increases with increasing (Na) and equalizing allele frequencies, the criteria for low (He) and low (Na) were met for most loci (Alamuti et al., 2012). The PIC value ranged from 0.000 to 0.582 with an average of 0.2517. Botstein et al. (1980) defined any locus with a PIC ≥ 0.5 as highly polymorphic. In this study, only 1 out of the 12 loci (8.33%) met this criterion. This result agrees with the previous reports (Soriano et al., 2010; Pirseyedi et al., 2010; Ebrahimi et al., 2010).
These results suggest low-level polymorphism, and similar results have been reported in many other studies, in which SSRs were used to analyze genetic diversity in pomegranate. For example, Hasnaoui et al. (2010a) reported only 25 alleles with an average of 2.27 alleles per locus. These results were obtained using a set of 11 SSR primers to evaluate 27 pomegranate accessions sampled in Tunisia. Hasnaoui et al. (2011) also reported 34 alleles with an average of 2.83 alleles per locus from a set of 12 SSR primers, which were evaluated on 33 pomegranate accessions sampled in different pomegranate ecotypes around Tunisia. The same result also obtained from M.Sc. thesis of (Sinjare, 2013) which report only 31 alleles with an average of 2.82 per locus by using a set of 11 primers and evaluate 14 different cultivars in Kurdistan region/ Iraq. The results of this research also agree with those of other studies on the Tunisian pomegranate using different markers, such as RAPD (Hasnaoui et al., 2010b) and AFLP (Jbir et al., 2008). Similarly, low molecular diversity was found in pomegranate germplasm from Iran (Sarkhosh et al., 2006; Talebi-Baddaf et al., 2003) and the USA (Anonymous, 2005).
These results suggest that the cultivated pomegranate germplasm in Duhok, which is a diversification center of this crop, may share a common genetic bottleneck during domestication. The P. granatum genetic resources in Kurdistan apparently have been subjected to human selection for centuries.
The low number of polymorphic alleles may be attributed to the narrow genetic background/gene pool of local pomegranate resources (Stover and Mercure, 2007), which are usually propagated in a clonal manner. The results of low-level heterozygosity may also be ascribed to asexual propagation of pomegranate cultivars and/or vegetative propagation, which is a mode uniquely used for pomegranate cultivation. During the farmers’ empirical selection, only a small part of the genome coding for fruit traits (practically the only interesting agronomic characters) is involved. This finding is supported by the absence of wild pomegranate ecotypes, which have never been reported in Mediterranean countries. Therefore, the existing pomegranate cultivars were probably derived from few ancestors. The Mediterranean region is commonly considered as a secondary center of pomegranate diversity (Ranade et al., 2009), indicating that local genotypes may have limited origins from the earliest founded ones. Notably, allele richness is also determined by sample size. The present set of SSR markers is potentially helpful for molecular characterization of P. granatum germplasm in many areas worldwide, particularly in regions where high level of genetic diversity still exists, such as India, Iran, Central Asia, Middle East, and Spain.
These results may support the occurrence of synonymous mislabeling in P. granatum, suggesting a substantial amount of genetic redundancy in pomegranate collection. A high level of redundancy is a common problem in many plant germplasm collections (Engels and Visser, 2003; Zhang et al., 2009), which impede the accuracy and efficiency of conservation and utilization of plant genetic resources. Extensive exchange of pomegranate planting materials (cuttings) has occurred in Kurdistan, both among farms and among regions. Thus, cultivars are often named according to the places where the cuttings were collected for instance, ‘shahraban’ indicates that cuttings originated from shahraban and also may be the name is a characteristic feature of that pomegranate such as ‘sorsar rash vabe’ mean that the feature is near to red on light black color. This practice of cutting introduction can easily lead to duplication in the germplasm collection. Some of these closely related accessions may be derived from the same parents (Hasnaoui et al., 2011).
3.2. Genetic and Phylogenetic Relationships
The generated SSR profiles were further used to assess similarities among the studied cultivars. The estimation of genetic distance was accomplished using a computer software (NTSYS-PC version 1.8) based on the formula originally proposed by Nei and Li (1979). The results are presented in (Table 2). Genetic distances ranged from 0.0606 to 0.2683. The lowest genetic distance was found between ‘duhoki’ and ‘dindik ger shreen’ also ‘rawa duhok’. This low distance also found between ‘henar trsh’ with this cultivars ‘duhoki’ ‘rawa mosle’ ‘slami’ and ‘shahraban’suggesting their close relatedness.
The highest genetic distances were registered between ‘sorsar rash vabi’ with both cultivars ‘rawa mosle’ and ‘shahraban’. The high genetic distances present between these genotypes may suggest that they have originated from genetically divergent parents. Otherwise, they may suggest a long history of adaptation to their respective microclimatic regions. All the remaining cultivars shared intermediate genetic distance values. The genetic distances were supported by the resulting dendrogram (Figure 1), in which the three main groups could be identified. In this dendrogram, the genotypes were divided into different clusters, and the clustering was performed based on their geographical origin. In most cases, the clusters were not correlated with the morphological traits.
The dendrogram results and clustering analyses revealed poor genetic variations. The little divergence within pomegranate cultivars suggests the presence of a common genetic basis in the Duhok pomegranate germplasm despite morphological dissimilarities among ecotypes (Mars, 2001). This finding may be partly attributed to the insufficient SSR loci analyzed. The use of SSRs is strongly supported by many studies dealing with the usefulness of such markers for investigating pomegranate diversity (Soriano et al., 2011, and Hasnaoui et al., 2010b). The current research is one of the first attempts to use molecular markers in investigating the genetic relationships among various local pomegranate genotypes belonging to P. granatum grown in Duhok province.
This assumption is strongly supported by cultivar clustering, which is independently performed based on geographic origin. Moreover, continuous propagation of seeds for thousands of years and their selection by humans could have resulted in the diversity of pomegranate genotypes. This genetic diversity is an important resource that could be used to contribute to pomegranate breeding programs for different aims.
In conclusion, successful results were obtained by applying CTAB method for isolation of genomic DNA from pomegranate fresh leaves. Relatively large number of primers produced monomorphic banding patterns, suggesting low level of genetic variation. Despite low genetic distances between accessions further supported the inbreeding and low levels of genetic variation, the result indicated that the microsatellite markers used in this study are a very useful tool for all kinds of genetic studies in pomegranate.
Table 1. The overall result statistics of all primers used in this study were based on genpop software and cervus software for data analysis.
| Locus | Primer sequence (5’-3’) | No. of allele | Hobs | HExp | PIC | Size of alleles |
| POM 10 | F-CCTCATTGCTGATGAATCTT R-ACTCGAGAAGCTCTGTGAAG | 2 | 0.000 | 0.173 | 0.152 | 200-255 |
| POM 13 | F-CACACCCTTCATCAAAAGAT R-GGACTAACAACCAGCCATAG | 2 | 0.818 | 0.506 | 0.367 | 180-350 |
| POM 14 | F-CGCATTTGGTTGTAGAAGAC R-AGGAGCGTCTGTTTTAATCTT | 1 | 0.000 | 0.000 | 0.000 | 200 |
| POM 21 | F-GACTGGAAGAAGCAGAGACT R-GAAAAGGAAGTAGCAGAGCA | 4 | 0.273 | 0.680 | 0.582 | 185-220 |
| POM 46 | F-CTTCCTCCTACCGAACTATG R-CCCACTTTGACACTTCTACC | 3 | 1.000 | 0.567 | 0.436 | 205-300 |
| POM 47 | F-GCCTATCTCGTGATCACATC R-AATGGGAGCGGACTAACTAT | 3 | 0.364 | 0.325 | 0.282 | 200-290 |
| POM 55 | F-GAGACAATTGGGATCAGAAA R-AGTCGACGAACTGTGAAATC | 1 | 0.000 | 0.000 | 0.000 | 240-290 |
| PGCT033b FN677553 | F:TAATAAGCTGCCCCGAAGTC R:CGGTGATGTCCCTATTGGAG | 2 | 1.000 | 0.524 | 0.375 | 87-140 |
| PGCT038b FN677558 | F:CGTGCCAAATGGGTAAATAA R:AGAACTCCACGACCCATAAA | 2 | 0.182 | 0.173 | 0.152 | 250-265 |
| PGCT091b FN677611 | F:ATCAGAATTGGAATCGGAAC R:ACCGAGGTCATCGAACTAAA | 2 | 0.818 | 0.506 | 0.367 | 186-395 |
| PGCT101b FN677621 | F:GAACGCCAAATTCAAGAACC R:GACGATTCTTTCCTGCCTTG | 2 | 1.000 | 0.524 | 0.375 | 130-200 |
| PG AAC1 | F: GGGTCTTCCTAATTCTCTGG R:TACAACTTCGGACTCACTTGC | 1 | 0.000 | 0.000 | 0.000 | 165 |
| Average | 2.08 | 0.4545 | 0.3315 | 0.2517 | ______ |
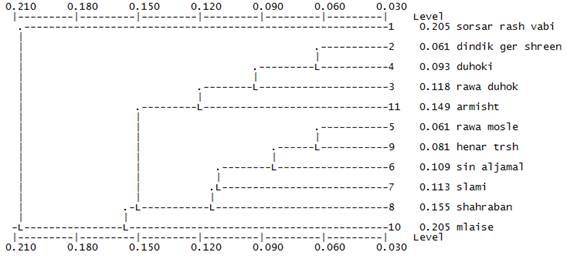
Figure 1. Dendrogram resulting from microsatellites based on genetic distance analysis of 11 pomegranate genotypes, estimated by Nei’s coefficient in pairwise comparisons. Cluster analysis was performed using UPGMA algorithm.
Table 2. Genetic similarity matrix based on SSR data among 11 pomegranate accessions estimated according to Jaccard’s method.
| 1 | 0 | ||||||||||
| 2 | 0.1252 | 0 | |||||||||
| 3 | 0.1942 | 0.1252 | 0 | ||||||||
| 4 | 0.1252 | 0.0606 | 0.0606 | 0 | |||||||
| 5 | 0.2683 | 0.1942 | 0.1942 | 0.1252 | 0 | ||||||
| 6 | 0.2064 | 0.1419 | 0.1419 | 0.1419 | 0.0813 | 0 | |||||
| 7 | 0.1942 | 0.1942 | 0.1942 | 0.1252 | 0.1252 | 0.1419 | 0 | ||||
| 8 | 0.2383 | 0.1942 | 0.1942 | 0.1252 | 0.1252 | 0.1419 | 0.1252 | 0 | |||
| 9 | 0.1942 | 0.1252 | 0.1252 | 0.0606 | 0.0606 | 0.0813 | 0.0606 | 0.0606 | 0 | ||
| 10 | 0.2380 | 0.1638 | 0.1638 | 0.0949 | 0.1638 | 0.1761 | 0.1638 | 0.1638 | 0.0949 | 0 | |
| 11 | 0.2380 | 0.1638 | 0.0949 | 0.0949 | 0.0949 | 0.1761 | 0.1638 | 0.1638 | 0.0949 | 0.2076 | 0 |
References
- Alamutia, M. K.; Zeinalabedini, M.; Derazmahalleh, M. M.; RoodbarShojaie, T.; Irandoost, H. P.; Zahravi, M.; Vazifehshenas, M.; Ebrahimi, M. A.; Nekouei, S. M.; Salekdeh, G. H. and Mardi, M. (2012).Extensive genetic diversity in Iranian pomegranate (Punica granatum L.) germplasm revealed by microsatellite markers. Scientia Horticulturae 146, 104–114.
- Anonymous, (2005). Report of the USDA national clonal germplasm respiratory (NCGR), Davis, CA. http://www.ars.usda.gov/sp2UserFiles/Place/53481500/reports/2005AnnualReport_Davis.pdf 2005.
- Botstein, D, White, RL, Skolnick, M and Davis, RW (1980). Construction of a genetic linkage map in man using restriction fragment length polymorphisms. Amer. J. of Human Genetics 32, 314-331.
- Doyle, J. J. and Doyle J. L. (1990). A rapid total DNA preparation procedure for fresh plant tissue. Focus 12:13-15.
- Doyle, J. J. (1991). DNA protocols for plants. pp. 283-293 in: G. Hewitt, A. W. B.Johnson, and J. P. W. Young (eds.), Molecular Techniques in Taxonomy. NATO ASI Series H, Cell Biology Vol. 57.
- Durgac, C.; Özgen, M.; Simsek, Ö.; Kacar, A.Y.; Kıyga, Y.; Celebi, S.; Gündüz, K. and Serce, S. (2008). Molecular and pomological diversity among pomegranate (Punica granatum L.) cultivars in Eastern Mediterranean region of Turkey. Afr. J. Biotechnol. 7, 1294–1301.
- Ebrahimi, S.; Ebrahim, B. S. and Sharifnabi, B. (2010). Microsatellite isolation and characterization in pomegranate (Punica granatum L.). Iranian J. of Biotech. 8(3); 156-163.
- Engels, J.M.M. and Visser, L. (2003). A guide to Effective Management of Germplasm Collections. P. 174
- Gupta, P.K.; Balyan, H.S.; Sharma, P.C. and Ramesh, B. (1996). Microsatellites in plants: a new class of molecular markers. Curr. Sci. 70:45–54.
- Hasnaoui, N.; Mars, M.; Chibani, J. and Trifi, M. (2010a). Molecular Polymorphisms in Tunisian Pomegranate (Punica granatum L.) as Revealed by RAPD Fingerprints. Diversity 2: 107-114.
- Hasnaoui, N.; Buonamici, A.; Sebastiani, F.; Mars, M.; Trifi, M. and Vendramin, G. G. (2010b). Development and characterization of SSR markers for pomegranate (Punica granatum L.) using an enriched library. Conservation Genet Resources. 2(1):283-285.
- Hasnaoui, N.; Buonamici, A.; Sebastiani, F.; Mars, M.; Zhang, D. and Vendramin G. G. (2011). Molecular genetic diversity of Punica granatum L. (pomegranate) as revealed by microsatellite DNA markers (SSR). Elsevier B.V. Gene 493(1): 105-112.
- Holland, D.; Hatib, K. and Bar-Ya'akov, I. (2009). Pomegranate: botany, horticulture, breeding. Hortic. Rev. 35, 127–191.
- Huang, Y. and Shi, S. (2002). Phylogenetics in the Lythraceae sensu lato: A preliminary analysis based on plastic rbcL and psaA-ycf3 spacer, and ITS of nrDNA sequences. Inte. J. of Plant Sci. 163:215–225.
- IPGRI, (2002). Neglected and Underutilized Plant Species: Strategic Action Plan of the International Plant Genetic Resources Institute. International Plant Genetic Resources Institute, Rome, Italy. P. 27
- Jbir, R.; Hasnaoui, N.; Mars, M.; Marrakchi, M. and Trifi, M. (2008). Characterization of Tunisian pomegranate (Punica granatum L.) cultivars using amplified fragment length polymorphism analysis. Sci. Hort. 115, 231–237.
- Mars, M. (2001). Ressources génétiques du grenadier (Punica granatum L.) en Tunisie: prospection, conservation et analyse de la diversité. Thèse d'état, Faculté des Sciences de Tunis, Tunisia.
- Marshal, T.C.; Slate, J.; Kruuk, LEB.; Pemberton, J.M. (1998).Statistical confidence for likelihood-based paternity inference in natural populations. Mol. Ecol. 7, 639–655.
- Nei, M. (1987). Molecular Evolutionary Genetics. Columbia University Press: New York.
- Nei, M. and Li, W. H. (1979). Mathematical moder for studding genetic variation in terms of restriction endonuclease. Proc. Nat. Acad. Sci. U.S.A. 74:5269-5273
- Pirseyedi, S.M.; Valizadehghan, S.; Mardi, M.; Ghaffari, M.R.; Mahmoodi, P.; Zahravi, M.; Zeinalabedini, M. and Nekoui, S.M.K. (2010). Isolation and characterization of novel microsatellite markers in pomegranate (Punica granatum L.). Int. J. Mol. Sci. 11 (5), 2010–2016.
- Priolli, R.H.G.; Mendes-Junior, C.T.; Arantes, N.E. and Contel, E.P.B. (2002). Characterization of Brazilian soybean cultivars using microsatellite markers. Genet Mol Biol. 25: 185-193.
- Ranade, S.A.; Rana, T.S. and Narzary, D. (2009). SPAR profiles and genetic diversity amongst pomegranate (Punica granatum L.) genoypes. Physiol. Mol. Biol. Plants, 15, 61–70.
- Rice, W.R. (1989) Analyzing tables of statistical tests. Evolution: Int. J. Org. Evol. 43, 223–225.
- Rohlf, F. J. (1993). NT SYS-PC. Numerical Taxonomy and Multivariate Analysis System. Version 1.8 Exter Software, Setauket, New York, U.S.A.
- Rousset, F. (2008). Genepop'007: a complete reimplementation of the Genepop software for Windows and Linux. Mol. Ecol. Resources 8: 103-106.
- Sarkhosh, A.; Zamani, Z.; Fatahi, R. and Ebadi, A. (2006). RAPD markers reveal polymorphism among some Iranian pomegranate (Punica granatum L.) genotypes. Sci. Hortic. 111, 24–29.
- Seeram, N. P.; Schulman, R. N. and Heber, D. (2006). Pomegranate: ancient roots to modern medicine. CRC Press &Taylor and Francis Group, Boca Raton, FL, USA. pp. 5-7
- Sergio, C.; Marco, C.; Gaetano, D.; Alessandra, G. and Stefano La, M. (2010). New microsatellite loci for pomegranate, punica granatum (lythraceae). AJB Primer Notes and Protocols in the Plant Sciences, American Journal of Botany, 58–60.
- Sinjare D.Y. (2013). Microsatellite application and genetic characterization of Pomegranate (Punica granatum L.) in Duhok Province/ Kurdistan Region- Iraq. A thesis of M.Sc.
- Soriano, J.M.; Zuriaga, E.; Rubio, P.; Llácer, G.; Infante, R. and Badenes, M.L. (2010). Development and characterization of microsatellite markers in pomegranate (Punica granatum L.). Molecular Breeding, 27, 119–128.
- Still, D.W. (2006). Pomegranate: a botanical perspective. In: Seeram, N.P., Schulman, R.N., Heber, D. (Eds.), Pomegranates: Ancient roots to modern medicine. CRC Press, Taylor and Francis, Florida, pp. 199- 209.
- Sturgeon, S.R. and Ronnenberg, A.G. (2010). Pomegranate and breast cancer: possible mechanism of prevention. Nutr. Rev. 68, 122–128.
- Talebi-Baddaf, M.; Sharifi-Neia, B. and Bahar, M. (2003). Analysis of genetic diversity in pomegranate cultivars of Iran, using Random Amplified Polymorphic DNA (RAPD) markers. Proceedings of the Third National Congress of Biotechnology, Iran, pp. 343–345.
- Tezcan, F.; Gültekin-Özgüven, M.; Diken, T.; Özçelik, B. and Erim F.B. (2009). Antioxidant activity and total phenolic, organic acid and sugar content in commercial pomegranate juices. Food Chem. 115, 873–877.
- Townsend C.C. and Guest E. (1964). Flowra of Iraq. Ministry of agriculture.
- Weir, B.S. (1990). Genetic data analysis. Methods for discrete genetic data. Sinauer Associates, Suderland. P. 445.
- Zamani, Z.; Sarkhosh, A.; Fatahi, R. and Ebadi, A. (2007). Genetic relationships among pomegranate genotypes studied by fruit characteristics and RAPD markers.J. Hortic. Sci. Biotechnol, 82; 11-18.
- Zhang, D.; Mischke, S.; Johnson, E.S.; Philips-Mora, W. and Meinhardt, L., (2009). Molecular characterization of an international cacao collection using microsatellite markers.Tree Genet. Genomes,5, 1–10.


