International Journal of Chemical and Biomolecular Science, Vol. 1, No. 3, October 2015 Publish Date: Aug. 26, 2015 Pages: 153-157
Physicochemical Characteristics and Pigment Content of Algerian Olive Oils: Effect of Olive Cultivar and Geographical Origin
Ouassila Zegane1, Sonia Keciri2, Hayette Louaileche1, *
1Laboratory of Applied Biochemistry, Faculty of Life and Natural Sciences, University of Bejaia, Bejaia, Algeria
2Technical Institute of Arboriculture of Fruits and Vine (TIAFV), Bejaia, Algeria
Abstract
The present work presents a preliminary characterization of Chemlal extra-virgin olive oils from four locations in Algeria (Biskra, Bouira, Skikda and Oran), and oils of three olive cultivars (Tableout, Sigoise, Frantoio) form Biskra, South of Algeria. Quality indices including free fatty acid content, peroxide value and spectophotometric indices (K232 and K270) and pigment (chlorophylls and carotenoids) contents of the investigated oils were evaluated. Our results revealed that the levels of the analyzed parameters were within the limits established for the highest quality category "extra virgin" olive oils. The cultivar and the geographical origin of the oil samples have a statistically significant influence on both chlorophyll and carotenoid contents. Chlorophyll content varied between 0.84 (Chemlal from Skikda) and 2.89 mg/Kg (Chemlal from Biskra) while the carotenoid levels ranged from 0.7 (Chemlal from Oran and Frantoio from Biskra) to 1.7 mg/Kg (Chemlal and Sigoise from Biskra).
Keywords
Cultivar, Quality Indices, Virgin Olive Oil, Carotenoids, Chlorophylls
Received: July 10, 2015
Accepted: August 10, 2015
Published online: August 26, 2015
@ 2015 The Authors. Published by American Institute of Science. This Open Access article is under the CC BY-NC license. http://creativecommons.org/licenses/by-nc/4.0/
1. Introduction
Olive cultivation is widespread throughout the Mediterranean region and is important for the rural economy, local heritage and environment (Gargouri et al., 2013). It represents a typical lipid source of the Mediterranean diet. A part of the beneficial effects of the Mediterranean diet may be due to the presence of "minor components", such as olive oil-derived ortho-diphenols, that exhibit biologically relevant activities. The increasing popularity of olive oil is mainly attributed to its high content of oleic acid, which may affect the plasma lipid/lipoprotein profiles, and its richness in phenolic compounds, which act as natural antioxidants and may contribute to the prevention of human diseases (Visioli and Galli, 2001; Cicerale et al., 2009). Nevertheless, there is scarce information available on the influence of cultivar and geographical origin on olive oil quality produced in Algeria.
The study of the qualitative characteristics of virgin olive oils of a pure cultivar or from a specific production area is of great scientific interest. It is also of interest to the local industrial sector, to the international olive oil business and to the consumer, who demands more information on the qualitative characteristics and properties of traditional local products.
Algeria, one of the main producers of olive oil in the world, has a wide range of cultivars. Many studies on Algerian olive oil characterization have been carried out. However, there is no report about oil of olive cultivars growing in arid zone of Biskra in Algeria. Consequently, the aim of the current work is to investigate the effects of growing region on some quality characteristics (free fatty acid content, peroxide index, coefficients K270 and K232) and chlorophyll and carotenoid contents of oil of the most important Algerian cultivar (Chemlal) and to compare oils of three cultivars (Frantoio, Sigoise and Tableout) growing in Biskra, the arid zone in south Algeria.
2. Materials and Methods
2.1. Samples
Olive fruits from four cultivars (Chemlal, Tableout, Sigoise and Frantoio) harvested from Biskra (Algeria), and fruits of Chemlal cultivar, the most widespread in Algeria, harvested from four locations (Bouira, Biskra, Skikda, and Oran, Algeria), were used for the oil extraction. The extracted oils were stored in the dark in amber glass bottles at 4 °C until analysis.
2.2. Quality Indices Determinations
Determination of free fatty acid content, peroxide value (Pv) and UV absorption characteristics was carried out according to the analytical methods described in European Union Commission Regulation EEC/2568/91 (EEC, 1992).
Free fatty acid content, given as percentage of oleic acid, was determined by titration of a solution of oil dissolved in ethanol/ether (1:1, v/v) with ethanolic potassium hydroxide.
Peroxide value, expressed in milli-equivalents of active oxygen per kg of oil (meq/kg), was determined as follows: a mixture of oil sample and chloroform/acetic acid 2:3 (v/v) was left to react with a saturated solution of potassium iodide in the dark; the free iodine was then titrated with a sodium thiosulfate solution.
K232 and K270 extinction coefficients were calculated from absorption at 232 and 270 nm, respectively, with a spectrophotometer using a 1% solution of oil in cyclohexane and a path length of 1cm.
Pigment contents were determined according to Minguez-Mosquera et al. (1991). Olive oil (7.5 g) was dissolved in 25 ml of cyclohexane. The absorbance was measured at 470 (A470) and 670 nm (A670). Values of the extinction coefficients applied were E0=613 for pheophytin a and E0=2000 for lutein. Pigment contents were calculated as follows:
Chlorophylls (mg/kg) = (A670x106)/ (613 x 100x d)
Carotenoids (mg/kg) = (A470x106)/ (2000x100xd)
d is the spectrophotometer cell thickness (1 cm).
The chlorophyll and carotenoid concentrations are expressed as mg of pheophytin a and lutein per Kg of oil, respectively.
2.3. Statistical Analysis
All parameters were determined in triplicate. The data reported were subjected to analysis of variance and were expressed as mean ± standard deviation (SD) of three measurements. Significant differences between values of all parameters were determined at p≤0.05 according to the least significant difference (LSD) test using the Statistica 5.5 software.
3. Results and Discussion
3.1. Titratable Acidity
Table 1. Physicochemical characteristics of the olive oils.
| Quality index | Chemlal Bouira | Chemlal Oran | Chemlal Skikda | Chemlal Biskra | Tableout Biskra | Sigoise Biskra | Frantoio Biskra | EVOO* |
| Acidity (% oleic acid ) | 0.17cd ±0.02 | 0.15e ±0.005 | 0.42a ±0.01 | 0.23b ±0.010 | 0.16c ±0.005 | 0.18d ±0.010 | 0.14e ±0.005 | ≤0.8 |
| Peroxide value (meq O2/kg) | 4.67 c ±0.29 | 3.80d ±0.07 | 10.00a ±0.87 | 4.17cd ±0.14 | 3.04e ±0.07 | 7.08b ±0.019 | 4.42cd ±0.14 | ≤20 |
| K232 | 1.77bc ±0.0 | 1.78bc ±0.03 | 2.18a ±0.0 | 2.19 ±0.02a | 1.83bc ±0.0 | 2.20a ±0.03 | 1.80bc ±0.06 | ≤2.5 |
| K270 | 0.05f ±0.002 | 0.11d ±0.006 | 0.17c ±0.004 | 0.24a ±0.017 | 0.19b ±0.006 | 0.18bc ±0.014 | 0.10e ±0.01 | ≤0.22 |
a-f: Within a row, different letters indicate significant differences (p≤0.05).
* EVOO: extra virgin olive oils (International Olive Council, 2010).
Titratable acidity of oils is usually expressed as percent of free fatty acid content on the basis of oleic acid. Free acidity is not only an important quality factor, but also has been extensively used as a traditional criterion for classifying olive oil in various commercial grades (Salvador et al., 2000). Titratable acidity of the investigated olive oils varied depending on the samples. The free fatty acid content of the analyzed oils ranged from 0.14% to 0.42% and did not exceed the standard limit of 0.8%, indicating that these oils could be labeled as extra virgin. The lowest acidity was found for the oil of Frantoio cultivar from Biskra, while the highest value was recorded for the oil of Chemlal cultivar from Skikda (Table 1). There are significant differences (P<0.05) between the examined cultivars (Chemlal, Sigoise, Tableout and Frantoio) from Biskra. The results indicate that the order of acidity data was as follows: Chemlal Skikda > Chemlal Biskra > Tableout Biskra > Chemlal Bouira > Sigoise Biskra> Chemlal Oran= Frantoio Biskra.
The results obtained for the free fatty acid content of the oils of Chemlal cultivated in four locations were significantly different and were in good agreement with those obtained by Abu-Reidah et al. (2013) who indicated that the values of the acidity of Palestinian olive cv. Nabali cultivated in different locations vary from 0.33% to 0.51%. In fact, the low values of acidity recorded in the current study were due the use of fresh and healthy olive fruits, to great care used in the handling and processing of these oils. It is known that the increase of free acidity is mainly due to enzyme activity caused by olive tissue damage.
3.2. Peroxide Values
The peroxide value of oils is an important indicator of oxidation rate; this parameter is expressed as meq O2/kg oil. It evaluates the hydroperoxide content and offers an assessment of the progress state of the different stages that lead to oil rancidity. As indicated in Table 1, all the studied oil samples presented peroxide values below the limit of 20 meq of oxygen/kg of oil, which is accepted as the limit for extra-quality virgin olive oil category (International Olive Council, 2010). In the samples under study, the peroxide values range from 3.04±0.07 (Tableout from Biskra) to 10.00±0.87 meq O2/kg oil (Chemlal from Biskra). There were statistically significant differences between the peroxide values of the studied cultivars from Biskra growing area. Thus, as reported by other authors (Noorali et al., 2014), olive cultivar has an important effect on this parameter. The values of peroxide index revealed also significant differences between the areas of plantation (Table 1). The olive oil of the cultivar Chemlal from Skikda had higher peroxide value than that of Chemlal from Oran, which was in accordance with findings of Abu-Reidah et al. (2013) and Noorali et al. (2014).
3.3. Ultraviolet Absorption Indices
Absorbance at specific wavelengths in the UV a more delicate indicator of oxidation, is related to the presence of conjugate diene and triene systems (ultraviolet absorbance at 232 and 270 nm, respectively are conventionally indicated by K232 (an indication of conjugated polyunsaturated fatty acids in olive oil), and K270 (an indication of carbonylic compounds: aldehydes and ketones) (Noorali et al., 2014).
With respect to the values of K232 and K270, they range between 1.77-2.20 and 0.05-0.24, respectively (Table 1). These values are in agreement with the levels established for the highest quality category ‘‘extra virgin’’ olive oil (International Olive Council, 2010). The low values of K232, K270, also confirmed the good overall quality of the investigated olive oils.
3.4. Chlorophyll and Carotenoid Contents
Carotenoids and chlorophylls are the main pigments found in vegetable oils. In olive oils, the major components in the carotenoid and chlorophyll fractions are lutein and pheophytin, respectively. Virgin olive oil has a colour from green-yellow to gold. The total pigment content of olive oils is an important quality parameter because it correlates with colour, which is the first attribute of virgin olive oil evaluated by consumers (Gargouri et al., 2013). Also, the presence of natural pigments is relevant to the food with regards to product stability. Carotenoids are strong protectors against photosensitized oxidation. Szydłowska-Czerniak et al. (2011) indicated that there is a significant (p<0.001) positive correlation between antioxidant potential and total carotenoid content of palm oils, with a correlation coefficient of 0.98.
As can be seen in figures 1 and 2, the content of pigments varied significantly depending on the olive cultivar. Chlorophylls and carotenoids were found to be at concentrations between 0.84 and 2.89 mg/kg, and 0.67 and 1.70 mg/kg, respectively. For Chemlal cultivar, the geographical origin had a significant (p≤0.05) influence on the chlorophyll and carotenoid contents. In fact, Chemlal olive oil from the south (Biskra) was distinguished from the others by its higher level of total chlorophylls and carotenoids (2.89 and 1.70 mg/kg, respectively). Olive oil of Chemlal from Skikda contained the lowest level of chlorophylls (0.84 mg/kg). The pigments were found in oil of Frantoio from Biskra at a less concentration (1.07 and 0.68 mg/kg respectively, for chlorophylls and carotenoids). The contents of pigments in our samples are lower than the ranges reported by Minguez-Mosquera et al. (1991), with amounts of 1–54.4 mg/kg and 2.6–22.5mg/kg for chlorophylls and carotenoids, respectively.
According to Šarolić et al. (2015), chlorophyll and carotenoid content of Croatian olive oils ranged from 3.86 to 4.75 mg/kg and from 1.89 to 2.06 mg/kg, respectively. Our results are in agreement with the findings of Guerfel et al. (2009) and Issaoui et al. (2010) who reported that the level of the pigments in the oil depends on several factors, such as the olive cultivar, and the cultivation location of the olive trees. The pigment variability is mainly due to genetic factor that determines changes in the biosynthetic pathway.
Natural pigments can also affect considerably the preservation of the product as prooxidant. In particular, the chlorophylls in presence of the light act as catalysts in the formation of singlet state oxygen and therefore they promote the first phases of the autoxidation process (Cichelli and Pertesana, 2004).
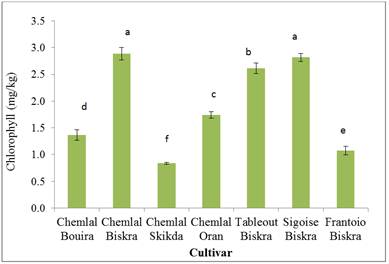
Figure 1. Chlorophyll content of olive oils.
(a–f) Different letters indicate statistically significant differences (p < 0.05) between cultivars.
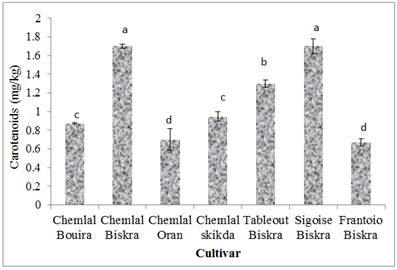
Figure 2. Carotenoid content of olive oils.
(a–f) Different letters indicate statistically significant differences (p < 0.05) between cultivars.
4. Conclusion
To the best of our knowledge, this is the first study on the characterization of olive oil of Chemlal cultivar harvested from different Algerian locations. The analytical parameters studied including free acidity, peroxide index, and spectrophotometric absorption K232 and K270 were within the limits established by the International Olive Council (2010) for the highest quality category "extra virgin" olive oils. In addition, the studied qualitative characteristics and pigment contents were significantly influenced by the olive cultivar and the geographical origin of the samples.
References
- Abu-Reidah I., Yasin M., Urbani S., Servili M., andMontedoro G. 2013. Study and characterization of Palestinian monovarietal Nabali virgin olive oils from northernWest Bank of Palestine. Food Research International, 54: 1959–1964.
- Cicerale S., Conlan X.A., Sinclair A.J. and Keast R.S.J. 2009. Chemistry and health of olive oil phenolics. Critical Reviews in Food Science and Nutrition, 49: 218-236.
- Cichelli A. and Pertesana G. P. 2004. High-performance liquid chromatographic analysis of chlorophylls, pheophytins and carotenoids in virgin olive oils: chemometric approach to variety classification. Journal of Chromatography A, 1046: 141–146.
- EEC. 1992. European Union Commission. Regulation EEC/1429/92 amending Regulation EEC2568/91 on the characteristics of olive oil and olive residue oil and on the relevant methods of analysis.Official Journal of European Communities. L150: 17–20.
- Gargouri B., Ammar S., Zribi A., Ben Mansour A and Bouaziz M. 2013. Effect of growing region on quality characteristics and phenolic compounds of chemlali extra-virgin olive oils. Acta Physiologiae Plantarum, 35: 2801–2812.
- Guerfel M, Ouni Y., Taamalli A., Boujnah D., Stefanoudaki E. and Zarrouk M.2009.Effect of location on virgin olive oils of the two main Tunisian olive cultivars.European Journal of Lipid Science and Technology, 111: 926–932.
- International Olive Council.2010. Norme commerciale applicable aux huiles d’olive et aux huiles de grignons d’olive.Olivae,113:35-45.
- Issaoui M., Flamini G., Brahmi F., Dabbou S., Ben Hassine K., Taamali A., Chehab H., Ellouz M., Zarrouk M.andHammamia M.Effect of the growing area conditions on differentiation between Chemlaliand Chétoui olive oils. 2010. Food Chemistry, 119: 220–225.
- Kandylis P., Vekiari A.S., Kanellaki A.S., Vekiari M., Kanellaki N., Grati Kamoun M., Msallem M. andKourkoutas Y. 2011. Comparative study of extra virgin olive oil flavor profile of Koroneiki variety (Olea europaea var. Microcarpa alba) cultivated in Greece and Tunisia during one period of harvesting. Food Science and Technology,44: 1333-1341.
- Minguez-Mosquera, M. I., Rejano, L., Gandul, B., Sanchez, A. H.andGarrido J. 1991.Color-pigment correlation in virgin olive oil.Journal of American Oil andChemical Society, 68: 332–336.
- Noorali M., Barzegar M and Sahari M.A. 2014. Sterol and fatty acid compositions of olive oil as an indicator of cultivar and growing area.Journal of American Oil andChemical Society,91:1571-1581.
- Salvador M.D., Aranda F., Gomez-Alonson S. and Fregapane G.2000. Quality characteristics of Cornicabra virgin olive oil. Res advance in oil chem.1: 31-39.
- Salvador M.D., Aranda F. and Fregapane G.2001. Influence of fruit ripening on ‘Cornicabra’ virgin olive oil quality: A study of four successive crop seasons. Food Chemistry, 73: 45-53.
- Šarolić M., Gugić M., Friganović E., Giovanni Tuberoso C.I. and Jerković I. 2015. Phytochemicals and other characteristics of Croatian monovarietal extra virgin olive oils from Oblica, Lastovka and Levantinka varieties.Molecules, 20: 4395-4409.
- Szydłowska-Czerniak A.,Trokowski K., Karlovits G.andSzłyk E. 2011. Effect of refining processes on antioxidant capacity, total contents of phenolics and carotenoids in palm oils. Food Chemistry, 129:1187–1192.
- Visioli F. and Galli C. 1998. The effect of minor constituents of olive oil on cardiovascular disease: New findings. Nutrition Reviews, 56:142–147.


