
International Journal of Chemical and Biomolecular Science, Vol. 1, No. 3, October 2015 Publish Date: Jul. 29, 2015 Pages: 90-95
Electronic Structure and Properties of Neutral and Charged AlnGan (n=1-12) Clusters: The Density Functional Theory Study
Naying Liu, Ling Guo*, Zhaoru Cao, Xiaoyu An, Aixia Li
School of Chemistry and Material Science, School of Modern Arts and Sciences, Shanxi Normal University, Linfen, China
Abstract
The density functional calculation with the generalized gradient approximation is applied to study the structural, properties of AlnGan clusters up to n=12. At the same time the frequency was performed when the structure optimization in order to assure the calculated-ground states were real low-lying. The nearest-neighbor distance, total energy, electron affinities and HOMO-LUMO gap were presented and discussed to prove the calculations. Some magic clusters in neutral, cationic, and anionic form compared to its neighboring clusters are argued according to the calculated results of the second energy difference and electronic properties.
Keywords
Aluminum Gallium Cluster, Density-Function Theory, Frequency Analysis
Received: June 16, 2015
Accepted: July 3, 2015
Published online: July 29, 2015
@ 2015 The Authors. Published by American Institute of Science. This Open Access article is under the CC BY-NC license. http://creativecommons.org/licenses/by-nc/4.0/
1. Introduction
In recent study, the structural and electronic properties of small clusters has become a subject of academic, scientific, and technological interest [1-2]. A mental cluster consists of two or more elements; the atomic arrangement becomes an additional factor which must be taken into account since a small change in the stoichimetry of the cluster can drastically affect its properties [3]. The study of bimetallic clusters or alloy clusters offer a suitable tool to receive a deeper understanding of microscopic behavior, since cluster science enables one to investigate chemical and physical properties starting from a single atom or molecular level toward bulk phase as a function size. As a result, a number of studies of alloy clusters have been preceded during recent years [4-8]. In the past decades, numerous experimental and theoretical studies have been carried out on semiconductor clusters and bimetallic clusters. The initial input structure is quoted previously published articles of the (AlP)n, (AlAs)n, (InSb)n and (AlN)n [9-12] and replace some of the atoms, or arbitrarily constructed, and then fully optimized through density functional theory (DFT). Thus an intensive learning on the properties of such clusters as a chemistry action of their size could pay increasing attention about the evolution from molecular toward bulk phase. We will calculate the aspects contain the evolution of the average nearest-neighbor distance, binding energy, the second energy difference, ionization potential, electron affinity and HOMO–LUMO gap.
We have organized the rest of the paper as follows: methodology is discussed in section 2; the rest results are discussed in section 3; and section 4 contains a summary of the conclusions.
2. Methodology
All calculations were performed using the density functional theory (DFT) provided by the Gaussian 03 suite of programs [13]. The density functional is treated with the generalized gradient approximation (GGA) corrected-exchange potential of the B3LYP [14]. We used DFT computations employing the LANL2DZ basis set alongside the corresponding relativistic effective-core potential (ECP) [15]. The specific basis set has been extensively used in the past [16-18] for the study of transition metal clusters with the results indicating that it is adequate for the description of their geometric and electronic properties. For the lowest-energy configurations, frequencies were computed using numerical differentiation of gradients computed in slightly displaced geometries. All of the obtained most stable clusters ate characterized as energy minima without imaginary frequencies.
3. Result and Discussions
3.1. Equilibrium Geometries, Nearest-Neighbor Distances
We have performed calculations on geometries and energetic of aluminum-gallium clusters using the method mentioned above. We first discuss the geometries of the neutral clusters. For the AlGa dimmer with C∞v symmetry, the bond length is 3.212 Å .The ground state structure of (Al2Ga2) cluster is a planar rhombic structure appearing Al and Ga atom alternately with D2h symmetry. The optimized Al-Ga bond length is 2.835Å, and the Al-Ga-Al bond angle is 90.10°. The Ga-Al-Ga bond angle is 89.9°. It is showed that the structure is more like a square.
For Al3Ga3, the most stable structure is like a prism structure with Cs symmetry. The central Al-Ga bond length is 2.737Å and it is more 0.036Å longer than the side Al-Ga bond length. The central Ga-Al-Ga bond angle is 83.719° and the below Al-Ga-Al bond angle is 80.397°. It is shift its structure into spatial structure. The structure of Al3Ga3 is different with the structure of Al3As3[10].
The lowest-energy configuration of Al4Ga4 is rhombic prism with C2v symmetry. The planar Al-Ga bond length is 2.871Å, the vertical Al-Ga bond length is 2.653Å and the planar Ga-Al-Ga bond is an acute angle of 60.30°, the other Al-Ga-Al bond angle is 117.26°. The geometry is similar with the structure of Al4P4 [9]. It is also show that the structure is alternate Al atom and Ga atom.
For the Al5Ga5, the most lowest-energy configuration is the oblique prism capped two atoms Al and Ga in one position with Cs symmetry. The most stable structure of Al6Ga6 is formed by a pentagonal and a hexagon distortion dropped one Al atom inner side with Cs symmetry.
Dropped one Al atom at the center of the hexagon and distorted heptagon with Cs symmetry have the lowest energy of the Al7Ga7 structure, the AlnGan (n=8-11) take the Cs, C3v and Cs structures according to their ground states respectively.
The ground-state configuration of Al12Ga12 is like a distorted hexahedron. The Al and Ga atoms alternately displayed.
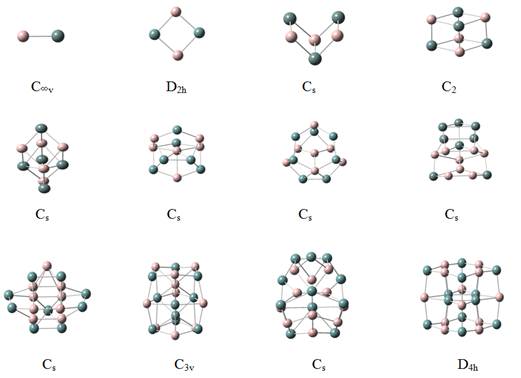
Figure 1. Ground state geometries of neutral and anionic aluminum gallium clusters containing 2-24 atoms. Gray and black balls are used for Al and Ga respectively. Point symmetry labels for the isomers are also shown.
Unlike in the bulk where the nearest-neighbor distance is well defined, the lack of a perfect structural symmetry in clusters makes it difficult to assign a unique nearest-neighbor distance for each cluster. For example, the nearest-neighbor distance is easy to define in AlGa, Al2Ga2, Al3Ga3, and Al4Ga4 in that these molecules are high symmetric. In Al5Ga5 and subsequent clusters, however, the nearest-neighbor distances vary within a narrow range. For example, the ‘nearest’-neighbor distances in Al5Ga5 range between 2.557Å and 3.091Å. I define an atom to be counted as a nearest-neighbor if its distance is less than 3.300Å. This cutoff was arrived at by examining all the interatomic distances in the clusters studied and by noting that there was a distinct gap in these distances beyond 3.300Å. In Al6Ga6 to Al12Ga12, the nearest-neighbor distances lie in the range 2.604–2.961Å, 2.599–3.014Å, 2.608–3.086Å, 2.592–3.064Å, 2.712–3.041 Å, 2.631–3.192 Å, 2.622–2.940 Å , respectively. In the Figure 1. All bonds having lengths of 3.300 Å or less is connected.
In order to study the evolution of the nearest-neighbor distance, I have calculated the average nearest-neighbor distance by using the following expression:
![]()
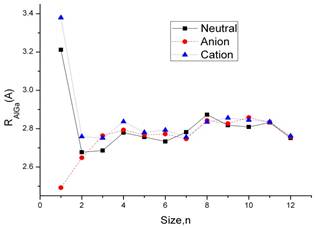
Figure 2. Average nearest-neighbor distance (Rnn, in Å) ad a function of cluster size for neutral (solid line), anionic (dashed line), and cationic (dotted line) aluminum gallium clusters.
Here Rij is the distance between two atoms i and j with a cutoff = 3.2 Å and nb is the total number of bonds between atoms that below this cutoff. The results are plotted in Figure 2. In the curve,the trend of neutral and anion is similar. The distance of AlGa cation is 2.49 Å. With the cluster size increase the average nearest-neighbor distance of the molecular is similar.
3.2. Binding Energy and Relative Stability
The relative stability of clusters can be studied through the measurement of the mass ion intensities. However, interpretation of these results is not always unambiguous. Note that in mass spectroscopy experiments the clusters have to be ionized before their intensities can be measured. It is not entirely clear if the measured intensity distribution of the clusters represents the stability of the charged clusters or their neutral precursors. For example, if the mass spectra are collected after the ionized clusters have time to relax to their stable configuration, the corresponding mass-ion intensities could be different from the neutral precursors; one has to assume that the charged clusters are formed by single photon ionization and that there are no photo-induced fragmentations of the clusters in the process. These difficulties are manifested in experimental observations that differ from one group to another.
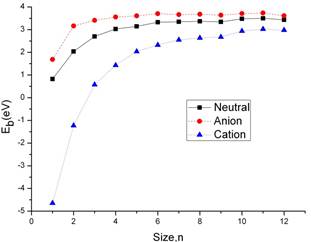
Figure 3. Binding energy per molecule, Eb (in eV) as a function of cluster size for neutral (solid line), anionic (dashed line), and cationic (dotted line) aluminum gallium clusters.
An unambiguous insight into the relative stability of clusters can be gained by analyzing their enenrgy. I first calculate the average binding energy per AlGa pair of neutral clusters. This is defined by Eb(AlGa) = [E(AlnGan)−nE (Al)−nE(Ga)]/n, where E(AlnGan) is the total energy of the neutral cluster (given in Table 1), Whereas in the anionic clusters the negative charge is assigned to a Ga atom in the atomic references, since Ga is more electronegative than Al. And in the cationic clusters, the positive charge is assigned to an Al atom. In Figure 3. I have plotted the average binding energy per AlGa pair, Eb, as a function of the number of AlGa units in the cluster, n. Eb displays the expected behavior, in both neutral and ionic systems: we can see an increasing curve along with the clusters size adding atoms. When the clusters size is small, n≤6 the slop is large which can be shown in the fig 4. While n≥6 of the size, the curve become gradually flat with a small increase of the binding energy. The image show a message that with the clusters size increasing the clusters may approach to the stationary bulk regime. The evolution of the binding energy per molecule with the cluster size is similar for the anion cluster and cation cluster.
Table 1. Total energies of neutral, cationic, and anionic clusters of AlnGan (n≤12) in their respective ground state configuration at B3LYP/Lanl2dz level.
| n | Neutral En(hartree) | Positive ion En+(hartree) | Negative ion En-(hartree) |
| 1 | -3.9745 | -3.7734 | -4.0062 |
| 2 | -8.0382 | -7.7984 | -8.1209 |
| 3 | -12.1301 | -11.8901 | -12.2082 |
| 4 | -16.2220 | -15.9871 | -16.2992 |
| 5 | -20.2984 | -20.0762 | -20.3842 |
| 6 | -24.3988 | -24.1772 | -24.4819 |
| 7 | -28.4704 | -28.2655 | -28.5517 |
| 8 | -32.5436 | -32.3281 | -32.6305 |
| 9 | -36.6024 | -36.3824 | -36.7002 |
| 10 | -40.7198 | -40.5215 | -40.8037 |
| 11 | -44.8011 | -44.6081 | -44.8944 |
| 12 | -48.8437 | -48.6432 | -48.9222 |
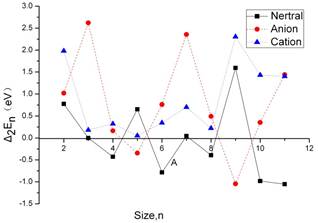
Figure 4. Second energy difference, Δ2En/n (in eV) as a function of cluster size for neutral (solid line), anionic (dashed line), and cationic (dotted line) aluminum gallium clusters.
In Figure 4. The second energy difference 2E(AlnGan)−E(Aln−1Gan−1)−E(Aln+1Gan+1) versus the cluster size for neutral and charged system is plotted. The neutral, anion and cation clusters are presented in the graph. We find such behavior for the neutral n = 4, 6, 8, 10 and 11. At n=4 the cubic structures are more stable than their neighboring global minima at n = 3 and 5. The isomer with n=6 is particular more stable than their neighbors. It is a stable structure of the charged very symmetric, the n = 8 cluster is again barely more stable than those with n = 7 and 9, most likely due to the instability of = 7, the latter is exceptionally stable and displays a cage structure with a high number of hexagons. While the AlnGan+(n = 3, 5, and 8) clusters have unusual stabilities according to the corresponding Δ2En values. All of these cluster sizes, related with particularly stable structures, are usually considered as magic numbers.
3.3. Electronic Properties
The ionization potential measures the energy difference between the ground state of the neutral and the ionized clusters. If the ionized cluster has the same geometry as the ground state of the neutral, the ionization energy corresponds to the vertical ionization potential (VIP). On the other hand, the energy difference between the ground state of the cation and ground state of the neutral is referred to as the adiabatic ionization potential (AIP). Thus the vertical ionization potential is always larger than the adiabatic ionization potential and the energy difference between them is an indication of the energy gain due to structural relaxation. In the Figure 5. We display the evolution of the ionization potential with the cluster size. There are two important features to be noted in the Figure 5. First, the clusters with n =2, 3 and 9 show that AIP values are higher than AIP values. Second, from n = 3 clusters, the IP values have the tendency of decrease when the number of AlGa units in the cluster increases.
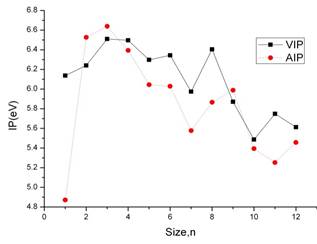
Figure 5. Vertical ionization potential (VIP, solid line),and adiabatic ionization potential (AIP, dotted line) as a function of cluster size for aluminum gallium clusters.
Both vertical and adiabatic values for the electron affinity (EA) for the lowest energy isomers of the aluminum arsenide clusters are computed in this study. The vertical electron affinity (VEA) is the difference in the energy between the ground state of the anion and the energy of the neutral cluster having the anionic geometry. The adiabatic electron affinity (AEA), on the other hand, is the difference in the total energy between the ground state of the anion and the neutral cluster. The vertical attachment energy (VAE) has also been computed, defined as the energy difference between the neutral and anionic clusters with both at the neutral cluster optimized geometry [19]. Although the vertical attachment energy is not currently measured through any experiment, it provides a lower bound to the AEA in the same way as the VEA is an upper bound to it [19]. The calculated values of the above quantities for the AlnAsn cluster are displayed in Figure 6. The relative order of the VEA, AEA, and VAE is almost similar with expected conclusion. It is observed that the electron affinity increases when the cluster size increase for that the Ga atom has more electronegativity. From the graph it can be shown the VEA and AEA has the same tendency of decrease.
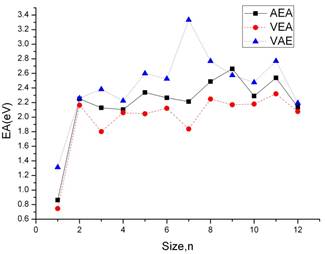
Figure 6. Adiabatic electron affinity (AEA, solid line), vertical detachment energy (VEA, dashed line), and vertical attachment energy (VAE, dotted line) as a function of cluster size for aluminum gallium clusters.
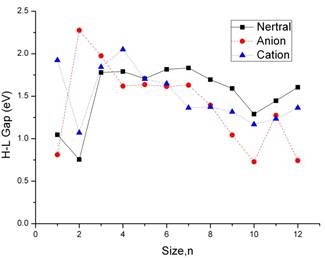
Figure 7. HOMO-LUMO gap as a function of cluster size for neutral (solid line), anionic (dashed line), and cationic (dotted line) aluminum gallium clusters.
The computed highest occupied molecular orbital (HOMO)–lowest unoccupied molecular orbital (LUMO) gap results for the neutral, positively charged, and negatively charged aluminum gallium clusters are depicted in Fig. 7. From n=4, the neutral clusters show a higher value of the HOMO–LUMO gap than the anionic clusters. From n=6, the neutral clusters show a higher value of the HOMO–LUMO gap than the cation clusters. As shown in the Figure 7. We can see that the HOMO–LUMO gaps has the same tendency in neutral clusters and the cation cluster from n=1-12. The neutral clusters have particularly peak value for AlGa, Al6Ga6, Al7Ga7, Al11Ga11, and Al12Ga12. It is interesting to see that the behavior of the HOMO–LUMO gap correlates well with the difference between the ionization potential and the electron affinity. All of these cluster sizes, related with particularly stable structures, are usually considered as magic numbers.
4. Conclusions
Using density functional theory and generalized gradient approximation, We have calculated the ground state geometries of neutral, positively charged and negatively charged aluminum gallium clusters in the size range of n = 1-12. The evolution of the binding energy, electronic structure, ionization potentials, and electron affinities are calculated. The results can be summarized as follows:
(1) The nearest neighbor distances that both neutral and charged show a similar tendency except n=1.
(2) The distribution of the atoms Al and Ga is very symmetrical to keep stable.
(3) The second energy difference Δ2En shows a distinct peak at neutral AlnGan n= 4, 6, 8, 10 and 11. and cationic AlnGan n = 3, 5, and 8. All of these cluster sizes related with particularly stable structures, are usually considered as magic numbers.
(4) For the clusters of AlnGan, when n≥3 the ionization potential have the tendency of decrease.
(5) For the clusters of AlnGan, The electron affinity curve have a slightly rise tendency.
Acknowledgments
This work was financially supported by the National Natural Science Foundation of China (Grant No. 20603021), the Natural Science Foundation of Shanxi (Grant No.2013011009-6), the High School 131 Leading Talent Project of Shanxi, Undergraduate Training Programs for Innovation and Entrepreneurship of Shanxi Province (Grant No. 2013145 and Grant No. 2015537) and Shanxi Normal University (SD2013CXCY-65, 105088) and Teaching Reform Project of Shanxi Normal University (SD2013JGXM-51).
References
- Costales A., Kandalam A.K., franco R., Pandey R. (2002), J. Phys. Chem. B. Vol.106, 1940.
- Jenkins P.P., Macinnes A.N., Tabib-Azar M., Barron A.R. (1994), ScienceVol.263, 1751.
- KilimisD.A., Papageorgiou D.G. (2010), J. Mol. Struct. (Theochem.)Vol. 939, 112.
- Heinebrodt M., Malinowski N., Tast F., Branz W., Billas I.M.L., Martin T.P. (1999), J. Chem. Phys.Vol.110, 9915.
- Fu Z., Russon L.M., Morse M.D., Armentrout P.B. (2001), Int. J. Mass. Spectrom.Vol.204, 143.
- Bian J., Xiao M., Wang S.J., Lu Y.X., Meng Y.Z. (2009), Catal. Commun.Vol.10, 1529.
- Lin J.H., Biswas P., Guliants V.V., Misture S. (2010), Appl. Catal. A.Vol.387, 87.
- Fu Z.M., Wang J.Q., Zhang N., An Y.P., Yang, Z.X. (2015), Int. J. Hydrogen EnergyVol.40, 2193.
- Guo L. (2010), J. Alloys Compd.Vol.490,78.
- Guo L., Zhang X. (2014), J. Phys. Chem. C.Vol.118, 533.
- Ding J.N., Li C.L., Yuan N.Y., Ding G.Q., Chen X.S., Lu W., Chen G.G. (2010), Chem, Phys. Lett.Vol.374, 842.
- AuroraC., Blanco M.A., Francisco E., Ravindra P.T., Martin P.A. (2005), J. Phys. Chem. B.Vol.110,4092.
- Frisch M.J., Trucks G.W., Schlegel H.B., Scuseria G.E., Robb M.A., Cheeseman J.R., Zakrzewski V.G., Montgomery Jr.J.A., Stratmann R.E., Burant J.C., Dapprich S., Millam J.M., Daniels A.D., Kudin K.N., Strain M.C., Farkas O., Tomasi J., Barone V., Cossi M., Cammi R., Mennucci B., Pomelli C., Adamo C., Clifford S., Ochterski J., Petersson G.A., Ayala P.Y., Cui Q., orokuma K., Malick D.K., Rabuck A.D., Raghava-chari K., Foresman J.B., Cioslowski J., Ortiz J.V., Stefanov B.B., Liu G., Liashenko A., Piskorz P, Komaromi I., Gomperts R., Martin R.L., Fox D.J., Keith T., Al-Laham M.A., Peng C.Y., Nanayakkara A., Gonzalez C., Challacombe M., Gill P.M.W., Johnson B., Chen W., Wong M.W., Andres J.L., Gonzalez C., Head-Gordon M., Replogle E.S., and Pople J.A., computer code Gaussian03; Gaussian Inc., Wallingford, CT, 2004.
- Becke A.D. (1993), J. Chem. Phys.Vol.98, 5648.
- Hay P.J., Wadt W.R. (1985), J. Chem. Phys.Vol.82, 270.
- Legge F.S., Nyberg G.L., Peel J.B. (2001), J. Phys. Chem. AVol.105, 7905.
- Wu X., Senapati L., Nayak S.K., Selloni A., Hajaligol (2002), M. J. Chem. Phys.Vol.117, 4010.
- Wang C.C., Zhao R.N., Han J.G. (2006), J. Chem. Phys.Vol.124, 194301.
- Ricnstra-Kiracofc J.C., Tschumpcr G.S., Schacfcr III H.F. (2002), Chem Rev.Vol.102, 231.


