
International Journal of Materials Chemistry and Physics, Vol. 1, No. 1, August 2015 Publish Date: Jul. 21, 2015 Pages: 67-73
Response Surface Methodology Analysis of Electrochemical Oxidation of a Reactive Yellow 17 Dye by Electro-Fenton/BDD Process
Asma Sennaoui1, Fatima Sakr1, Said Alahiane1, Ali Assabbane1, *, El Habib Ait Addi2
1Laboratory of Physical Chemistry, Team Photocatalysis and Environment, Faculty of Science, Ibn Zohr University, Agadir, Morocco
2Team Biotechnology, Energy and environment, Superior School of Technology, Ibn Zohr University, Agadir, Morocco
Abstract
Solutions of Reactive Yellow 17 (RY17) azo dye were degraded by electro-Fenton process (EF) using an undivided electrochemical cell containing a boron doped diamond (BDD) electrode. A 24factorial design considering the initial Fe2+ and dye concentrations, the applied current and the electrolysis time as variable independents was used to analyze the process by response surface methodology. The maximum decolorization efficiency attained 99.94%, in the response of variations in the experimental conditions, which confirms the electro-Fenton process ability and also importance of the process modeling. The ANOVA analysis confirmed that all of the variables have significant influence on the model response and showed a high coefficient of determination value (R2= 0.9938). Graphical response surface and contour plots were used to locate the optimum point. The optimum values of the process variables for the maximum decolorization efficiency (100 %) were Fe2+concentration = 0.04 mM, applied current = 100 mA, RY17 concentration = 5 mg/L and electrolysis time =30 min.
Keywords
Degradation, Reactive Yellow 17, Advanced Oxidation Processes, Hydroxyl radical, Electro-Fenton, Response Surface Methodology (RSM)
Received: May 18, 2015
Accepted: June 14, 2015
Published online: July 17, 2015
@ 2015 The Authors. Published by American Institute of Science. This Open Access article is under the CC BY-NC license. http://creativecommons.org/licenses/by-nc/4.0/
Contents
1. Introduction 2. Materials and Methods 2.1. Chemicals 2.2. Electro-Fenton Experiments and Analytical Method 2.3. Experimental Design 3. Results and Discussion 3.1. Modeling of the Process 3.2. Response Surface and Contour Plots for EF/BDD Treatment of Synthetic RY17 Dye 3.3. Optimal Conditions 4. Conclusion
1. Introduction
Azo dyes are toxic to aquatic microorganisms, carcinogenic and mutagenic to humans and are not efficiently degraded by conventional aerobic wastewater treatments because they persist under natural oxidation and reduction conditions, light exposure and biodegradation [1].
In recent years, various technologies have been developed for environmental pollutants remediation. Among them, advanced oxidation processes (AOPs) have received great attention for removal of hazardous organic pollutants from contaminated water [2]. Among AOPs, oxidation with electrochemical and Fenton’s reagent has been considered to be a promising and attractive treatment technology for degradation and decolorization of wastewaters [3].
In the EF process, H2O2 is continuously supplied to an acidic medium from the two-electron reduction of added O2 at the cathode by reaction (1). The addition of a small Fe2+concentration to the solution enhances the oxidation power of electrogenerated H2O2 giving .OH and Fe3+ from Fenton reaction (2), which is promoted by the catalytic action of the Fe3+/Fe2+ system, mainly from the regeneration of Fe2+ by the cathodic reduction of Fe3+ from reaction (3) [4].
![]() (1)
(1)
![]() (2)
(2)
![]() (3)
(3)
The best anodes for this procedure are non-active boron doped diamond (BDD) thin-film electrodes because they interact very weakly with physisorbed BDD (.OH) produced by reaction (4) and promote a much greater O2-overpotential than other conventional anodes like Pt, DSA and PbO2 [5-7], enhancing the mineralization of azo dyes due to the efficient removal of ultimate generated carboxylic acids [8,9].
![]() (4)
(4)
The Response Surface Methodology (RSM) is an efficient experimental strategy for determining the optimal conditions. This method is a collection of statistical and mathematical techniques used for development, improvement, and optimization of certain processes in which a response of interest is affected by several process variables and the objective is to optimize this response [10]. Recently, this methodology has been applied to the optimization of several AOPs such as Fenton, photo-Fenton, photocatalysis (UV/TiO2), hydrogen peroxide photolysis (UV/H2O2), and electrochemical techniques like electrocoagulation, electro-Fenton and photoelectro-Fenton [11,12].
In the present study, the Reactive Yellow 17 (RY17) dye was degraded by the electro-Fenton process, using a BDD electrode as cathode for H2O2 production. The independent parameters of applied current, dye and Fe2+ concentrations were evaluated. Experimental data were optimized by means of 24 factorial design and Response Surface Methodology (RSM).
2. Materials and Methods
2.1. Chemicals
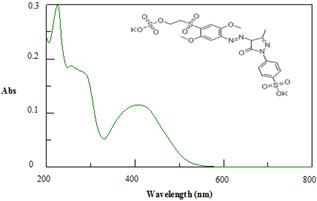
Figure 1.Chemical structure and UV spectrum of RY17 (λ max = 408 nm).
The Reactive Yellow 17 (RY17) is the synthetic organic dye used in the textile industries. The molecular formula of RY17 is C20H20N4O12S3.2K and the corresponding molecular weight is 682.77 g/mol and has λ max at 408 nm. Figure 1 shows the chemical structure and UV spectrum of RY17. Ferrous sulphate heptahydrate (FeSO4, 7H2O), sodium sulfate (Na2SO4) and Sulphuric acid (H2SO4) were purchased from Fluka, Labosi and Riedel-de Haen respectively. All these chemical substances were of reagent grade and used without further purification. All the solutions were prepared from distilled water and were conducted at room temperature.
2.2. Electro-Fenton Experiments and Analytical Method
Degradation of RY17 by the electro-Fenton process was performed in an undivided electrochemical cell of 0.5L equipped with two electrodes (Figure 2). The working electrode was a carbon felt piece (6*8*0.5cm3), a flexible material, resistant and easy to handle. The counter electrode was a boron-doped diamond (BDD) thin film (5*8*0.2 cm3).The applied current between these electrodes was available by a stabilized supply source. Prior to the electrolysis, compressed air was bubbled for 10 min through the cell to saturate the aqueous solution in oxygen. A concentration of sodium sulfate of 50 mM (Na2SO4) was added to the solution as the supporting electrolyte. The iron sulfate (FeSO4, 7H2O) catalyzing the Fenton reaction was added to the reaction medium before the beginning of the electrolysis. The pH of solutions was adjusted to 3 by sulphuric acid (10-3M) to avoid the precipitation of ferric ions in the form of hydroxides. The solutions were homogenized by a magnetic stirrer (600 rev/min). The samples were taken manually by a micropipette at definite time intervals and they were analyzed by UV/Vis spectroscopic technique using JASCO V-630 Spectrophotometer.
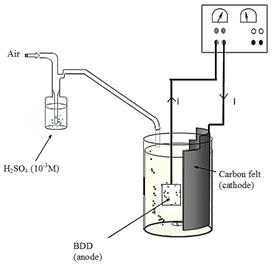
Figure 2. Experimental set-up for electro-Fenton experiments.
2.3. Experimental Design
RSM is a statistical method being useful for the optimization of chemical reactions and/or industrial processes and widely used for experimental design [13]. The leading objective of this method is to optimize the response surface that is influenced by different independent variables. RSM also identified the relationship between the controllable input parameters and the response variable [14].
In the present study a 24 factorial design, which is a widely used form of RSM, was applied to the optimization of the EF/BDD degradation of RY17 dye. Preliminary experiments were carried out to limit the extreme values of the variables. The selected parameters in the current study were the Initial Fe2+ concentration (A), applied current (B), the initial dye concentration (C) and the electrolysis time (D) as the variables and the decolorization efficiency (DE) value as the response. A total of 16 experiments were made in this analysis, and they were analyzed using the Design Expert Version 9.0.3. The factor levels were selected taking +1 as the high level and -1 as the lower level.
3. Results and Discussion
3.1. Modeling of the Process
Synthetic RY17 was subjected to electro-Fenton treatment under different conditions in accordance with the experimental runs indicated by the model. Table1 lists the ranges and levels of the applied parameters, the designed matrix, responses based on experimental runs and predicted values on decolorization efficiency (DE). The observed DE varied between 37.54 and 99.94 %, in the response of variations in the experimental conditions, and the model predictions matched these experimental results satisfactorily with R2= 0.9938, which indicated the proper ability of the model for predicting of DE%. A graph of the experimental response values versus the predicted response values are shown in Figure 3.
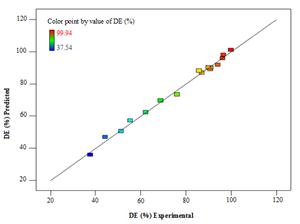
Figure 3. Experimental response values versus predicted response values.
From the results obtained in the trials performed with the 24 factorial designs, the following hierarchical first-order response equation was established to correlate the dependent and independent variables:
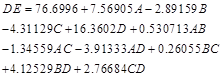 (5)
(5)
Table 1. Experimental range and levels of the independent varibales used in terms of the reals and coded factors.
| Variables (factors) | Levels and ranges | ||||||||
| −1 | +1 | ||||||||
| Initial Fe (II) concentration (mM) (A) | 0.02 | 0.04 | |||||||
| Applied current (mA) (B) | 60 | 100 | |||||||
| Initial dye concentration (mg/L) (C) | 5 | 10 | |||||||
| Electrolysis time (min) (D) | 5 | 30 | |||||||
| Design matrix | |||||||||
| Standard runs | Factor A | Factor B | Factor C | Factor D | Experimental | DE % Predicted | |||
| 1 | -1 | -1 | -1 | -1 | 62.24 | 62.40 | |||
| 2 | 1 | -1 | -1 | -1 | 87.02 | 86.99 | |||
| 3 | -1 | 1 | -1 | -1 | 44.28 | 46.78 | |||
| 4 | 1 | 1 | -1 | -1 | 76.12 | 73.50 | |||
| 5 | -1 | -1 | 1 | -1 | 51.36 | 50.41 | |||
| 6 | 1 | -1 | 1 | -1 | 68.80 | 69.62 | |||
| 7 | -1 | 1 | 1 | -1 | 37.54 | 35.84 | |||
| 8 | 1 | 1 | 1 | -1 | 55.34 | 57.17 | |||
| 9 | -1 | -1 | -1 | 1 | 90.77 | 89.16 | |||
| 10 | 1 | -1 | -1 | 1 | 96.62 | 98.10 | |||
| 11 | -1 | 1 | -1 | 1 | 91.08 | 90.04 | |||
| 12 | 1 | 1 | -1 | 1 | 99.94 | 101.11 | |||
| 13 | -1 | -1 | 1 | 1 | 85.84 | 88.24 | |||
| 14 | 1 | -1 | 1 | 1 | 94.07 | 91.80 | |||
| 15 | -1 | 1 | 1 | 1 | 89.92 | 90.17 | |||
| 16 | 1 | 1 | 1 | 1 | 96.23 | 95.85 | |||
Table 2. ANOVA test for the response model of the RY17 using Electrofenton process.
| Source | Sum of squares | df | Mean square | F-value | P-value Prob>F | Remarks |
| Model | 6304.68 | 10 | 630.47 | 80.15 | <0.0001 | Significant |
| A-A | 916.65 | 1 | 916.65 | 116.53 | 0.0001 | |
| B-B | 133.78 | 1 | 133.78 | 17.01 | 0.0091 | |
| C-C | 297.40 | 1 | 297.40 | 37.81 | 0.0017 | |
| D-D | 4282.50 | 1 | 4282.50 | 544.41 | <0.0001 | |
| AB | 4.51 | 1 | 4.51 | 0.57 | 0.4832 | |
| AC | 28.97 | 1 | 28.97 | 3.68 | 0.1131 | |
| AD | 245.03 | 1 | 245.03 | 31.15 | 0.0025 | |
| BC | 1.09 | 1 | 1.09 | 0.14 | 0.7254 | |
| BD | 272.29 | 1 | 272.29 | 34.61 | 0.0020 | |
| CD | 122.49 | 1 | 122.49 | 15.57 | 0.0109 | |
| Residual | 39.33 | 5 | 7.87 | |||
| Correction Total | 6344.02 | 15 |
The suggested model adequacy was checked further using ANOVA analysis and the results have been shown in Table 2. ANOVA subdivides the variation of the results to variation associated with the model and experimental error, respectively, demonstrating if the variation from the model is significant or not when compared with residual error. F-value is the ratio of the mean square of the model and residual error. When F-value is greater than the tabulated value for a definite number of degrees of freedom in the model at a significance level of α, the model is suitable for describing the results [15]. The model F-value of 80.15 implies the model is significant, at 95 % confidence level. There is only a 0.01 % chance that a "Model F-value" this large could occur due to noise.
The adequacy of the above model was also evaluated by the residuals. Normal probability plots are a suitable graphical method for judging the normality of the residuals [16]. The diagnostic of studentized residuals exemplified in Figure 4 evidences that the residual behavior follows a normal distribution and is linear, which is the more important assumption for checking statistical modeling.
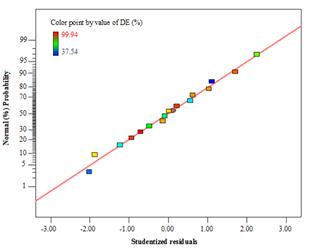
Figure 4.Normal probability plot of studentized residuals of the linear. model for decolorization efficiency.
Values of "Prob> F" less than 0.05 indicate model terms are significant. In this case A, B, C, D, AD, BD, CD are significant model terms. Values greater than 0.1 indicate the model terms are not significant. The Pareto analysis gives more significant information to interpret the results. In fact, this analysis calculates the percentage effect of each factor on the response, according to the following relation [17]:
![]() (6)
(6)
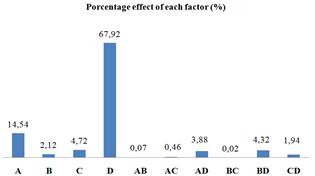
Figure 5. Pareto graphic analysis.
As shown in Figure 5, the three main effective parameters on response (DE %) were the electrolysis time (67,92 %) and the initial Fe2+ concentration (14,54 %), and the initial dye concentration (4,72 %).
3.2. Response Surface and Contour Plots for EF/BDD Treatment of Synthetic RY17 Dye
The three-dimensional (3D) response surface and two dimensional (2D) contour plots of the model-predicted responses, while two variables kept at constant and the others varying within the experimental ranges, were obtained by the Design-Expert software for EF/BDD treatment of synthetic RY17 dye. Response surface plots provide a method to predict the decolorization efficiency for different values of the tested variables and the contours of the plots help in identification of the type of interactions between these variables [18].
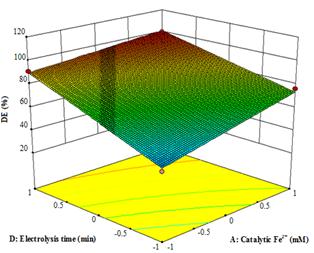
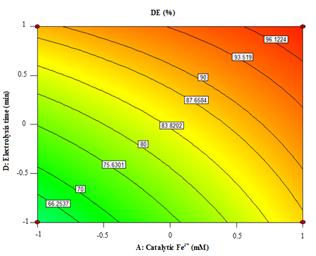
Figure 6. The response surface and contour plots of the decolorization efficiency (DE %) as the function of catalytic Fe2+ (mM) and electrolysis time (min) for applied current of 100 mA and 5 mg/L of RY17.
The effect of interaction between catalytic Fe2+ concentration and electrolysis time on decolorization efficiency is presented in the response surface plot of Figure 6 for initial RY17 concentration of 5 mg/L and applied current of 100 mA. As can be seen, the decolorization efficiency increased considerably when the catalytic Fe2+ concentration content rises from 0.02 to 0.04 mM at short electrolysis time (5 min) but rose slightly at long electrolysis time (30 min). This means that the destruction of RY17 and its colored oxidation products are more rapid at the beginning of the process and when more •OH is produced from reaction (2) in the presence of greater quantities of catalytic Fe2+. And the increase in the decolorization efficiency when Fe2+ content rises from 0.02 to 0.04 mM can be related to the gradual acceleration of Fenton reaction (2). These results concur with those found in literature [14,19]. In the same way, a strong enhancement of this parameter when prolonging electrolysis time at the lowest Fe2+ concentration of 0.02 mM and increased considerably at the highest 0.04 mM Fe2+.The maximum decolorization efficiency achieved was 101.11 % at 100 mA and 5 mg/L RY17 for 0.04 mM Fe2+ and 30 min of electrolysis.
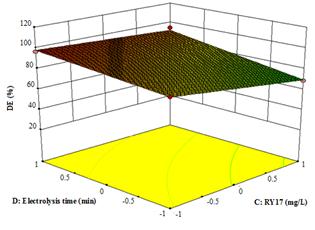
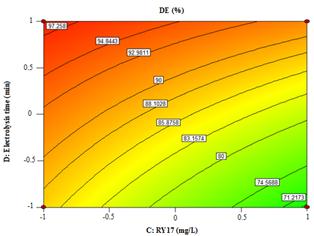
Figure 7. The response surface and contour plots of the decolorization efficiency (DE %) as the function of RY17 (mg/L) and electrolysis time (min) for applied current of 60 mA and at 0.04 mMcatalytic Fe2+.
Figure 7 illustrates the effect of interaction between initial dye concentration and electrolysis time on decolorization efficiency for initial F2+ concentration of 0.04 mM and applied current of 60 mA. The decolorization efficiency decreased considerably with the increase of initial dye concentrationat 5 min and slightly at the highest electrolysis time of 30 min. The decolorization efficiency was inversely proportional to initial dye concentration, which may be due to the availability of constant amount of hydroxyl radicals irrespective of the initial dye concentration and hence, the removal rate constant was decreased [20,21]. On the other hand, the decolorization efficiency was strongly enhanced when prolonging electrolysis time at the highest initial dye concentration of 10 mg/L and increased considerably at the lowest 5 mg/L. Thus, the maximum value for the decolorization efficiency was 96.10 % operating with 5 mg/L of RY17 and 0.04 mM Fe2+ for 30 min at 60 mA.
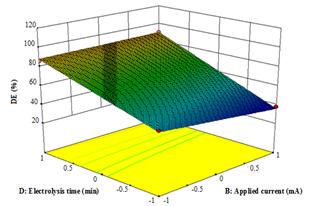
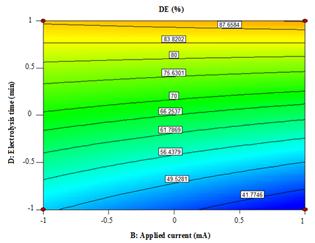
Figure 8. The response surface and contour plots of the decolorization efficiency (DE %) as the function of applied current (mA) and electrolysis time (min) at 0.02 mM catalytic Fe2+and 10 mg/L of RY17.
Figure 8 shows DE % as a function of the applied current (j) and electrolysis time at a constant catalytic Fe2+ concentration of 0.02 mM and a RY17 concentration of 10 mg/L. The decolorization efficiency descreased slightly with increasing j at the lowest electrolysis time of 5 min, but it increased much more slightly at the highest electrolysis time of 30 min. The enhancement in decolorization efficiency with j can be associated with a greater production of H2O2 through reaction (1) yielding higher amount of •OH radical from reaction (2) [22]. However, the RY17 color removal was improved when the electrolysis time reached 30 min. In contrast, the gradual loss in decolorization efficiency with raising j at 5 min can be explained by the concomitant decay in •OH concentration by reaction with Fe2+ ion in excess as follows [23]:
![]() (7)
(7)
Moreover, when the electrolysis time increased, this response increased considerably at the lowest applied current of 60 mA and strongly enhanced at the highest current density of 100 mA. The maximum decolorization efficiency for 10 mg/L RY17 at 30 min was 90.17 % at the lowest current density of 100 mA and the highest catalytic Fe2+ concentration of 0.02 mM.
3.3. Optimal Conditions
The main objective of the optimization is to determine the optimum values of variables of EF/BDD process from the model obtained using experimental data. The optimum values of the process variables for the maximum decolorization efficiency are shown in Table 3. Verification experiments performed at the predicted conditions derived by from ridge analysis of RSM demonstrated that the experimental value was reasonably close to the predicted value as shown in Table 3, which indicating the validity and adequacy of the predicted model.
Table 3.Comparison of experimental and predicted values of response (DE %) at the optimal levels predicted by RSM.
| Response | Optimal conditions | Predicted efficiency (%) | Experimental efficiency (%) | STDEV (%) |
| Decolorization efficiency (DE %) | A=0.04mM | 101.11 | 99.94 | 2.80 |
| B= 100mA | ||||
| C= 5mg/L | ||||
| D= 30 min |
4. Conclusion
In this study, degradation of Reactive Yellow 17 (RY17) was investigated using electro-Fenton system. The decolorization efficiency was analyzed by RSM considering a 24 factorial design. The maximum of 99.94 % was obtained at the optimum conditions as follows: initial Fe2+ concentration (0.04 mM), applied current (100 mA), initial RY17 concentration (5 mg/L) and electrolysis time (30 min). Based on experimental results, an empirical relationship between the decolorization efficiency and independent variables was obtained and expressed by the hierarchical first order Eq (5). Analysis of variance showed good coefficient of determination values (R2= 0.9938). Effect of experimental parameters on the decolorization efficiency of RY17 was established by the response surface and contour plots of the model predicted responses. Agreement of the predicting model with the experimental data at the optimum conditions was satisfactory, which confirms the adequacy of the model.
References
- C. A. Martinez-Huitle, E. Brillas, Appl. Catal. B-Environ. 87 (2009).
- A. R. Khataee, M. Zarei, S. K. Asl, Electroanal. Chem. 648 (2010).
- E. Brillas, J.C. Calpe, J. Casado, Water. Res. 34 (2000).
- S. Garcia-Segura, J. A. Garrido, R. M. Rodriguez, P. L. Cabot, F.Centellas,C. Arias, E.Brillas,Water.Res.46 (2012).
- M. Panizza, G. Cerisola, Ind. Eng.Chem. Res. 47 (2008).
- M. Zhou, H. Saerkkae, M.A. Sillanpaeae, Sep. Purif. Technol. 78 (2011).
- M. Hamza, R. Abdelhedi, E. Brillas, I. Sires,Electroanal. Chem.627 (2009).
- E.J. Ruiz, C. Arias, E. Brillas, A. Hernandez-Ramirez, J.M. Peralta-Hernandez, Chemosphere 82 (2011).
- S. Garcia-Segura, E. Brillas, Water.Res. 45 (2011).
- A. Abaamrane, S. Qourzal, S. Mançour Billah, A. Assabbane, Y. Ait- Ichou, Open. J. Appl. Sci. 2 (2012).
- F. Torrades, M. Pérez, H.D. Mansilla, J. Peral, Chemosphere 53 (2003).
- A.R. Khataee, M. Zarei, L. Moradkhannejhad, Desalination 258 (2010).
- I. Arslan-Alaton, G. Tureli, T. Olmez-Hanci, Photochem. Photobiol. A-Chem. 202 (2009).
- K. Cruz-Gonzalez, O. Torres-Lopez, A.M. Garcia-Leo n, E. Brillas, A. Hernandez-Ramirez, J.M. Peralta-Hernandez, Desalination 286 (2012).
- A. Khataee, H. Marandizadeh, B. Vahid, M. Zareic, S.WooJoo, Chem. Eng. Process. 73 (2013).
- C. Ramirez, A. Saldana, B. Hernandez, R. Acero, R. Guerra, S. Garcia-Segura, E. Brillas, J. M. Peralta-Hernandez, Ind. Eng.Chem. 19 (2013).
- . A. Kesraoui-Abdessalem, N. Oturan, N. Bellakhal, M. Dachraoui, M.A. Oturan,Appl. Catal.B-Environ.78 (2008).
- Y. Li, C. Chang, T. Wen, Ind. Eng. Chem. Res. 35 (1996).
- J. Anotai, S. Singhadech, Chia-Chi Su, Ming-Chun Lu, Hazard. Mater. 196 (2011).
- A.Sennaoui, F. Sakr, M. Dinne, A. Assabbane, El.Ait Addi, M. Hamdani. Mater.Environ. Sci. 5 (2014).
- A. Babuponnusami, K. Muthukumar, Chem. Eng. J. 183 (2012).
- S. Mohajeri, A. Hamidi, M. H. Isa, M. A. Zahed, M. N.Adlan, Hazard.Mater.176 (2010).
- J.M. Peralta-Hernández, Y.Meas-Vong, F.J. Rodríguez, T. W. Chapman,M.I.Maldonado, L.A. Godínez, Dyes Pigments 76 (2008).


