International Journal of Chemical and Biomolecular Science, Vol. 1, No. 2, August 2015 Publish Date: Jul. 21, 2015 Pages: 54-59
Validated UV Method for the Determination of Chloroquine Sulphate and Its Stress Degradation Studies
Sk Manirul Haque1, Habibur Rahman2, *
1Department of Chemical Engineering and Process Technology, Jubail Industrial College, Jubail, Saudi Arabia
2Department of General Studies, Jubail Industrial College, Jubail, Saudi Arabia
Abstract
The main objective of this paper was to develop a simple, sensitive and validated UV spectrophotometric method for the determination of chloroquine sulphate in pharmaceutical formulations. The aqueous solution of chloroquine sulphate absorbed maximally at 220 nm performed at room temperature (25 ± 1ºC). Under optimized experimental conditions, Beer’s law was obeyed in the concentration range of 1.0 – 10.0 μg/ml. The method was validated with respect to accuracy, precision, limits of detection and quantitation. The drug was also subjected to acid and alkaline hydrolysis, photolysis, thermal and degradation with time to determine the stability of a drug substance in pure and pharmaceutical formulations. Robustness testing was also conducted to evaluate the effect of minor changes to the absorbance of pharmaceutical formulations.
Keywords
Chloroquine Sulphate, Spectrophotometry, Accuracy and Precision, Robustness
Received: May 17, 2015
Accepted: June 20, 2015
Published online: July 20, 2015
@ 2015 The Authors. Published by American Institute of Science. This Open Access article is under the CC BY-NC license. http://creativecommons.org/licenses/by-nc/4.0/
Contents
1. Introduction 2. Experimental 2.1. Apparatus 2.2. Materials and Reagents 2.3. Standard Chloroquine Sulphate Solution 2.4. Procedure for Determination of CQS in Bulk Drug 2.5. Procedure for Determination of CQS in Pharmaceutical Formulations 2.6. Stress Degradation Studies 2.7. Limit of Detection (LOD) and Limit of Quantitation (LOQ) 2.8. Method Validation 3. Results and Discussion 3.1. Validation of Proposed Method 3.2. Degradation Behaviour 4. Conclusions
1. Introduction
Malaria is the leading cause of mortality in children and adults especially in Africa. In tropical and subtropical regions of the world with approximately 300–500 million clinical cases reported annually1. The parasite, Plasmodium falciparum is responsible for the majority of the malarial deaths. Chloroquine sulphate (CQS) is a synthetic antimalarial drug most widely used to treat all types of malarial infections. The treatment of malaria has been approached in many ways, with resistance to drug therapy leaving little to desire. It is chemically known as N4-(7-Chloroquinolin-4-yl)-N1, N1-diethylpentane-1,4-diamine monohydrate, having molecular formula C18H26ClN3· H2SO4· H2O, mol. wt. 435.97). It occurs as white crystalline form and freely soluble in water. The analysis of CQS has been equally approached from many directions, needless to mention them. Few methods of analysis are too sophisticated, tedious or expensive for routine determination such as high performance liquid chromatography (HPLC), high performance thin layer chromatography (HPTLC), spectrofluorimetry reported in the literature for the determination of CQS in bulk and pharmaceutical formulations. Therefore, it is necessary to provide more alternatives in the determination of CQS by developing and adapting a simple, sensitive, fast and readily amenable technique in the quantitative analysis of CQS in pure and pharmaceutical formulations.
CQS is officially listed in both the European Pharmacopoeia2 and United States Pharmacopoeia3 which describes non-aqueous titration methods. A method was reported for the determination of pure chloroquine involving extraction into nitrobenzene4although, good accuracies have been reported. However, the procedures are often time-consuming and cost-ineffective. Liquid chromatographic techniques such as HPLC & HPTLC5-6have been used for the assay of CQS in pharmaceutical formulations or biological samples. Chloroquine and desethyl - chloroquine was determined using liquid chromatographic method7, chloroquine and its main metabolite deethyl chloroquine was also determined using capillary electrophoresis in biological samples8. The main aim of present investigation was to develop a simple, sensitive, fast and economical ultra violet (UV) spectrophotometric method for the determination of CQS in pure and pharmaceutical formulations. The safety of the drug product depends on the toxicological properties of the active pharmaceutical ingredients (API) and spontaneously generated impurities or degradation products, formed during the various chemical transformations, distribution and storage. This may cause more bioavailability and efficacy of the drug; it might otherwise produce different adverse and toxic effects in patients. Therefore, it is required to control these degradation products and also important to identify and quantify the impurities which were formed even in very small quantities during stress condition. A method was reported in literature for the estimation of impurities in hydroxy chloroquine sulphate from tablet formulations9.
The present paper reports the development and validation of a UV spectrophotometric method for quantification of CQS and study of its degradation behaviour. Stress degradation of CQS was carried out according to International Conference on Harmonization (ICH) guidelines10-12,entitled ‘stability testing of new drug substances and products’. The drug was subjected to thermal degradation, UV degradation, acid and alkaline hydrolysis. The proposed method is economic when compared with HPLC methods.
2. Experimental
2.1. Apparatus
Spectral runs were made on Helios α UV-visible Spectrophotometer (Thermo Scientific, USA) with 10 mm matched quartz cuvettes.
2.2. Materials and Reagents
• Chloroquine sulphate was purchased from Sigma Aldrich, USA and used as working standard.
• Pharmaceutical formulations of CQS such as Vinaquine®, Nivaquine® and Plasmoquine®purchased from local drug shop.
• 1 M Sodium hydroxide (NaOH) and 1 M Hydrochloric acid (HCl) was also prepared.
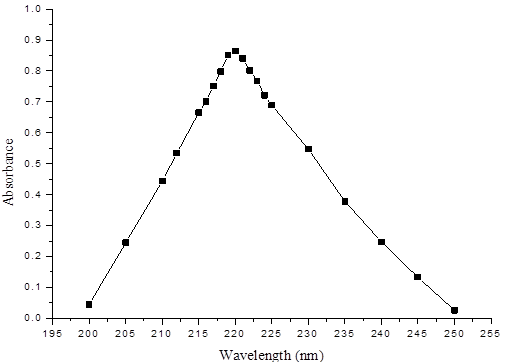
Fig. 1. Absorption spectra of CQS in distilled water.
2.3. Standard Chloroquine Sulphate Solution
A stock solution of CQS (100 μg/ml) was prepared by dissolving 25 mg CQS in 250 ml volumetric flasks with distilled water. The stock solution was used to prepare the working solutions by suitable dilution with doubly distilled water. The solutions were stable at least 7 days at room temperature (25 ± 1º C).
2.4. Procedure for Determination of CQS in Bulk Drug
Into a series of 10 ml volumetric flasks, different volumes (0.1 – 1.0) ml of standard CQS (100 μg/ml) solution corresponding to 10.0 – 100.0 μg were pipetted and diluted to volume with distilled water. The absorbance was measured at 220 nm against the reagent blank prepared by omitting the drug simultaneously (Fig. 1). The calibration curve was constructed by plotting the absorbance against the initial concentration of CQS. The content of CQS is calculated either from the calibration curve or corresponding regression equation.
2.5. Procedure for Determination of CQS in Pharmaceutical Formulations
One tablet (claiming 1 g of CQS) was accurately weighed and finely powdered. A quantity of the powder equivalent to 25 mg of CQS was extracted by shaking with 100 ml of doubly distilled water, followed by another two extractions each with 50 ml distilled water. After passing through a 0.45 μm millipore filter, the solution was diluted with distilled water to obtain a concentration of 100 μg/ml of the solution. It was further diluted according to the need and then analyzed following the proposed procedure. The nominal content of the tablet was calculated either from the previously plotted calibration graphs or using regression equation.
2.6. Stress Degradation Studies
2.6.1. Acid Degradation
Acid induced force degradation was performed by taking 5 ml of 10.0 μg/ml solutions of CQS into a test tube and then 5 ml of 1M HCl was added into it. The sample was then left for a period of 30 min. Upon completion of time period, solution is transferred to a cuvette separately and then absorbance of the solution was recorded at the wavelength of 220 nm.
2.6.2. Alkaline Degradation
Force degradation in alkaline media was performed by adding 5 ml of 10.0 μg/ml solution of CQS in a test tube and then 5 ml of 1M NaOH was added into the same test tube. The sample was then left for a period of 30 min. Upon completion of time period, solution was transferred to a cuvette separately and then absorbance of the solutions was recorded at 220 nm.
2.6.3. Photolytic Degradation
Photolysis was done by taking 5 ml of 10.0 μg/ml solution of CQS in test tube, then 5 ml water was added in test tube and placed these solutions in UV light and absorbance of the solutions was recorded at the wavelength of 220 nm.
2.6.4. Thermal Degradation
To study the effect of temperature, 5 ml of 10.0 μg/ml solutions of CQS was taken in a test tube containing 5 ml of water, then stored in a hot air oven at 500 C for 24 hours. Finally, the absorbance of the solution was recorded at absorption maxima (220 nm).
2.6.5. Degradation with Time
To study the effect of degradation with time, 10.0 μg/ml solution of CQS was kept in a cuvette and initial absorbance (at 220 nm) of solution was observed, then sample was left for a period of 10 days, after completion of specified time interval absorbance of the solution was recorded at the wavelength of 220 nm.
2.7. Limit of Detection (LOD) and Limit of Quantitation (LOQ)
According to International Conference on Harmonization (ICH) guidelines the following expressions are used to evaluate LOD and LOQ13.
LOD = 3.3 ´ S0 / b and LOQ = 10 ´ S0 / b
where S0 and b are standard deviation and slope of the calibration line, respectively.
2.8. Method Validation
Method validation is closely related to method development. The International Conference on the Harmonization (ICH) of the Technical Requirements for Registration of Pharmaceuticals for Human Use guideline achieved a great deal in harmonizing the definitions of required validation parameters, their calculation and interpretation.
2.8.1. Accuracy and Precision
Accuracy determines the closeness of agreement between a test result and the accepted reference value whereas precision gives the closeness of agreement between independent test results obtained under stipulated conditions.
2.8.2. Linearity
The ability of the method to obtain test results proportional to the concentration of analyte (within a given range).
2.8.3. Linear Range
The range of concentrations or amounts of analyte over which the method gives test results proportional to the concentration of analyte or a linear calibration model can be applied with a known confidence level.
2.8.4. Robustness
Robustness is a measure of the capacity of the analytical procedure to remain unaffected by small but deliberate variations in method – performance parameters, which provides an indication of its reliability during normal usage.
3. Results and Discussion
3.1. Validation of Proposed Method
3.1.1. Linearity and Range
The linearity of the proposed method was constructed for CQS reference standard solution by plotting concentration of the drug versus the absorbance. The linearity was evaluated by linear regression analysis, which was calculated by the least square regression method. The parameters LOD and LOQ were determined on the basis of response and slope of the regression equation.
The absorbance – concentration plot for the proposed method was found to be rectilinear over the range of 1.0 – 10.0 μg/ml. Linear regression analysis of calibration data gave the regression equation with correlation coefficients close to unity. Statistical analysis of regression lines were made regarding the standard deviation of residuals (Sx/y), standard deviation of slopes (Sb) and standard deviation of intercepts (Sa) and the values are summarized in Table 1.
Table 1. Summary of optical and regression characteristics of the proposed method.
| Parameter | |
| Linear dynamic range (µg/ml) | 1.0 – 10.0 |
| Regression equationa | Y = -1.1 × 10⁻³ + 7.67 × 10⁻² X |
| Slope | 7.67 × 10⁻² |
| Intercept | -1.1 × 10⁻³ |
| Corrélation coefficient (r) | 0.9997 |
| Sa | 3.02 × 10⁻³ |
| Sb | 4.86 × 10⁻⁴ |
| LOD (µg/ml) | 1.30 × 10⁻¹ |
| LOQ (µg/ml) | 3.94 × 10⁻¹ |
| Variance (S0)2 | 9.12 × 10⁻⁶ |
awith respect to Y = a+ bX, where X is the concentration in µg/ml, Y is the absorbance.
Table 2. Summary of accuracy and precision results in pure CQS.
| Proposed method | Amount (µg/ml) | Recovery (%) | RSDa (%) | SAEb | C.L.c | |
| Taken | Found ± SDa | |||||
| Intraday assay | 2.000 | 1.983 ± 0.013 | 99.15 | 0.658 | 0.006 | 0.016 |
| 5.000 | 5.008 ± 0.035 | 100.16 | 0.689 | 0.016 | 0.043 | |
| 8.000 | 8.010 ± 0.020 | 100.14 | 0.254 | 0.009 | 0.025 | |
| Inter day assay | 2.000 | 2.005 ± 0.020 | 100.24 | 0.993 | 0.009 | 0.025 |
| 5.000 | 4.982 ± 0.023 | 99.64 | 0.453 | 0.010 | 0.029 | |
| 8.000 | 8.007 ± 0.034 | 100.08 | 0.432 | 0.015 | 0.042 |
aMean for five independent analyses. bSAE. standard analytical error. cC.L. confidence limit at 95 % confidence level and four degrees of freedom (t = 2.776)
Table 3. Summary of accuracy and precision results in pharmaceutical formulations.
| Proposed method | Amount (µg/ml) | Recovery (%) | RSD (%) | SAEb | C.L.c | |
| Taken | Found ± SDa | |||||
| Intra day assay | ||||||
| Vinaquine® | 2.00 | 2.005 ± 0.015 | 99.15 | 0.751 | 0.007 | 0.019 |
| 5.00 | 5.012 ± 0.027 | 100.24 | 0.543 | 0.012 | 0.034 | |
| 8.00 | 7.976 ± 0.033 | 99.70 | 0.411 | 0.015 | 0.041 | |
| Nivaquine® | 2.00 | 1.961 ± 0.019 | 98.07 | 1.020 | 0.008 | 0.024 |
| 5.00 | 4.977 ± 0.033 | 99.55 | 0.659 | 0.015 | 0.041 | |
| 8.00 | 7.972 ± 0.020 | 99.65 | 0.250 | 0.009 | 0.025 | |
| Plasmoquine® | 2.00 | 1.999 ± 0.012 | 99.90 | 1.200 | 0.005 | 0.015 |
| 5.00 | 4.001 ± 0.009 | 99.95 | 0.450 | 0.004 | 0.011 | |
| 8.00 | 7.976 ± 0.027 | 99.70 | 0.340 | 0.012 | 0.033 | |
| Inter day assay | ||||||
| Vinaquine® | 2.00 | 2.009 ± 0.026 | 100.46 | 1.300 | 0.012 | 0.032 |
| 5.00 | 5.012 ± 0.040 | 100.24 | 0.795 | 0.018 | 0.050 | |
| 8.00 | 8.007 ± 0.035 | 100.08 | 0.431 | 0.016 | 0.043 | |
| Nivaquine® | 2.00 | 1.966 ± 0.008 | 98.28 | 0.383 | 0.004 | 0.010 |
| 5.00 | 4.934 ± 0.027 | 98.68 | 0.550 | 0.012 | 0.033 | |
| 8.00 | 7.937 ± 0.033 | 99.21 | 0.413 | 0.015 | 0.041 | |
| Plasmoquine® | 2.00 | 1.961 ± 0.015 | 98.07 | 0.768 | 0.007 | 0.019 |
| 5.00 | 4.982 ± 0.023 | 99.64 | 0.453 | 0.010 | 0.029 | |
| 8.00 | 8.011 ± 0.027 | 100.14 | 0.339 | 0.012 | 0.033 |
aSD. standard deviation. bSAE. standard analytical error. cC.L. confidence limit at 95% confidence level and four degrees of freedom (t = 2.776)
3.1.2. Accuracy and Precision
The accuracy and precision of the method was evaluated within the linear range based on the analysis of CQS reference standard samples and pharmaceutical formulations at 2.0, 5.0 and 8.0 μg/ml. Five independent analyses were performed at each concentrations level within one day (intraday precision) as well as for five consecutive days (interday precision).
The intraday day precision assays were carried out through replicate analysis (n=5) of CQS corresponding to 2.0, 5.0 and 8.0 μg/ml. The interday precision was evaluated through replicate analysis of the pure CQS samples for five consecutive days at the same concentration levels as used in within day precision. The results of these assays are reported in Table 2. As can be seen from table 2 that the recovery and relative standard deviation (RSD) values for within day precision were always lower than 100.16% and 0.689%; recovery and RSD values for interday precision were lower than 100.24% and 0.993%. The precision results are satisfactory.
The intraday and interday precision assays were also carried out for CQS in pharmaceutical formulations. The results were summarized in Table 3. As can be seen from table 3 that the recovery and RSD values were in the ranges 99.15% to 100.24%; 0.25% to 1.200% and 98.07% to 100.24%; 0.339% to 1.300% for intraday and interday precision, respectively.
The accuracy was ascertained by recovery studies using the standard addition method. The proposed method was used for estimation of CQS from tablets after spiking with 50, 150 and 250% additional pure drug. The amount of CQS was determined from the regression equation. The results are summarized in Table 4. It shows that the % recovery and %RSD values were ranges 98.71 to 100.41 and 0.185 to 0.881, respectively.
Table 4. Standard addition method.
| Proposed method | Amount (µg/ml) | Recovery (%) | RSD (%) | SAEb | ||
| Taken | Added | Found ± SDa | ||||
| Vinaquine® | 2.00 | 1.00 | 2.961 ± 0.026 | 98.71 | 0.881 | 0.012 |
| 2.00 | 3.00 | 4.995 ± 0.026 | 99.90 | 0.522 | 0.012 | |
| 2.00 | 5.00 | 7.007 ± 0.020 | 100.10 | 0.284 | 0.009 | |
| Nivaquine® | 2.00 | 1.00 | 2.991 ± 0.020 | 99.71 | 0.666 | 0.009 |
| 2.00 | 3.00 | 5.008 ± 0.035 | 100.16 | 0.689 | 0.016 | |
| 2.00 | 5.00 | 7.029 ± 0.013 | 100.41 | 0.185 | 0.006 | |
| Plasmoquine® | 2.00 | 1.00 | 3.004 ± 0.020 | 100.15 | 0.663 | 0.009 |
| 2.00 | 3.00 | 4.982 ± 0.026 | 99.64 | 0.523 | 0.012 | |
| 2.00 | 5.00 | 6.994 ± 0.049 | 99.91 | 0.706 | 0.022 | |
aMean for five independent analyses. bSAE standard analytical error. RSD, relative standard deviation.
3.2. Degradation Behaviour
Degradation studies on active CQS and its pharmaceutical formulations under different stress condition were performed and the results were summarized in Table 5. It was found that the drug was comparatively stable to UV, thermal and degradation with time. There was an increased availability in acidic and basic media. Under photolytic condition, when exposed to UV light negligible changes were observed (101.23%, 101.88%, 101.21%, 101.78%) in pure CQS and pharmaceutical formulations, respectively. Finally, a stability study of the aqueous solution of CQS was observed by keeping the sample for 10 days. There were no significant changes observed (100.17%, 99.82%, 99.15%, 99.70%) respectively.
Table 5. Degradation Studies.
| Sample | Before Treatment (%) | After Acid Treatment (%) | After Base Treatment (%) | After Heat (%) | After U.V. (%) | After Time (%) |
| CQS | 99.75 | 165.14 | 166.45 | 101.59 | 101.23 | 100.17 |
| Vinaquine® | 99.99 | 164.28 | 165.24 | 101.87 | 101.88 | 99.82 |
| Nivaquine® | 100.14 | 165.90 | 166.22 | 101.43 | 101.21 | 99.15 |
| Plasmoquine® | 99.20 | 164.87 | 165.10 | 102.08 | 101.78 | 99.82 |
4. Conclusions
The proposed method provides a simple, cost effective, fast and efficient method and does not require any laborious clean up procedure before measurement. In addition, the method has good linear dynamic range with good accuracy and precision. The method shows no interference from the common excipients and additives. Stress testing also indicates that the drug is comparatively stable to UV, thermal and degradation with time. Therefore, it was concluded that the proposed method provides a rapid determination of CQS and can be frequently used in research and pharmaceutical laboratories. The proposed method can also be used as alternative methods to reported ones for routine determination of CQS in bulk and pharmaceutical formulations.
References
- Greenwood B.M., Bojang K., Whitty C.J.M., Targett G.A.T., Malaria. The Lancet, 2005. 365, 1487–1498.
- European Pharmacopoeia 5th edition, 2005, pp. 1263
- The United States Pharmacopeia, United States Pharmacopoeial Convention, Inc., Rockville, MD, 2011
- Onyegbule F.A., Adelusi S.A., Onyegbule C.E., Extractive visible spectrophotometric determination of chloroquine in pharmaceutical and biological materials. IJPSR 2011. 2(1), 58 – 62.
- Dwivedi A.K., Saxena D., Singh S., HPLC and HPTLC assays for the antimalarial agents; chloroquine, primaquine and bulaquine. J. Pharm. Biomed. Anal. 2003.33, 851–856.
- Lawal A., Umar R.A., Abubakar M.G., Faruk U.Z., Development and validation of UV spectrophotometric and HPLC methods for quantitative determination of chloroquine and amodiaquine in pharmaceutical formulations. Int. J. ChemTech Res. 2012. 4(2), 669 – 676.
- Augustijns P., Determination of chloroquine and desethylchloroquine in biological samples using perfusion chromatography and fluorescence detection. J. Liq. Chromatog. & Rel. Technol. 1997. 20, 1103 – 1113.
- Muller D., Blaschke G., Enantioselective assay of chloroquine and its main metabolite deethyl chloroquine in human plasma by capillary electrophoresis. J. Chromatogr. Sci. 2000. 38, 435 – 440.
- Karuppiah P.K., Basha K.A., Analytical method development for impurities present in hydroxy chloroquine sulphate from antimalarial tablet formulation. World J. Pharm. & Phramceut. Sci. 2014. 3(7), 1556 – 1567.
- ICH: Q1A. Stability testing of new drug substances and products, International Conference on Harmonization, Geneva, February 2003.
- ICH: Q1B. Photostability testing of new drug substances and products ,November,1996
- ICH: Q2B. Analytical Validation Methodology, November 1994.
- Ermer J., Validation in pharmaceutical analysis. Part I: an integrated approach, J. Pharm. Biomed. Anal., 2001. 24 (5-6), 755 – 767.


