
Chemistry Journal, Vol. 1, No. 4, August 2015 Publish Date: May 23, 2015 Pages: 124-132
The Complex Approach to Corrosion Protection of Steel in Coke-Plant Cooling Systems
Olena Smilka*
Water Supply, Sewerage and Water Purification Department of O. M. Beketov National University of Urban Economy in Kharkiv, Ukraine
Abstract
The paper discussed a methods to reduce the corrosion velocity of metals when use wastewater in coke-plant cooling systems. Focus was appointed on use phenolic water with corresponding reduction in the consumption of fresh water at use corrosion protection inhibitors for byproduct-coking industry. The corrosive activity depends on water quality and the inhibitor’s efficiency. The wastewater using in the water-cooling systems influenced on corrosive activity of water and exchange equipment at metallurgical and coke plants. The influence of corrosion and nitrification inhibitors based on thiocyanates, silicates, and phosphates, as well as optimum concentration make-up water additives, on the corrosive activity of phenolic wastewater used to cool coke-oven gas was investigated. The investigated inhibitors make slow corrosion. The use of complex approach to corrosion protection with addition inhibitors decrease corrosion. Thus, by use phenolic wastewater from coke plants, the consumption of pure natural water may be reduced.
Keywords
Carbon Steel, Phenolic Wastewater, Corrosion, Corrosion Inhibitors, Nitrification Inhibitors
Received: April 10, 2015
Accepted: May 1, 2015
Published online: May 22, 2015
@ 2015 The Authors. Published by American Institute of Science. This Open Access article is under the CC BY-NC license. http://creativecommons.org/licenses/by-nc/4.0/
1. Introduction
Carbon steel is widely used as construction material of heat exchange equipment on industrial metallurgical and coke plants, etc. Inhibition is one of the best known methods of corrosion protection. The inhibitor’s efficiency depends on the nature of environment (water quality, etc.), nature of metal surface, and the inhibitor structural feature, which includes number of adsorption centers in the molecule, and adsorption mode, metallic complexes formation and the projected area of inhibitor on the metal surface (Sastri, Perumareddi, 1997; Quraishi, Sharma, 2002; Ashry, Nemr, Esawy, Ragab, 2006).
To choose inhibitor it is necessary to consider the parameters of the heat exchange system, the quality and quantity of water used for cooling, price and availability of the inhibitor, the preparation and delivery methods, technological properties and economic efficiency.
The wastewater from coke production is traditionally sent for biochemical purification and then used for wet slaking of coke. The result is perceptible atmospheric pollution by poison substances and products of its decomposition. Dry slaking prevents such pollution, but some alternative means of processing the wastewater have to be found. The best option is to use the wastewater at the plant in the water-cooling systems. The properties of the water must be determined first at first. (Kucherenko, Gladkov, 1980; Shabalin, 1972).
For followed investigations, we proposed to employ the prevention of carbonate deposits in heat exchangers by introducing biologically treated phenolic wastewater in the circulating water for primary gas cooling (Nesterenko, Ignatov, 2002).
Experimental data and exploitation experience show that the introduction of biologically treated phenolic wastewater eliminates carbonate deposits in heat exchangers (Vinarskii, Papkov, 1978; Papkov, (1988).
The main purpose of treatment is to develop an approach of inhibitor protection of coke-plant heat exchangers when use biologically treated phenolic wastewater in the circulating water for primary gas cooling, together with stabilization circulating water.
Organic compounds contains hetero-atoms such as N, O and S have been reported effective corrosion inhibitors for metals and alloys (Popova, Christov, 2006; Chen, Lei, Ma, etc., 1999; Ashassi-Sorkhabi, Asghari, 2008; Shokary, Yuasa, Sekine etc., 1998; Li, Deng, Fu, Mu, 2009). Hence, in the present investigation new corrosion inhibitors and a nitrification inhibitor, based on HCNS, namely, thiocyanic acid salt (phosphoric acid and hydrogen xanthan), have been synthesized to investigate its inhibition effect on the corrosion of carbon steel in circulating water (phenolic wastewater and fresh water) at Kharkiv coke plant. Fig. 1 shows the chemical structure of synthesized (reaction ammonium thiocynates or sodium with phosphoric acid and hydrogen xanthan) nitrification inhibitor, based on HCNS (corrosion inhibitor – phosphate-silicate mixture and also a nitrification inhibitor):
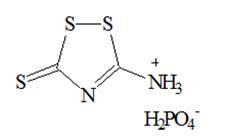
Fig. 1. Chemical structure of the tested inhibitor, based on HCNS.
The synthesis of the inhibitor, based on HCNS was done according to the follow reaction:
![]()
![]()
 +
+ ![]()
Any surface is characterized by high energy potential and presence of an excess energy, thus, many processes, namely, the formation of dense salt deposits, are spontaneous with a low value of activation energy. Inhibition of carbonate incrustation begins with the adsorption of surfactants at the centers with minimal surface energy 鈥growth steps, cations, groups of atoms, impurities, etc. As a result, adsorption of polyphosphates and nitrification inhibitor selectivity towards nitrifying bacteria growing crystal surface and the surface of the calcium carbonate of the inner wall of equipment is locked. This leads to the break in CaCO3 crystals growth and thus to the inhibition of salts incrustation on the metal surface.
The inhibition performance is evaluated by weight loss and polarization curves. To determine the optimal concentration of polyphosphates and orthophosphates, silicates and a nitrification inhibitor in the circulating water. The water-circulation process was simulated in laboratory.
2. Experimental
2.1. Materials
Electrochemical and gravimetric investigation methods and models were carried out on laboratory device with heat transfer (Tkachev, Nesterenko, Smilka, 2014). Operation of the device is similar to the water circulation system of water supply of coke production. The temperature of the cooling surface is 50-55 °C, the temperature in the cooling water tank is 30 °C. The effectiveness of chemical treatment of water was determined according to water corrosive activity. Reagent mixture was added to the water recycling system, together with the technical supplying water during the experiment.
2.1.1. Water Stabilization Measurements
Stabilizing treatment of circulating water was made to determine the optimum composition of the phenolic water use to supply circulating system in terms of heat transfer. As a result of investigations reduction in consumption of fresh industrial water used as supplying water was achieved.
Investigation of the stabilization of water treatment was conducted on water used in Kharkiv coke-plant cooling systems. Circulating water, biochemically purified phenol wastewater and fresh water from an artesian source were used in experiments. This water was supply in the coke plant’s water-circulating system.
In the evaporated liquid was determined the corrosion rate by potentiometric method (Khaled, Hackerman, 2003; Badr, El-Shamy, Ahmad etc., 2014; Ahamad, Khan, Ansari etc., 2011). Quality control was performed by physicochemical analysis of the original and the evaporated samples of circulating water on the following parameters: pH, alkalinity, hardness, salinity, the mass concentration of chlorides, etc. (Table. 2). The experiments were done in triplicate and the average value of the water quality control was noted.
2.1.2. Electrochemical Investigations
All electrochemical investigations were carried out in electrochemical cell with three electrodes connected with Instrument Potentiostat. The carbon steel (steel 3 – Cт3) of 1 sm2 was the working electrode, platinum electrode was used as an auxiliary electrode, and silver chloride electrode (SCE) (Ag/AgCl/KCl (1 M, aq) was used as reference electrode. All potentials were measured relative to SCE.
All electrochemical measurements were performed after the open circuit potential (OCP) was stabilized. Polarization curves were built by changing direction of current in the circuit polarized the electrode potential compare to corrosion potential (Ecorr). The electrochemical measurements were obtained by graphical Tafel extrapolation method (Freiman, Makarov, Bryksin, 1982; DSTU, 2006). All experiments were measured after immersion of the working electrode for 15-30 min in solution until determination of a potential.
2.2. Weight Loss Measurements
The weight loss measurements were carried out in a glass vessel containins 100 mL of supplying water in optimum concentration with and without addition of different concentrations of inhibitors at temperature 30 ºС and of circulating water at 55 ºС for 2-3 h immersion time. The samples were withdrawn, rinsed with doubly distilled water, washed acetone or alcohol, dried and weighed. The specimens before measuring were polished, cleaned and degreased, washed with alkaline solution, etched for 15 seconds in concentrated H2SO4 , rinsed with doubly distilled water. The experiments were done trice and the average value of the weight loss was noted.
3. Results and discussion
3.1. Water Stabilization Measurements
Influence of technological parameters of water-circulation systems and main components of salt water on its stability was determined.
Analysis of the composition of the circulating water when use phenolic wastewater shows that its content of corrosion activators are: 1200-1800 mg/dm3 chlorides; 500-800 mg/dm3 thiocyanates; pH 6.5-6.9; total ammonium content 700-1200 mg/dm3; water temperature 52-55°C; evaporation coefficient 2.2-2.4.
Analysis of water after biochemical units (BCU) showed a quite high content of chlorides, sulfates, and the solid precipitate and suspended solids. In closed water systems each major component of the salt composition of the circulating water has a definite influence on its corrosivity and scaling, or both processes simultaneously.
Supply water quality is poor, because the water analysis showed fairly high content of chlorides, sulfates, and high content of solid residue and suspended solids. A survey of the working water-circulation system installed a complete absence of scale deposits on heat transfer surfaces.
Kharkiv coke plant was suggested to supply treated wastewater after BCU in water-circulation systems for primary gas cooling as a recharge.
Determination of optimal quality supplying water produced different ratios of artesian and biochemically purified water under the terms of its thermal stability, without causing corrosion and scale.
Evaporation of the prepared mixtures was carried out at a temperature of supplying water is 30 °C, the temperature of circulating water is 55 °C, the evaporation coefficient respectively 2; 3; 4, respectively. For the tests were prepared following model aqueous mixture are shown in Table 1.
Table 1. The composition of model aqueous mixture.
| №experiment | The artesian water content, % | Water content after purified BCU,% |
| 1 | 100 | 0 |
| 2 | 90 | 10 |
| 3 | 85 | 15 |
| 4 | 80 | 20 |
| 5 | 70 | 30 |
| 6 | 0 | 100 |
To test water stabilization, the optimum concentration between artesian water and BCU purified phenolic wastewater as supply water (is 4:1) was determined. Increase the proportion of phenolic wastewater reduces the pH value to 7 and less, alkalinity to 1. According to general requirements to pH level it should correspond from 7 to 8 units and alkalinity is less than 4.
The main characteristics of the obtained aqueous mixtures before and after evaporation are shown in Table 2 and Fig. 2-4.
Table 2. Quality parameters of model water before and after evaporation obtained by laboratory testing.
| The condition of the experiment | № experi-ment | рН * (un.) | Alkalinity * (mmol/dm3) | Hardness * (mmol/dm3) | ОRP * (mV) | Mass concentration* (mg/dm3) | |
| Salts | |||||||
| Evaporation coefficient = 2* | 1 | 7,95 | 5,25 | 5,0 | 67 | 142 | 886 |
| 2 | 7,4 | 1,75 | 10,0 | 79 | 337 | 1934 | |
| 3 | 6,62 | 1,5 | 13,5 | 64 | 390 | 2795 | |
| 4 | 6,23 | 1,0 | 11,0 | 70 | 514 | 3730 | |
| 5 | 5,3 | 1,0 | 12,0 | 148 | 745 | 5385 | |
| 6 | 4,5 | 1,5 | 10,0 | 260-290 | 2305 | 15323 | |
| Evaporation coefficient = 3* | 1 | 7,87 | 4,75 | 2,5 | 86-82 | 354,5 | 609 |
| 2 | 7,34 | 1,5 | 11,0 | 118-102 | 532 | 1020 | |
| 3 | 6,18 | 1,0 | 13,0 | 131-148 | 798 | 1650 | |
| 4 | 5,72 | 1,0 | 10,5 | 151-178 | 974 | 1870 | |
| 5 | 5,15 | 1,5 | 11,5 | 236-250 | 1063 | 2640 | |
| 6 | 4,7 | 1,0 | 10,0 | 315-330 | 3013 | 9690 | |
| Evaporation coefficient =4* | 1 | 7,87 | 4,5 | 3,0 | 70-53 | 532 | 771 |
| 2 | 7,49 | 1,75 | 15,5 | 73-55 | 975 | 1480 | |
| 3 | 6,12 | 0,5 | 16,0 | 113-187 | 1063 | 1960 | |
| 4 | 5,56 | 0,75 | 18,0 | 164-210 | 1329 | 2610 | |
| 5 | 5,89 | 1 | 17,5 | 119-143 | 1241 | 3660 | |
| 6 | 4,9 | 1,25 | 13,0 | 307-312 | 3706 | 12260 | |
* – shows the average value (the experiments were done trice).
Table 3. Polarization parameters for carbon steel in water solution in different model water at optimal concentration from evaporation coefficient.
| The condition of the experiment | №experiment | Ecorr (mV/ SSCE) | Icorr (μA/SSCE) | E (%) |
| Circulating water | - | 640 | 92 | - |
| Evaporation coefficient = 2 | 1 | 642 | 77 | 16,3 |
| 2 | 658 | 57 | 38,0 | |
| 3 | 678 | 48 | 47,8 | |
| 4 | 676 | 52 | 43,5 | |
| 5 | 674 | 57 | 38,0 | |
| 6 | 651 | 48 | 47,8 | |
| Evaporation coefficient = 3 | 1 | 651 | 32 | 65,2 |
| 2 | 628 | 34 | 63,0 | |
| 3 | 680 | 43 | 53,3 | |
| 4 | 685 | 45 | 51,1 | |
| 5 | 686 | 48 | 47,8 | |
| 6 | 618 | 53 | 42,4 | |
| Evaporation coefficient = 4 | 1 | 654 | 72 | 21,7 |
| 2 | 613 | 32 | 65,2 | |
| 3 | 648 | 48 | 47,8 | |
| 4 | 670 | 60 | 34,8 | |
| 5 | 672 | 47 | 48,9 | |
| 6 | 611 | 50 | 45,7 |
Table 4. Polarization parameters for carbon steel in circulation water in the absence and present of different inhibitors at supplying water at optimum concentration.
| Inhibitor | Concentration, mg/dm3 | Weight loss (g m–2 h–1) | E (%) | CR (mm y–1) |
| The circulating water at Kharkiv coke plant with no corrosion inhibitors | - | 1,75 | - | 1,95 |
| Sodium silicate | 50 | 1,19 | 32 | 1,33 |
| 100 | 0,96 | 45 | 1,07 | |
| Sodium polyphosphate | 100 | 0,81 | 54 | 0,90 |
| 200 | 0,71 | 59 | 0,79 | |
| Mixture of sodium silicate and sodium polyphosphate 10 : 1 | 50 | 0,36 | 79 | 0,40 |
| 100 | 0,29 | 83 | 0,32 |
Research shows that the optimal ratio of artesian and phenolic waters is 80:20%. However, even at this ratio artesian and phenolic wastewater as supply water requires the addition of corrosion inhibitors to the water-circulation system.
3.2. Potentiodynamic Polarization Measurements
The corrosion potential (Ecorr), corrosion current density (Icorr), and anodic (ba) and cathodic (bc) slopes are obtained by the anodic and cathodic area of the Tafel plots. The corrosion current density (Icorr) may be obtained by extrapolating the Tafel lines to the corrosion potential (Khaled, Hackerman, 2003; Badr, El-Shamy, Ahmad etc., 2014; Ahamad, Khan, Ansari etc., 2014; DSTU, 2006) and the inhibition efficiency (E%) values were calculated from the relation:
![]()
where Icorr and Icorr(i) are corrosion current densities obtained in absence and presence of inhibitors, respectively.
3.2.1. Potentiodynamic Polarization Measurements in Stabilization
Table 3 represents all corrosion parameters including inhibition efficiency of obtained from Tafel polarization studies. The polarization curves for carbon steel in the absence and in the presence of inhibitors at water optimum concentrations are given in Fig. 2-4. The parallel cathodic Tafel lines (Fig. 2-4) suggested that the addition of phenolic wastewater to the solution (supplying water) modify of evaporation coefficient to changes the corrosion at the carbon steel surface.

Fig. 2. Tafel plots for carbon steel in recycling water contains optimal concentration of supplying water from evaporation coefficient 2: (1-6) experience number.
Table 3 shows that the corrosion current density (Icorr) values decreased considerably in the present process of evaporation and presence phenolic water. If the coefficient value is 4, the evaporation rate of corrosion (Fig. 2-4, Table 3) ranges from 0.5 to 0.78 g / m2 h according to the evaporation coefficient. Biochemically purified water and phenolic wastewater use as supplying of circulation water systems. At the same time, the mass concentration is lower than the source water, which indicates decay of hydrocarbonate ions to form carbonate ions, which react with calcium ions, and result is a formation of calcium carbonate precipitate (experiments №2-6). In this case the carbonate deposits were observed on the surface of samples (experiment №1).
Laboratory investigations show an absence of scale on the surface of the samples with increased evaporation coefficient. It was established (Fig. 2-4) to decrease the corrosion rate to 0.3-0.55 g / m2 h range. However, ORP value reached 100 mV, indicate that simultaneously with decrease of oxygen solubility and increase the salinity nitrification processes occur (Table 2). Therefore, nitrification inhibitors must be used to protect corrosion and scaling of equipment, working in conditions of nitrification.
3.2.2. Potentiodynamic Polarization Measurements of Inhibitors
At testing corrosion inhibitors, their protective effect at concentrations of 100–200 mg/dm3 is determined (Nesterenko, Stasenko, Bondarenko etc., 1994). Electrochemical data regarding the influence of corrosion inhibitors are shown in Fig. 5 and Table 4. Analysis of the anodic and cathodic polarization curves (Fig.5) shows that introducing liquid glass and sodium phosphate as corrosion inhibitors slows the process. The electrochemical data indicate that a 10 : 1 mixture of liquid glass and sodium polyphosphate is the most effective, accessible, and expedient corrosion inhibitor.
Inhibitor composition cannot be used in the presence of ammonium salts in the circulating system, in reason of salts accumulate. For example, phenolic wastewaters from coke production, as in reversible cycles of cooling flows through the oxidation of ammonia nitrogen and the excretion of hydrogen ions, moreover, the acidification of the medium to pH 5.5-6.0. With these pH values protective action the composition inhibitor is reduced and it is not effective.

Fig. 3. Tafel plots for carbon steel in recycling water contains optimal concentration supplying water from evaporation coefficient 3: (1-6) experience number.

Fig. 4. Tafel plots for carbon steel in recycling water contains optimal concentration supplying water from evaporation coefficient 4: 1-6 experience number.
In the ammonium compounds of nitrification process are oxidized by nitrifying bacteria (aerobic) in the following reactions:
![]()
![]()
![]() .
.
Therefore, to prevent corrosion of metals in industrial water-circulation systems that contain ammonia nitrogen, it is necessary to use multi-component composition such as a mixture consisting of corrosion inhibitors and nitrification inhibitors (Nesterenko, Tkachev, Smilka, 2013).
3.3. Effect of Inhibitor Concentration
The max effect from inhibitors addition was evaluated by weight loss measurements. The inhibition efficiency (E%) and corrosion rate (CR, mm year–1) were calculated according to the Eqs. 1, 2 and 3 (DSTU, 2006; Ahamad, Prasad, Quraishi, 2010; Nesterenko, Tkachev, Smilka, 2011), respectively.
![]() (1)
(1)
where w0 and wi are the values of corrosion weight losses of carbon steel in uninhibited and inhibited solutions, respectively.

Fig. 5. Polarization curves of carbon steel in the circulating water at Kharkiv coke plant: (1, 1') with no corrosion inhibitors; (2, 2 ') with sodium silicate (50 mg/dm3); (3, 3 ') with sodium silicate (100 mg/dm3); (4, 4') with a 10 : 1 mixture of sodium silicate and sodium polyphosphate (50 mg/dm3); (5, 5') with a 10 : 1 mixture of sodium silicate and sodium polyphosphate (100 mg/dm3).
(2)
where D is the density of carbon steel (g cm–3), w is corrosion weight loss of carbon steel (g/m2h) (Eqs. 3),
![]() (3)
(3)
where A – the area of the carbon steel specimen (cm2), T is the exposure time (h) and m1 and m2 are weight plates before and after the test (g).
The values of inhibition efficiencies (E%) and corrosion rates (CR) obtained from weight loss measurements for different concentration of inhibitor composition are given in Fig. 5 and Table 3.
Gravimetric tests of carbon steel samples in such circulating water show that its corrosive activity is 2.2–2.4 mm/yr, with nonuniform distribution of the damage: after a month, depths of 1.5–2.0 mm are seen in corrosion pits.
To determine the optimal concentration of polyphosphates and orthophosphates in the circulating water, laboratory equipment simulating the water-circulation system is constructed. Dosing units are used to supply the inhibitors (liquid glass and sodium polyphosphate) (Nesterenko, Tkachev, Smilka, 2011).
The reagent for corrosion prevention includes a corrosion inhibitor (phosphate–silicate mixture) and also a nitrification inhibitor. The phosphate–silicate mixture is produced by mixing sodium polyphosphate with sodium silicate (liquid glass) in the ratio 1 : (5–10). Thiocyanates are used as the nitrification inhibitors.
Table 5. The content of the composition.
| Name components | The content of components in the composition | |||||||
| I | II | III | IV | V | VI | VII | VIII | |
| Sodium polyphosphate (GOST 20291-80 Sodium polyphosphate. TT) | 5 | 9 | 9 | 8,9 | 8,8 | 12 | 16,5 | 20 |
| Sodium silicate (GOST 50418-92 Soluble sodium silicate. TT) | 94 | 90,5 | 90 | 89,1 | 88,2 | 87 | 82,5 | 79 |
| Thiocyanic acid salt (phosphoric acid and hydrogen xanthan) | 1 | 0,5 | 1 | 2 | 3 | 1 | 1 | 1 |
| The ratio of silicate to sodium polyphosphate | 1:18,8 | 1:10 | 1:10 | 1:10 | 1:10 | 1:7,25 | 1:5 | 1:3,95 |
The composition of the proposed composition is shown in Table. 3. The analysis of the properties of the proposed composition compared to the known composition shown in Table. 4. Carbon steel corrosion rate decreases when the composition is administered at a concentration of 100 mg/dm3 at a ratio of polyphosphate: silicate is 1: (5-10) (Table. 4). As an inhibitor of nitrification thiocyanic acid derivatives are used, the ratio of corrosion inhibitor to the nitrogen-containing component nitrification inhibitor – corrosion inhibitor: nitrification inhibitor is 100: 1-50: 1 by weight calculated.
The corrosive activity of the circulating water with the dosing of corrosion inhibitors (phosphates and silicates) and a nitrification inhibitor (based on HCNS) is assessed gravimetrically. The results of the corresponding corrosion tests, with inhibitors, are summarized in Table 5, 6.
The combined use of those inhibitors permits high selectivity with respect to nitrifying bacteria such as Nitrosospira, Nitrosocacus, Nitrosolobus, and Nitrosomonos and protects against corrosion. Correspondingly, the corrosion rate of carbon steel in the cooling system is <0.2 mm/yr, with no carbonate deposits in the heat exchangers.
The proposed technical solution provides a high protective effect against corrosion due to the high selectivity of suppressing activity of nitrifying bacteria and high adsorption capacity of phosphate and silicate on the surface of carbon steel, moreover, the smooth operation of heat exchange equipment by reducing the content of suspended matter in the circulating water.
Table 6. The corrosion rate of carbon steel with addition inhibitor composition.
| Properties | Indicators of the composition that is offered | ||||||||
| I | II | III | IV | V | VI | VII | VIII | composition* | |
| The corrosion rate of carbon steel in model circulating water, g/m2•h ** | 0,35 | 0,25 | 0,15 | 0,17 | 0,16 | 0,17 | 0,15 | 0,43 | 0,64 |
*Recovered 50 mg/dm3 of a composition which was prepared (Ivonin, Zavolkin, Shykailo, 2006) (in the container to prepare 1 dm3 of water further added 50 g of 3 (5) methylpyrazole and 120 g citric acid).
**Corrosion rate was determined by the potentiostatic method in the circulating water of chlorides - 200 mg/dm3, sulfate - 400 mg/dm3, ammonium ions - 250 mg/dm3, nitrates - 150 mg/dm3, nitrites - 10 mg/ dm 3, pH - 7.4 at 50 °C. The concentration of the inventive composition is a corrosion inhibitor 100 mg/dm3, nitrification inhibitor and 1 mg/dm3 (Nesterenko, Smilka, Grigorov etc., 2014).
4. Conclusions
The relation between optimal artesian water and purified after BCU was established, which is (artesian - phenolic wastewater) 4: 1, respectively, and does not cause corrosion activity.
Reagents consist of corrosion inhibitors (phosphates and silicates) and a nitrification inhibitor (based on HCNS) was established. The results of reagent and optimal supplying water ratio using, decrease total corrosion of carbon steel to acceptable levels of 0.2–0.3 mm/yr with unchanging corrosion, and also reduces the content of suspended matter in the circulating water (to 50–100 mg/dm3).
Accordingly, the Kharkiv coke-plant circulating water cooling system can be replenished by means of coke-plant wastewater and biochemically purified wastewater, which contains ammoniacal nitrogen, nitrification products and oxidized forms of nitrogen (nitrites and nitrates).
Proposed technical solution provides uninterrupted operation of heat exchange equipment by reducing the amount of suspended matter. Based on it, the water-circulation system will operate as a practically closed loop, with corresponding reduction in the consumption of fresh water (in 2-3 times) by increasing the heat transfer coefficient.
Economic efficiency of the proposed approach protection of heat exchangers heat transfer equipment coke production from corrosion and scale is achieved by reducing the consumption of fresh water and increase the heat transfer coefficient with a 2.2-2.3 to 4.0-4.5.
References
- Ashassi-Sorkhabi H., Asghari E. (2008), Electrochim. Acta, Vol. 54, 162.
- Ashry E.S.H. El, Nemr A. El, Esawy S.A., Ragab S. (2006), Electrochim. Acta, Vol. 51, 3957.
- Ahamad I., Khan S., Ansari K. R. and Quraishi M. A. (2011), J. Chem. Pharm. Res., 3(2):703-717.
- Ahamad I., Prasad R., Quraishi M.A. (2010), Corros.Sci. 52. doi:10.1016/ j.corsci.2009.11.016.
- Ahamad I., Quraishi M.A. (2009), Corros. Sci. doi: 10.1016/j.corsci.2009.05.026.
- Badr E. E., El-Shamy O. A. A., Ahmad E. M. and Hilalc N. M. (2014), Der Chemica Sinica, 5(1):161-168.
- Chen S. Li, S., Lei S., Ma H., Yu R., Liu D. (1999), Corros.Sci., Vol. 41, 1273.
- DSTU(2006)4500-4:2006. Loads dangerous. Test methods. The method of experimental determination of corrosive substances. – Kyiv: State Committee of Ukraine.
- Freiman L.I., Makarov V.A., Bryksin I.E. (1982), Potentiostatic methods in research and electrochemical corrosion protection. – Leningrad: Chemistry.
- IvoninM.V,ZavolkinV.I,ShykailoB.M(2006),Ukrainianpatent66669.
- Khaled K.F., Hackerman N. (2003), Electrochim. Acta, Vol. 48, 2715.
- Kucherenko D.I. and Gladkov V.A. (1980), Oborotnoe vodosnabzhenie (Sistemy vodyanogo okhlazhdeniya) (Water-Circulation Systems for Industrial Cooling), Moscow: Stroiizdat.
- Li X., Deng S., Fu H., Mu G. (2009), Corros. Sci, Vol. 51, 620.
- Nesterenko S.V. and Ignatov, I.I. (2002), Biocidal corrosion inhibitors, Kommunal’noe khozyaistvo gorodov (The Municipal Economy), Kiev: Tekhnika, issue 45: 130–132.
- Nesterenko, S.V., Stasenko, S.P., Bondarenko, V.M., et al. (1994), Russian patent 2019519.
- Nesterenko S.V., Smilka O. P., Grigorov V.I., Canadal L.D., Bannikov L.P., Tkachev V.O. (2014), Ukrainian patent 87358.
- Nesterenko S.V., Tkachev V.A. and Smilka E.P. (2011), Energy-saving water processing for corrosion and scale prevention, Ekologicheskaya bezospasnost’ Okhrana vodnogo i vozdushnogo basseinov. Utilizatsiya otkhodov: sb. nauch. tr. XIX mezhdunar. nauch._tekhn. konf., g. Berdyansk (Environmental Safety, Water and Air Protection, Waste Processing: Proceedings of the Nineteenth International Conference, Berdyansk), Kharkov: Ukrvodgeo, pp. 222–231.
- Nesterenko S.V., Tkachev V.A. and Smilka E.P. (2013) Reducing the Corrosion Losses of Metals when Using Phenolic Wastewater in Coke-Plant Cooling Systems: Allerton Press, Inc., Vol. 56, No. 8, pp. 286–291.
- Papkov, G.I. (1988), Waste free coke production with dry slaking, Doctoral Dissertation, Kharkov, 1988.
- Popova A., Christov M. (2006), Corros. Sci., Vol. 48, 3208.
- SastriV.S.,PerumareddiJ.R. (1997),Corrosion,Vol.53, 617.
- Shabalin A.F. (1972), Oborotnoe vodosnabzhenie promyshlennykh predpriyatii (Water-Circulation Systems at Industrial Enterprises), Moscow: Stroiizdat.
- ShokaryH.,YuasaM.,SekineI.,IssaR.M.,El-BaradieH.Y.,GommaG.K. (1998),Corros.Sci., Vol. 40, 2173.
- Tkachev V.A.,Nesterenko S.V. and Smilka E.P. (2014), Stabilization Water Treatment in Coke-Plant Cooling Systems when Using Phenolic Wastewater (International Conference “Water supply and wastewster treatment in towns and communities”: Ecwatech LTD,Moscow,pp. 180–188. – Allerton Press, Inc.
- Quraishi M.A., Sharma H.K. (2002), Mater. Chem. Phys. 78, 18.
- Vinarskii, N.S. and Papkov, G.I. (1978), Using coke-plant wastewater in water-circulation systems, Express Inform., ser.10, no. 1, pp. 7–10.


