
Chemistry Journal, Vol. 1, No. 3, June 2015 Publish Date: May 14, 2015 Pages: 116-123
Evaluation of Photoionization Detector Performance for the Measure of Toluene Vapors
Azimi Pirsaraei Seyed Reza1, Asilian Mahabadi Hasan1, *, Jonidi Jafari Ahmad2, Mehrasbi Mohammad Reza3
1Occupational Health Engineering Department, Faculty of Medical Sciences, Tarbiat Modares University, Jalal Ale Ahmad Highway, Tehran, IR Iran
2Environmental Engineering Department, Faculty of Health, Iran University of Medical Sciences, Shahid Hemmat Highway, Tehran, IR Iran
3Environmental Engineering Department, Faculty of Health, Zanjan University of Medical Sciences, Zanjan, IR Iran
Abstract
A common measurement device for evaluating the volatile organic compounds (VOCs) concentration is a gas chromatograph generally equipped with a flame ionization detector (GC-FID). However, there are some limitations in working with these equipments including accessibility of them, need to highly trained operators, and the high cost of sample analysis. These restrictions result in the replacement of some direct reading methods, including the use of photoionization detector (PID).The aim of this study was to evaluate the performance of PID as a substitution for GC-FID in the measurement of toluene vapors in a continuous flow system. An experimental set up was designed for generating the toluene vapors known concentrations at 5, 20, 50, 100, 200, 500 and 1000 ppm. The concentrations were measured with both a PID system and a reference method. The correlation coefficients for the concentrations of toluene vapors at 5 to 100 ppm; at 100 to 1000 ppm and at 5 to 1000 ppm were 0.999, 1.0 and 0.999 respectively. Paired t test indicated a significant difference (P < 0.02) between the toluene concentrations in NIOSH reference method and the PID system at higher than 50 ppm but at 4 ppm and 20 ppm, there was no significant difference (P >0.05). In both methods, the coefficient of variation was less at concentrations greater than 100 ppm, thus the response of both devices had fewer variations, in comparison with the concentrations lower than 100 ppm. The correction factor for the PID system was obtained 1.05.Although the results the PID system was different from NIOSH reference method, the PID system response was linear. Thus, in this study the results were acceptable for the toluene vapors generated in a continuous flow system that was measured with the PID system.
Keywords
Toluene, Gas Chromatography, Flame Ionization Detector, Photo Ionization Detector, Direct Reading Method
Received: April 8, 2015 / Accepted: April 18, 2015 / Published online: May 11, 2015
@ 2015 The Authors. Published by American Institute of Science. This Open Access article is under the CC BY-NC license. http://creativecommons.org/licenses/by-nc/4.0/
Contents
1. Introduction 2. Experimental Details 2.1. Experimental Setup for Generating the Toluene Known Concentration in Air 2.2. Toluene Concentration Measurement by the NIOSH Reference Method 2.3. Toluene Concentration Measurement with the Photoionization Detector 3. Results and Discussion 4. Conclusions Acknowledgments Abbreviations
1. Introduction
Volatile organic compounds (VOCs) are a major group of air contaminants that are emitted from various sources. They contain more than 300 compounds such as oxygenated hydrocarbons, aromatic hydrocarbons and halogenated hydrocarbons [1-3]. Benzene, toluene, ethyl benzene, xylene (BTEX) compounds are the most important. These are abundantly found in cities and industrial areas and are classified as toxic priority pollutants. Their major problem in the atmosphere is the risk of cancer and production of "Air Toxic" [4,5]. Toluene is highly used in oils, paints, resins, detergents, preparation of chemicals agents, rubber, printing ink, adhesives, polishes, leather tanning and disinfectants. It is used as an octane improvement of gasoline in internal combustion engines, petrol and other aviation fuels to raise octane number. Due to economic aspects, toluene is added to amount of vehicle fuel as a "fuel additive" in some countries.
In toxicology studies of human chronic exposures to toluene vapors have been recognized including the central and peripheral nervous system (CNS & PNS), depression along with the subjective symptoms including euphoria, dizziness, tremor, felt a buzzing in the ears, blurred vision, lack of muscle control, seizures, eye and nasal irritation, fatigue and will eventually damage the kidneys and liver.
The International Agency for Research on Cancer (IARC) has classified toluene in group 3 and according to American Conference of Industrial Hygienists (ACGIH), it is a hazardous air pollutant and classified in group A4 of carcinogenic substances [6,7]. The different methods (adsorption, thermal and catalytic oxidation and advanced oxidation processes) is used to remove it from polluted air stream [8]. One of the important points in these studies is the evaluation of the concentration changes during the time of passing the polluted air through the reactor system (before and after of the reactor). A common measurement device for evaluating the VOCs concentration is a gas chromatograph generally equipped with a flame ionization detector (GC-FID) which is located on-line. The gas chromatograph (GC) equipments have some advantages, such as appropriate validity and accuracy, specific performance, and distinguishing the volatile organic compounds.
However, there are some limitations in working with these equipments, including accessibility of them, need to highly trained operators, and the high cost of sample analysis. The most important restriction occurs when the time length dedicated to each analysis that is more than the period of time need to assess the reactor efficiency in a continuous flow system of VOCs. In other words, when the gas chromatograph is used; the researcher loses the some data if the retention time dedicated to the compound be more than the determined intervals for concentration measurement of it .Another limitation appears at the time of measuring the minimum or maximum of the reactor performance. In other words, if the concentration changes occur in this interval, some important data relating to the reactor efficiency will be lost [9,10].
These restrictions are the most important part of the replacement of direct reading methods, including the use of photoionization detector (PID) [11].
Coy et al. found the following correlation (equation1) when they have calibrated the PID for isobutylene and sampling with charcoal for GC:
![]() (1)
(1)
This calibration was applied for evaluating the vapors from painting operations, including such compounds as petroleum distillates, mineral spirits, isobutyl acetate, isobutyl alcohol, isopropanol, toluene, xylenes, ethylbenzene, and methyl ethyl ketone (MEK) [12]. Drummond has studied the gasoline vapors that were measured with a PID worn by a tanker truck driver during loading [13]. The benzene average concentration that was determined with charcoal tubes and lab GC was correlated with the isobutylene calibrated PID as follows (equation 2):
![]() (2)
(2)
In a study, Poirot et al. compared the PID readings with the results of a standard method. The findings confirmed the linearity of these two methods relationship.
The PID performance was evaluated in the studies that carried out by Barsky et al. and Lee et al. According to their opinion, the moisture was effective on the system performance, although the PID response in case of the stability of the relative humidity (RH) was linear. Lee et al. assigned that the PID values were lower than true values under each humidity condition [14-16]. Also, Rismanchian et al. evaluated the performance of photoionization detector system as a substitution for gas chromatography in the measurement of three xylene isomers mixtures (from 10 to 260 ppm). The findings showed a good correlation between the PID results and the National Institute of Occupational Safety and Health (NIOSH) reference method results in an atmosphere with relative humidity of 0%, 20%, and 80% that were 0.993, 0.992, and 0.991 respectively. Also the total correlation was 0.989. The paired t test indicated a significant difference between actual concentrations in reference method and the extracted concentration from PID [9].
The aim of our study was evaluate the PID system performance in the concentration range of 5 to 1000 ppm of toluene, so that it could be as a direct reading system instead of GC-FID equipment.
2. Experimental Details
2.1. Experimental Setup for Generating the Toluene Known Concentration in Air
This study was carried out by an experimental set up for generating known concentrations [17]. The schematic design of this setup has been illustrated in fig. 1.
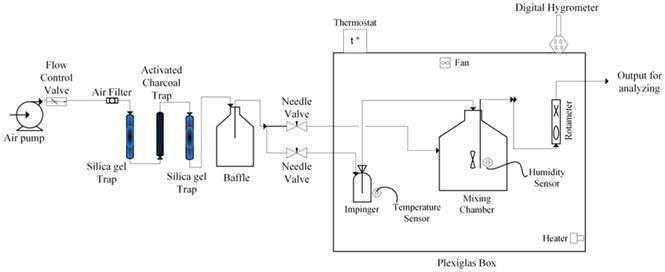
Fig. 1. The schematic of experimental setup
To perform the tests, the setup was adjusted with a direct reading PID system (PhoCheck Tiger, Ionscience company, England, ±5% displayed reading ±1 digit) for making the concentration of toluene (GC grade made by Merck Co, Germany) in the ranges of 5, 20, 50, 100, 200, 500 and 1000 ppm. Before measuring, the PID instrument was adjusted for reading the toluene according to the manufacturer’s instruction to implement the necessary correction with software for the presented values of toluene. The toluene concentration in each case was measured at 20 min intervals with real time PhoCheck Tiger PID.
In order to generate the stable concentrations of toluene, the saturation vapors method was used. Based on Antoine’s equation, the liquids vapor pressure depends on the temperature and the surface evaporation rate depends on the vapor pressure [18]. All containers and connectors were placed inside a temperature controlled chamber made of Plexiglas with 5 mm thickness (see fig. 1). Thus a heater thermostat system was used to control temperature of the box. If the box temperature is reduced to 31.7°C, the thermostat turns the heater on. The sensor of this electronic thermostat (Han Young Nux Co.Ltd, model BR6_FDMP4 Temp controller) was placed on the midget impinger wall contained toluene liquid. In order to ensure proper operation of the system, the temperature of the box was controlled with a digital thermometer (testo 625, Germany) which was placed inside of the chamber.
Also the relative humidity in mixing chamber was measured with an electronic hygrometer (SAMWON ENG, model SU-503B %RH controller) and maintained at 13% ±3. The air flow rate in continuous generating system of toluene vapor was stabled at 1 l/min.
2.2. Toluene Concentration Measurement by the NIOSH Reference Method
The NIOSH 1501 reference method was used to measure the toluene concentration that generating via the experimental setup. According to the method, the sampling was done during 20 min using 150 mg coconut shell activated charcoal tubes (20/40 mesh) SKC Cat. No 226-01 Lot # 2000 and air sampling pump (224-44XR model SKC Inc, UK) at air flow rate of 200 ml/min [19]. The air sampling pump was calibrated using bubble soap burette as well as checked with the electronic calibrator Bios (DryCal® DC-Lite) before the beginning of sampling. After the sampling, the samples were prepared based on the reference method and the front and backup sections of the sorbent tube were analyzed separately.
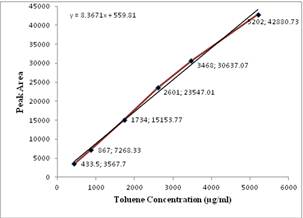
Fig. 2. The gas chromatograph calibration curve for toluene (r2=0.996)
Desorption of toluene from activated charcoals was done with 1ml of carbon disulfide. After standing at least 30 min with occasional agitation an aliquot of the resultant solution (1µl) was injected into the Agilent 7890A gas chromatograph (split ratio= 1:1) equipped with a flame ionization detector (FID) and a capillary fused silica column HP-5 (5% Phenyl 95% dimethylpolysiloxane, 30m×0.32 mm ID, 0.25µm film thickness). The injector block and the detector were maintained at 250°C and 300°C respectively. The oven temperature programming was 40°C (2 min) to 150°C (3 min) rate 20°C/min. The flow rate of nitrogen carrier gas, H2 and air were 2.6 ml/min, 30 ml/min and 300 ml/min respectively. The toluene concentration in the samples was determined by using the calibration curve (fig. 2). In all cases, data points presented here are averages of at least three measurements. The breakthrough of all samples was controlled.
2.3. Toluene Concentration Measurement with the Photoionization Detector
The toluene measurements were strictly contemporary done with using PhoCheck Tiger PID, equipped with a 10.6 eV lamp and an internal sample draw pump with the flow of 220 ml/min. The equipment was calibrated with isobutylene with a concentration of 100 ppm in the air and at temperature of 22.5°C and 750 mmHg based on the manufacturer’s instruction.
The PID system was attached to the same output of the specific concentration generating system before and after each sampling that was done according to the reference method. In other words, for each sampling based on the reference method, two readings were done with the same interval (20 min sampling period with activated charcoal tube) and totally for each test (or any concentration), twelve readings were recorded.
3. Results and Discussion
As it was mentioned formerly, after making the specific concentration in the designed setup, the passing air through the output (flow rate 1 l/min) was adjusted into seven concentrations (5, 20, 50, 100, 200, 500 and 1000 ppm) at 13% ±3% relative humidity. In table 1, the mean and standard deviation of the obtained values through the measurement of made concentrations with using both PID and the NIOSH reference method are illustrated as well as the mean and standard deviation of the instrument correction factor (CF) which is the ratio of the measured concentration with GC-FID in each test to the measured value with PID system in the same test. The overall mean of the PID correction factor for all the concentration ranges was 1.05 with the standard deviation of 0.03, which means that the concentration of 200 ppm read with PID is proportional the concentration of 210 ppm determined with GC-FID.
The coefficient of variation (CV) mean and standard deviation in the PID system and NIOSH reference method in the concentration range from 5 to 1000 ppm were 6.65 (± 5.43) and 5.63 (± 5.88) respectively. As can be observed in table 2, in both PID system and NIOSH reference method, with increasing the toluene concentration from 5 to 50 ppm, the coefficient of variation is increased, while in the concentration of 100 to 1000 ppm, the CV is decreased.
Table 1. Toluene measurement results with PID instrument and the NIOSH reference method in different concentrations
| Representative Concentration (ppm) | Toluene measurement with PID system mean (SD) | Toluene concentration by NIOSH reference method mean (SD) | PID system correction factor (CF) |
| 5 | 4.82 (0.42) | 5.01 (0.23) | 1.04 |
| 20 | 19.01 (2.67) | 20.53 (3.31) | 1.07 |
| 50 | 49.47 (3.96) | 53.43 (6.10) | 1.08 |
| 100 | 102.57 (5.37) | 113.28 (3.08) | 1.10 |
| 200 | 204.07 (7.22) | 212.85 (6.27) | 1.04 |
| 500 | 501.67 (6.92) | 513.93 (5.62) | 1.02 |
| 1000 | 1008.19 (7.15) | 1016.53 (5.12) | 1.01 |
Table 2. The coefficient of variation (CV) in the PID system and NIOSH reference method
| Representative Concentration (ppm) | CV in PID system | CV in NIOSH method |
| 5 | 8.71 | 4.58 |
| 20 | 14.98 | 16.15 |
| 50 | 12.01 | 11.42 |
| 100 | 5.23 | 2.72 |
| 200 | 3.54 | 2.97 |
| 500 | 1.37 | 1.09 |
| 1000 | 0.71 | 0.51 |
In other words, at higher concentrations of 100 ppm, both devices offer a better response. Fig. 3 (a) and (b) show the correlation between the values extracted from PID system and the NIOSH reference method at toluene concentrations from 5 to 100 ppm and 100 to 1000 ppm respectively. The fig. 3 (c) shows the total correlation between PID and NIOSH reference at toluene concentration from 5 to 1000 ppm.
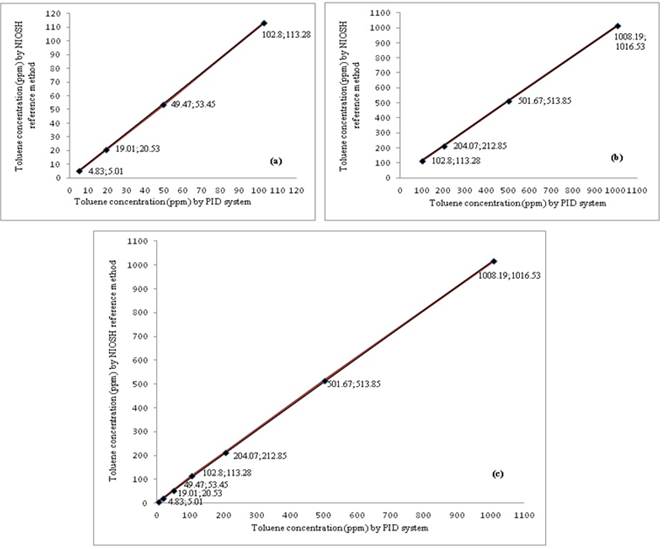
Fig. 3. The correlation between (PID) results and the NIOSH reference method results at (a) below at 100 ppm, (b) from 100 to 1000 ppm and (c) total correlation from 5 to 1000 ppm
In both methods, at toluene concentrations lower than 100 ppm and from 100 to 1000 ppm, the correlation coefficients were statistically significant (r2=0.999 and r2=1, respectively from equation 3 and 4). Also the total correlation coefficient at toluene concentrations from 5 to 1000 ppm was very good (r2=0.999, from equation 5).
At toluene concentrations higher than 100 ppm, the response of PID system was linear. The following correlation linear equations are presented respectively:
![]() (3)
(3)
![]() (4)
(4)
![]() (5)
(5)
In above equations, the y and x values represent the toluene concentration in ppm at NIOSH reference method and PID system, respectively.
In this study the response of these equipments, in terms of different concentrations are investigated. At higher than 50 ppm the paired t-test indicates a statistically significant difference between the toluene concentrations in NIOSH reference method and the PID system (P < 0.02). In other words, the extracted results from these methods are not identical. This finding may be due to this matter of fact that the calibration of the PID equipment is done according to manufacturer’s instruction, which is based on the concentration of isobutylene which is 100 ppm. However, at concentrations of 4 ppm and 20 ppm, there is no statistically significant difference (P >0.05) between the NIOSH reference method and PID system. In both methods, at toluene concentrations higher than 100 ppm, the coefficient of variation, in comparison with the concentrations lower than 100 ppm shows fewer variations. There is no significant difference (P > 0.1) between the CV of the NIOSH reference method and PID system.
The correlation coefficient for toluene concentrations from 5 to 100 ppm and from 100 to 1000 ppm were 0.999, 1.0 respectively. The total correlation coefficient for toluene concentrations from 5 to 1000 ppm was 0.999. In all cases, the linear changes were obtained from the PID system results in comparison with the NIOSH reference method. This inference was similar to the studies that were conducted by Coffey et al. as well as Poirot et al. [14,20].
The calculation of photoionization equipment correction factor (the measured concentrations from NIOSH reference method divided to the concentrations measured from PID system) was 1.05 indicated that it was a 5% difference due to calibration PID system by isobutylene.
The results of our study are comparable to the issues of Rismanchian et al. investigation [9]. They have evaluated the performance of photoionization detector system as a substitution for gas chromatography in the measurement of a three xylene isomer mixtures (at concentration ranges from 10 to 260 ppm xylene) as a representative of the VOCs.
Based on their conclusions, although the obtained results of the PID system was different from the reference method; its response was linear. In their study the correlation between the PID results and the NIOSH reference method results in an atmosphere with relative humidity of 0%, 20%, and 80% were 0.993, 0.992, and 0.991 respectively, and total correlation was 0.989. Their study showed a significant difference (p<0.001) between actual concentrations in reference method and the extracted concentration from PID system [9].
Coffey et al. have evaluated the performance of field portable direct-reading organic vapor monitors (DROVMs) at three temperatures (4°C, 21°C, and 38°C), three relative humidity (30%, 60%, and 90%), and two hexane concentrations (5 ppm and 100 ppm). The conclusion was that the monitors can be used as the survey tools. In another research by Coffey et al. the performance of three MIRAN SapphIRe Portable Infrared Ambient Air Analyzers and three Century Portable Toxic Vapor Analyzers equipped with PID and FID was compared with charcoal tube sampling. They reported that there was a statistically significant difference among readings from all monitor types (p <0.0001). The regression results have demonstrated that the SapphIRe (r² = 0.97) and FID (r² = 0.92) monitor groups correlate well with the charcoal tubes. The PID monitor group had a similar correlation when 90% RH was excluded (r² = 0.94) but had a weaker correlation when it was included (r² = 0.58) [20-25]. Also a study by Barsky et al. was performed on some compounds except xylene, in which the moisture was founded as an effective parameter on the response of PID system. The response of the photoionization detector was influenced by high relative humidity (90%) and the 10.2 eV lamp showed an unpredictable response factors in high humidity [15].
LeBouf et al. have studied the performance of two direct-reading organic vapor monitors when calibrated at different environmental conditions and then they were compared with charcoal tube results. The toxic vapor analyzers were a FID and a PID SapphIRe. They were challenged with four cyclohexane concentrations (30, 150, 300, and 475 ppm) under two extreme environmental conditions: 5°C and 30% relative humidity (same/cold) and 38°C and 90% RH (same/hot). For the second series of tests, the monitors were subjected to approximately normal indoor environmental conditions (21°C and 50% RH) and sampled at extreme environmental conditions (different/cold and different/hot).
The ranked choice of monitors was: PID > SAP > FID for same/cold; FID > PID > SAP for different/cold; SAP > PID > FID for same/hot; and PID > SAP (FID not included due to 100% failure rate) for different/hot [21]. In our study the relative humidity was maintained at 13% ±3% that led to the total correlation be equaled to 0.999 that it was in agreement with Poirot et al. research [14].
4. Conclusions
The PID system showed that increasing in the reading of concentration values was associated with decreasing in the coefficient of variation (CV). In other words, the values at higher concentrations of toluene vapors were more repeatability. Conversely, the results showed that at lower concentrations, the readings were less repeatability, because in these concentrations, the coefficient of variation (CV) was more than the others so that it was related to the response of the devices against toluene vapors. Therefore, at lower toluene concentration values (<50ppm), the PID system should be used with more considerations. These results are similar to those results extracted from the study conducted by Rismanchian et al. [9].
Regarding to the mentioned issues, in the studies of air pollutants removal with the catalysts, how should be considered. In often studies that are associated with catalysis performance, the removal efficiency is essentially calculated by the following equation (equation 6):
![]() (6)
(6)
Where![]() = concentration at the inlet of the reactor,
= concentration at the inlet of the reactor,![]() = concentration at the outlet of the reactor. As we know, in each specific concentration, multiplying one certain factor in all above parameters makes no change in the equation results.
= concentration at the outlet of the reactor. As we know, in each specific concentration, multiplying one certain factor in all above parameters makes no change in the equation results.
Thus, the results are acceptable in the studies in which the contaminant concentration is measured with the same PID equipment before and after the reactor and only thing which should be considered is the removal efficiency (RE).
Finally, it is recommended that the correction factor be utilized when VOCs measurement is done with the PID equipment or the calibration procedure with the test compound(s) be done.
Acknowledgments
The financial support of this research was conducted by Research Deputy of Tarbiat Modares University. The authors thank Mrs. Z. Farahmandkia and Mr. J. Taran for their helps in the gas chromatography analysis in Analytical chemistry & chemistry Laboratory, Faculty of Health, Zanjan University of Medical Sciences.
Abbreviations
| Full phrase | Abbreviation |
| American Conference of Industrial Hygienists | ACGIH |
| Benzene, toluene, ethyl benzene, xylene | BTEX |
| Central and Peripheral Nervous System | CNS & PNS |
| Coefficient of variation | CV |
| Correction factor | CF |
| Direct-reading organic vapor monitors | DROVMs |
| Electron volt | eV |
| Gas chromatograph - flame ionization detector | GC-FID |
| International Agency for Research on Cancer | IARC |
| Methyl ethyl ketone | MEK |
| National Institute of Occupational Safety and Health | NIOSH |
| part per million | ppm |
| Photoionization detector | PID |
| Relative humidity | RH |
| Removal efficiency | RE |
| Standard deviation | SD |
| Threshold limit value-time weighted average | TLV-TWA |
| Volatile organic compounds | VOCs |
References
- http://www.atsdr.cdc.gov/toxfaqs/tf.asp?id=160&tid=29, [Last accessed on 2014 Sep 04].
- http://www.epa.gov/ttnatw01/hlthef/toluene.html, [Last accessed on 2014 Sep 04].
- Barzegar Shangol A, Mortazavi, SB, Asilian H, Kazemian H. Elimination of toluene vapors using natural zeolite treated by copper oxide. J Kermanshah University Med Sci. 2013; 17: 423-30.
- Barzegar Shangol A, Mortazavi, SB, Asilian H, Kazemian H. Catalytic degradation of toluene on manganese oxide catalyst loaded on a natural zeolite support. Scientific Journal of Review. 2014; 3: 345-52.
- Mathur AK, Majumder CB, Chatterjee Sh. Combined removal of BTEX in air stream by using mixture of sugar cane bagasse, compost and GAC as biofilter media. J Hazard Mater. 2007; 148:64-74.
- IARC monograph. Toluene, monographs.iarc.fr/ENG/Monographs/vol71/mono71-36.pdf.
- ACGIH. Threshold limit values for chemical substances and physical agents and biological exposure indices (TLVs and BEIs). Cincinnati, OH, USA, 2014.
- Samarghandi M R, Babaee SA, Ahmadian M , Asgari G, Ghorbani Shahna F , Poormohammadi A. Performance Catalytic Ozonation over the Carbosieve in the Removal of Toluene from Waste Air Stream. Journal of Research in Health Sciences. 2014;14:227-32.
- Rismanchian M, Golbabaei F, Mortazavi Y, Pourtaghi GH, Rahimi Foroushani A. Evaluation of photoionization detector performance in photocatalytic studies for removing volatile organic compounds. Int J Env Health Eng. 2012; 13:1-7.
- Rismanchian M, Jafar Akbari, Keshavarzi R. Photocatalytic removal of gaseous toluene by titanium dioxide coated on nickel foam: Influence of relative humidity and toluene concentration. Int J Env Health Eng. 2014; 29:76-81.
- The PID handbook, Theory and Applications of Direct-Reading Photoionization Detectors (PIDs).3th ed. RAE Systems Inc, San Jose: CA; 2013.
- Coy JD, Bigelow PL, Buchan RM, Tessari JD, Parnell JO. Field evaluation of a portable photoionization detector for assessing exposure to solvent mixtures. Am Ind Hyg Assoc J. 2000; 61: 268-74.
- Drummond I. "On-the-fly" calibration of direct reading photoionization detectors. Am Ind Hyg Assoc J. 1997; 58: 802-22.
- Poirot P, Subra I, GÉRardin F, Baudin V, Grossmann S, HÉRy M. Determination of Short-term Exposure with a Direct Reading Photoionization Detector. Ann Occup Hyg 2004;48: 75-84.
- Barsky JB, Que Hee SS, Clark CS. An evaluation of the response of some portable, direct-reading 10.2 eV and 11.8 eV photoionization detectors and a flame ionization gas chromatograph for organic vapors in high humidity. Am Ind Hyg Assoc J. 1985; 46: 9-14.
- Lee IN, S.S. Que Hee SS, Clark CS. Additivity of detector responses of a portable direct-reading 10.2 eV photoionization detector and a flame ionization gas chromatograph for atmospheres of multi-component organics: Use of PID/FID ratios. Am Ind Hyg Assoc J. 1987; 48: 437-41.
- Mofidi AA, Asilian H, Jonidi Jafari A. Adsorption of volatile organic compounds on fluidized activated carbon bed. Health scope. 2013; 2:84-89.
- Dean JA. Lange's Handbook of Chemistry. In: Physical Properties,Vapor-Pressure Equations.15th ed. New York: McGraw-Hill; 1999. P. 5.30-56.
- NIOSH. Hydrocarbon aromatics, reference method 1501. Available from: http:// www.cdc.gov/niosh/nmam/ [Last accessed on 2014 June 18].
- Coffey CC, LeBouf RF, Lee L, Slaven JE, Martin S.Effect of Calibration and Environmental Condition on the Performance of Direct-Reading Organic Vapor Monitors.J Occup Environ Hyg. 2012; 9: 670-80.
- LeBouf RF, Slaven JE, Coffey CC.Effect of calibration environment on the performance of direct-reading organic vapor monitors. J Air Waste Manag Assoc. 2013; 63:528-33.
- Bjarke Mølgaard , Anna-Kaisa Viitanen, Anneli Kangas, Marika Huhtiniemi, et al. Exposure to Airborne Particles and Volatile Organic Compounds from Polyurethane Molding, Spray Painting, Lacquering, and Gluing in a Workshop. Int. J. Environ. Res. Public Health.2015;12:3756-3773.
- Kátia Duarte, Celine I.L. Justino,Ana Cristina Freitas, Armando C. Duarte, Teresa A.P. Rocha-Santos. Direct-reading methods for analysis of volatile organic compounds and nanoparticles in workplace air. TrAC Trends in Analytical Chemistry. 2014;53: 21–32.
- Catalina Espino Devine, Peter Bennett, Karen Synowiec,Sheldon Nelson, Rachel Mohler and Murray Einarson. Development and Testing of a Field Screening Method Based on Bubbling Extraction and Photoionization Detection for Measurement of Benzene and Total VOCs. Ground water Monitoring & Remediation. 2014; 34: 95–104.
- Sedighe Atrkar Roshan, Amir Abbas Mofidi. Comparison of Fixed and Fluidized Beds Adsorber with Economic, Engineering and Environmental approach. International Journal of Occupational Hygiene. 2014; 6:165-174.


