
Chemistry Journal, Vol. 1, No. 3, June 2015 Publish Date: Apr. 22, 2015 Pages: 95-102
Synthesis, Structural Studies and Microbial Evaluation of Cu(II), Mn(II) Ni(II), Zn(II), Fe(III), Ru(III), VO(II), UO2(II) Complexes of Tetradentate Oxime-Hydrazon Ligand
Mansour S. Abdul Galil1,*, Ahmed N. Al-Hakimi2, R. Y. Alshwafy1, Riyad Ahmed Al Okab1, Ali Mutir1
1Department of Chemistry, Faculty of applied science, Taiz University, Taiz, Yemen
2Department of Chemistry, Faculty of Science, Ibb University, Ibb, Yemen or Department of Chemistry Qassim University, Faculty of Science, Kingdom of Saudi Arabia
Abstract
The oxime -hydrazon ligand derived from pararmethoxy Phenylaminoacetohydrazide and acetyl mono oxime with Complexes of Cu(II) , Mn(II), Ni(II), Zn(II), Fe(III), Ru(III), VO(II) and UO2(II) have been synthesized and characterized on the basis of elemental analysis, Infrared, 1H NMR, molar conductance and magnetic susceptibilities analysis. The oxime -hydrazon ligand acting as a bibasic tetradentate ligand commonly coordinates through the oxygen atom of carbonyl group, the nitrogen atom of azomethine group, the nitrogen of (C=N-OH) group and the nitrogen of (CH2-NH) group, which was confirmed by IR spectral data. All the complexes have been evaluated for their antimicrobial activity against various organisms.
Keywords
Hydrazone Oxime Ligands, Metal Complexes, Antimicrobial Activity
Received: March 29, 2015
Accepted: April 12, 2015
Published online: April 20, 2015
@ 2015 The Authors. Published by American Institute of Science. This Open Access article is under the CC BY-NC license. http://creativecommons.org/licenses/by-nc/4.0/
Contents
1. Introduction 2. Materials and Methods 2.1. General Procedure for the Synthesis of Ligand 2.2. General Procedure for the Synthesis of H2L 2.3. General Procedure for the Synthesis of Complexes 2.4. Antifungal and Antibacterial Activity 3. Results and Discussion 3.1. IR Studies 3.2. Electronic and Magnetic Studies 3.3. H and 13C NMR Spectra 3.4. Conductance Measurements 3.5. Thermal Studies 3.6. Antibacterial and Antifungal Screening 4. Conclusion
1. Introduction
Hydrazones are Schiff bases described by the general formula RR'C=N-NR''R'''1. Hydrazones complexes are of considerable importance due to their wide applications in biological field like antibacterial, antifungal, antitumoral, anti-inflammatory and antitubercular agents. Hydrazones possessing an azomethine –NHN=CH- proton constitute an important class of compounds for new drug development2. Hydrazones exhibit keto-enol tautomerism and can coordinate in neutral, monoanionic, dianionic, or tetraanionic form bearing unusual coordination numbers in some mononuclear or binuclear species depending on the metal ion, its concentration, pH and the nature of the hydrazone3. The coordination compounds of aroylhydrazones have been reported to act as enzyme inhibitors and are useful due to their pharmacological application4. It has also been shown that the azomethine N, which has a lone pair of electrons in an sp2 hybridised orbital, is biologically importan5. The oximes and their metal complexes have attracted much attention as they have shown notable bioactivity as chelating therapeutics, as drugs, as inhibitors of enzymes and as intermediates in the biosynthesis of nitrogen oxides6. The coordination compounds involving hydroxyimino groups have encouraged the chemists to study such complexes being good donors and can form stable complexes with transition metal ions, which enable them to be important in bioinorganic systems. It is noteworthy that the oximes and their metal complexes have played a significant role in the development of inorganic chemistry7, 8. furthermore, oximes are extensively used as preferred derivatives for purification andcharacterization of carbonyl compounds and they play an important role as protecting and selectively α-activating groups in synthetic organic chemistry9. In addition, coordination compounds of oximes also receive considerable attention due to their structural features5 .In our previous studies we investigated the synthesis and characterization of various transition metal complexes10-14(second author). In the present paper, the synthesis and characterization of Cu(II), Mn(II) Ni(II), Zn(II), Fe(III), Ru(III), VO(II) and UO2(II) complexes of tetradentate oxime -hydrazon ligand derived from para methoxy Phenylaminoacetohydrazide and acetyl mono oxime have been reported.
2. Materials and Methods
The starting chemicals were of analytical grade and provided from Merck Company (Darmstadt, Germany). IR spectra of the solid ligand and complexes were recorded on Perkin-Elmer infrared spectrometer 681 or Perkin-Elmer 1430 using KBr disc. The 1H -NMR spectra were recorded with a JEOL EX-270 MHz FT-NMR spectrometer in d6-DMSO as solvent, where the chemical shifts were determined relative to the solvent peaks. The molar conductivity of the metal complexes in DMSO at 10-3 M concentration was measured using a dip cell and a Bibby conductimeter MC1 at room temperature. The resistance measured in ohms and the molar conductivities were calculated according to the equation: L=V×K×Mw/g×W, where: L = molar conductivity (ohm-1 cm2 mol-1), V = volume of the complex solution, K = cell constant 0.92 cm-1, Mw = molecular weight of the complex, g = weight of the complex, W = resistance measured in ohms. Electronic absorption spectra were recorded on a Shimodzu 240 or Perkin Elmer 550 spectrometer using 1cm quartz cells taking DMSO as solvent. Nujol mull electronic spectra were recorded using whatman filter paper No.1 and referenced against another similar filter paper saturated with paraffin oil. The thermal analyses (DTA and TGA) were carried out in the air on a Shimadzu DT-30 thermal analyzer from 27 to 800 0C at a heating rate of 10 0C per minute. Elemental analysis (CHN) was performed in the Analytical Unit within Cairo University (Egypt) by the usual methods of analysis.
2.1. General Procedure for the Synthesis of Ligand
The preparation of the para methoxy phenylaminoacetohydrazide was adopted according to a method published [14].
2.2. General Procedure for the Synthesis of H2L
A solution of para methoxy phenylaminoacetohydrazide (1.7g, .0.01 mol), in ethanol (25 mL) was added slowly to ethanol solution (15 ml) of acetyl mono oxime (1.01 g, 0.01 mol). The reaction mixture was refluxed with stirring for 3h, and then cooled to room temperature. The product was filtered off, washed several times with EtOH and dried over anhydrous CaCl2. The chemical structure of ligand was represented in (figure 1).
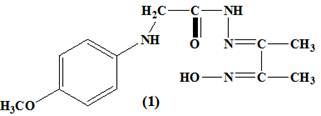
Figure 1. (E)-N'-(3-(hydroxyimino) butan-2-ylidene)-2-(p-methoxy - phenyl amino) acetohydrazide
Table 1. Analytical and some physical Characteristics for the ligand and its metal complexes.
| No. | Comp. No. | Color | M. Wt. | Calc. (Found) % | LaM | Yield | ||
| C | H | N | (%) | |||||
| 1 | H2L (C13H18N4O3) | Pale Yellow | 278.00 | 56.12 (57.00) | 06.48 (07.09) | 20.14 (21.00) | -- | 85 |
| 2 | [(HL) Cu (OAc) (H2O)]. 2H2O | Brown | 453.55 | 39.69 (40.09) | 05.73 (05.20) | 12.35 (13.00) | 5.0 | 65 |
| 3 | [(HL) Mn(OAc)(H2O)] | Pale brown | 408.94 | 44.02 (44.50) | 05.38 (05.95) | 13.69 (14.05) | 20.0 | 70 |
| 4 | [(HL) Ni (OAc) (H2O)]. 2H2O | Green | 448.69 | 40.12 (40.60) | 05.80 (05.28) | 12.48 (12.95) | 15 | 75 |
| 5 | [(HL) Zn (OAc)(H2O)]. H2O | White | 437.39 | 41.15 (41.70) | 05.49 (05.85) | 12.80 (12.10) | 8.0 | 70 |
| 6 | [(H2L)CuCl2 (H2O)] | Green | 430.55 | 36.23 (36.80) | 04.65 (04.18) | 13.00 (12.60) | 12 | 69 |
| 7 | [(HL)VO (H2O)] | Brown | 361.94 | 43.10 (42.85) | 05.25 (05.94) | 15.47 (16.00) | 6.0 | 75 |
| 8 | [(HL)FeCl2(H2O)].3H2O | Deep brown | 475.85 | 32.78 (33.10) | 05.25 (05.85) | 11.77 (11.09) | 9.0 | 78 |
| 9 | [(HL)RuCl2(H2O)].2H2O | Brown | 503.07 | 31.00 (31.50) | 04.57 (04.02) | 11.13 (11.55) | 10 | 73 |
| 10 | [(H2L)2UO2 (NO3)2] | Yellow | 950.03 | 32.84 (33.10) | 03.79 (03.20) | 11.79 (11.28) | 8.0 | 72 |
Molar conductivity as 10-3 M solutions (ohm-1 cm2 mol-1)
2.3. General Procedure for the Synthesis of Complexes
All the metal complexes (2-10), [(HL)Cu(OAc)(H2O)].H2O, [(HL)Mn(OAc)(H2O)], [(H2L)Ni(OAc)(H2O)].2H2O, [(HL)Zn(OAc)(H2O)].H2O, [(H2L)CuCl2(H2O)], [(HL)VO(H2O)], [(HL)FeCl2(H2O)], [(HL)RuCl2(H2O)], and [(H2L)2UO2(NO3)2] were prepared by mixing stoichiometric ratios (1M: 1L and 1M : 2L) of the ligand (30ml, EtOH) and metal salts (50 ml) in ethanol. The mixture was refluxed on a hot plate with stirring for 1–2 h, then a few drops of TEA (5 drops) were added. The mixture was heated for another 1 h. Cooled to room temperature. The obtained fine crystals were filtered off, washed several times with EtOH and dried over anhydrous CaCl2. The chemical structures of the formed complexes were shown in (figure 2).
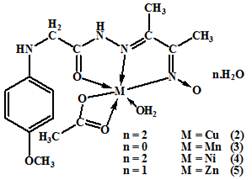
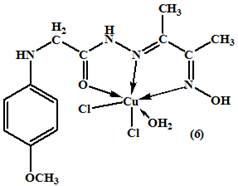
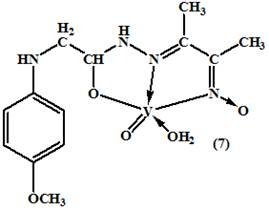
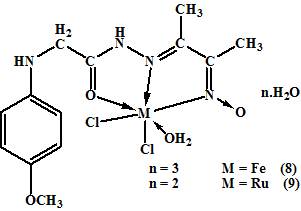
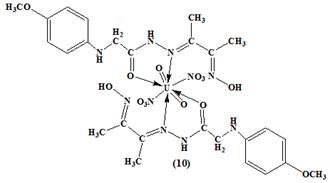
Figure 2. The proposed structures of the metal complexes
2.4. Antifungal and Antibacterial Activity
2.4.1. Fungus Media
Czapek dox agar medium was prepared by standard method14. Aspergillus Niger was spread over each dish by using sterile bent Loop rod. Disks were cut by sterilized Cork borer and then taken by sterilized needle. The resulted pits were sat for the tested compounds using 200μg ∕ml from compounds .The Plates were incubated at 300C for 24- 48 hrs. then any clear zones present were detected.
2.4.2. Bacteria Media
Nutrient agar medium was prepared by standard method14. E.coli was spread over each dish by using sterile bent Loop rod. Disks were cut by sterilized cork borer and then taken by sterilized needle .The resulted pits were sat for the tested compounds using 200μg ∕ml from compounds. The plates were incubated at 37 0C for 24- 48 hrs. then any clear zones present were detected.
3. Results and Discussion
The formation of the complexes occurred by the condensation of an ethanolic solution of the ligand, tetradentate imine-oxime ligand, ((E)-N'-(3-(hydroxyimino) butan-2-ylidene)-2-(p-methoxy - phenyl amino) acetohydrazide with an ethanolic solution of the metal salt.The oxime-hydrazone ligand and its complexes were characterized by elemental analysis (Table 1), IR (Table 2), UV–Vis (Table 3) spectroscopy, 1H NMR, 13CNMR. The analytical data (Table1) for the ligand, (figure 1), and its complexes, (figure 2) were consistent with their proposed molecular formula.
Table 2. IR spectral data (cm-1) of the ligand and its complexes
| n(COO) | nM-N | nM-O | nNHCO | nCH3NH | nN–OH | nC=N | n C=O | nOH ̸H2O | Ligand ̸ complexes | No. | ||
| ∆n | nsys | nas | ||||||||||
| - | - | 3230 | 3150 | 3450 | 1640 | 1670 | 3300 | H2L (C13H18N4O3) | 1 | |||
| 160 | 1416 | !576 | 450 | 495 | 3225 | 3150 | - | 1615 | 1660 | 3355 | [(HL)Cu(OAc) (H2O)]. 2H2O | 2 |
| 170 | 1415 | 1585 | 450 | 510 | 3230 | 3140 | - | 1620 | 1645 | 3370 | [(HL) Mn(OAc)(H2O)] | 3 |
| 155 | 1400 | 1555 | 460 | 500 | 3230 | 3135 | - | 1610 | 1655 | 3360 | [(HL)Ni(OAc)(H2O)]. 2H2O | 4 |
| 155 | 1400 | 1555 | 445 | 515 | 3230 | 3150 | - | 1625 | 1650 | 3365 | [(HL)Zn(OAc)(H2O)]. H2O | 5 |
| 455 | 520 | 3230 | 3140 | - | 1610 | 1645 | 3360 | [(H2L)CuCl2 (H2O)] | 6 | |||
| - | - | - | 465 | 520 | - | - | - | 1600 | - | 3365 | [(HL)VO (H2O)] | 7 |
| 445 | 510 | 3230 | 3150 | 1610 | 1655 | 3370 | [(HL)FeCl2(H2O)].3H2O | 8 | ||||
| 450 | 520 | 3230 | 3140 | 1620 | 1650 | 3360 | [(HL)RuCl2(H2O)].2H2O | 9 | ||||
| - | - | - | - | 530 | 3230 | 3150 | 3450 | 1610 | 1645 | - | [(H2L)2UO2 (NO3)2] | 10 |
The complexes were highly coloured and insoluble in water and common organic solvents but soluble in highly coordinating solvents such as dioxane, DMF and DMSO. They were non hygroscopic, highly stable under normal conditions and all of them decomposed above 250 C˚. The elemental analysis data of the ligand and its complexes (Table 1) were consistent with the calculated results from the empirical formula of each compound.
The data showed a 1M: 1L and 1M: 2L ratios of the (2-9) and (10) complexes respectively with formulae shown in table1.
3.1. IR Studies
On comparison of the IR spectra of the metal complexes with that of its ligand, it was found that the (E)-N'-(3-(hydroxyimino) butan-2-ylidene)-2-(p-methoxy - phenyl amino) acetohydrazide ligand, showed characteristic IR bands at 3300, 1640, 1200 cm-1 due to the OH, C=N, and N–O stretching vibrations of the oxime group (C=N-OH), and a sharp band at 1670 cm-1 attributed to n(C=O) of the carbonyl group (Table 2). A strong and broad band was observed at 3300 cm-1 for the free ligand due to n (N–OH) which was absent in the complexes (2-9) suggesting the deprotonation of the hydroxyl group of the oxime in the process of formation of the complexes15,16. The unchanged OH (oxime) and C=N(oxime) bands in complex spectrum (10) confirmed that the OH (oxime) and C=N(oxime) groups them self did not coordinate to metal atom by neither oxygen nor nitrogen atoms17. The spectrum of the ligand showed a strong band at 3280 cm-1 may be assigned to n(NH) adjacent to carbonyl group. It was worth mentioning that the hydroxyl vibration bands coming from the hydroxyimino group and coordinated or latticed water in the structure were observed as combined strong and broad bands between 3450 and 3380-3475 cm-1 7. Also, the spectrum displayed a relatively strong and medium band located at 3110 cm-1 corresponding to the amino group (CH2-NH) which remained without changing in all complexes due to the participation no in the complexes formation14. The band at 1670 cm-1 assigned to n (C=O) of ligand was shifted to a lower energy for the complexes (2-6 and 8-10), (table 2) indicating the participation of the carbonyl group of the ligand, in the complexation process18. The IR spectra data obtained for the complex (7) showed that, the ligand in its complex coordinated to metal ion through the enolic carbonyl oxygen (C−O), which was supported by disappearing the band characteristic to the carbonyl n(C=O) and n (NH) groups, which was further supported by the appearance of new bands in the 1540 cm-1 and 1370 cm-1 corresponding to the n(N=C−O) and n(C−O) respectively14. Also, the band at 1640 cm-1 due to n (C=N) of the oxime group in the ligand was shifted to lower energies for all complexes, suggesting the coordination of azomethine group (C=N) with the metal ions18. On the other hand, there were two new bands, which were not seen in the spectrum of the ligand, appearing also in the spectra of the complexes(2-9) the first one was the M-O stretching bands seen at 495-520 cm-1range , and the second weak band was M-N vibrations seen between 448 and 465 cm-1 , whereas in the case of the complex(10), there was only one band assigned to the n(M-O) vibration .These values were in a good agreement with the values reported in the literature19. The nasy(COO) and nsy(COO) stretches of free acetate ions in aqueous solution occur at 1560 and 1416 cm–1 respectively20. These frequencies and their difference, Δν = νas – νsym, have been used as empirical indicators of coordination modes of the acetate group. According to Deacon and Phillips, a difference larger than 200 cm–1 indicates a monodentate coordination, whereas a difference smaller than 150 cm–1 indicates a bridging coordination mode. Moreover, it was accepted that a values of Δν smaller than 200 cm–1 can indicate a bidentate coordination mode. In complexes (2-5), Δν is >150 cm–1, which was in a good agreement with the literature data for a chelating binding ligand for these complexes21. The IR spectrum of the nitrato complex of UO2 (II) showed bands at ν5 (1450), ν1 (1365) and ν2 (960) indicating the nitrate group coordinated to the metal ion. The difference between the two high bands (ν5-ν1) is 85 cm−1 indicating that, the nitrate ion bonded to the UO2 (II) ion was unidentate manner22. The appearance of a strong band at 910 cm-1 in the spectra of the uranyl complex was associated with ν (O=U=O) vibration23. The IR spectrum of the complex (7) exhibited a very strong and characteristic absorption band at 965 cm-1 assignable to n(V=O) vibration24. The frequencies observed in the region 370-395cm-1 were due to n(M-Cl) bonding, which were characteristic of chlorine atom in the complexes (6, 8 and 9)25.
3.2. Electronic and Magnetic Studies
The UV-Visible spectra of, (E)-N'-(3-(hydroxyimino) butan-2-ylidene)-2-(p-methoxy - phenyl amino) acetohydrazide ligand and its metal complexes were measured in DMF at room, which provided quick and reliable information about the ligand arrangement in metal complexes. The H2L (C13H18N4O3) ligand exhibited absorption bands at 230 nm, and 340 nm due to π → π* and n→π* transition26. The electronic spectra of the ligand and its, Cu(II), Mn(II), Ni(II), Zn(II), VO(II) , Fe(III) , Ru(II) , and UO2(II) complexes in DMSO exhibited absorption bands at 230-290 and 320-360 nm (Table 3) that can be assigned to n→π* and π→π* transitions intra-ligand charge transfer, respectively, which have high intensity since they obey the Lapport selection rule16. The UV-vis spectra of the Cu(II) complexes (2) and (6), showed single broad absorption band in the 660 nm and 670 nm which can be assigned to the 2B1g →2A1g (n1), 2B1g → 2B1g (n2) and 2B1g → 2Eg (n3) transitions, respectively , which have similar energy, indicating a distorted octahedral geometry. The magnetic moments were 1.73 and 184 B.M. corresponding to one unpaired electron in an octahedral geometry27. The electronic transitions of the Mn (II) complex (3) showed series of bands at 415, 460 and 570 nm, corresponding to 6A1g→4Eg, 6A1g →4T2g and 6A1g →4T1g transitions respectively, which were compatible to an octahedral structure for manganese (II) complex. The magnetic moment value for Mn (II) complex was 5.05 B.M., which was in the expected range of octahedral geometry around the central metal ion 11, 16.
Table 3. Electronic spectra of the ligand and its metal complexes
| No. | Ligand ̸ complexes | Bands in DMF |
| 1 | H2L (C13H18N4O3) | 340, 230 |
| 2 | [(HL) Cu (OAc) (H2O)]. 2H2O | 620, 490, 380, 320, 260 |
| 3 | [(HL) Mn(OAc) (H2O)] | 570, 460, 415, 295, 360, 260 |
| 4 | [(HL) Ni (OAc) (H2O)]. 2H2O | 950, 650, 500, 315, 260, 210 |
| 5 | [(HL) Zn (OAc) (H2O)]. H2O | 290, 220 |
| 7 | [(HL) VO (H2O)] | 795, 515, 305,260 |
| 8 | [(HL) FeCl2 (H2O)].3H2O | 560,455, 320,260 |
| 9 | [(HL) RuCl2( H2O)].2H2O | 380,320,240 |
| 10 | [(H2L)2 UO2 (NO3)2] | 380,290,260 |
The appearance of three bands in the spectra of the Ni (II) d8 complex at 950 nm, 650 nm and 500 nm were assigned to 3A2g→ 3T2g(F) (n1), 3A2g → 3T1g(F) (n2) and 3A2g→ 3T2g(P)(n3) transitions, respectively, suggesting an octahedral geometry for the Ni(II) complex28. The magnetic moment value for Ni (II) complex was 2.85 B.M., which was in the expected range of octahedral geometry around the central metal ion.
The Zn (II) complex (5) was diamagnetic as expected and did not showed any d-d transition, that means there were no transitions observed in the visible region29. The electronic spectra of the vanadyl complex (7) exhibited bands at 515 nm and 795 nm, which can be assigned to the 2B2→ 1A1 and 2B2→ 2E transition respectively30. Iron (III) complex (8) showed two bands at 455 and 560 nm assigned to 6A1g→4T2g (G) and 6A1g (G) → 4T1 (G) transitions, characteristic of octahedral iron (III). The magnetic moment observed in 5.72 B.M indicatd the presence of octahedral geometry around the central ferric ion22. The ruthenium complex (9) displayed the charge transfer bands of the type Lπy → t2g in the low energy region at 380 nm, which obscured the weaker bands due to d–d transition. It is, therefore, became difficult to assign conclusively the bands of ruthenium(III) complexes which appeared in the visible region31. The study of magnetic properties suggested that the complex (10) was diamagnetic in nature as expected for this complex (uranyl(II)( UO22+) complex) , which was in well agreement with the octahedral geometry23. The electronic spectrum of uranyl complex showed bands at 540 nm assigned to ligand to uranium charge-transfer transitions23.
3.3. H and 13C NMR Spectra
The 1H-NMR spectrum of the ligand recorded in DMSO-d6 further substantiates the mode of coordination suggested by the electronic and IR spectral studies , which were consistent with the proposed structure. The spectrum of the ligand showed the absence of the signal of the amino (-NH2) related to the starting material (hydrazide). The spectrum showed a singlet peak at 10.85 ppm assigned to the N-OH proton,which was absent in the complexes( 2-5 and 7-9 ), suggesting the deprotonation of the hydroxyl group of the oxime in the ligand , whereas this proton remained appearing in the complex(6 and 10), confirming no participation in the complex formation 14,32. The spectrum of the ligand showed also two peaks, the first one was observed as singlet at 11.65(s, 1H) and the second at 6.60(s, 1H) ppm, which may be assigned to (NH) adjacent to (C=O group) and (NH) adjacent to (-CH2- group) respectively. The other obtained values for 1H-NMR chemical shifts of hydrazone compound; as expected, the aromatic protons of compounds appear at δ 6.63 (d, 2H)-7.12 (d, 2H) ppm 14, 18,28,32. In the 1H-NMR spectrum, 2 peaks were present for the CH3 protons neighboring to oxime group (CH3-C=NOH) and imine group (CH3-C=N-NH), which appeared as a singlet at δ 1.7 and 1.22 (s, 3H) ppm 18, 28, 32. The singlet appeared at 3.85 ppm was attributed to the methoxy protons (3H) attached to the phenyl ring in the ligand . In the 13C-NMR spectrum of ligand, different signals, which were observed at δ 148.3 ppm, (-C=N-NH), δ 152.5 ppm, (-C=N-NOH), showed asymmetrically substituted for hydrazones and oximes18, 28, 32. However, the peaks at 112.9-130.4 ppm range assigned to the carbon of aromatic ring. Spectrum of (-C=O) appeared at δ 168 ppm, as expected18, 28, 32. The signals of CH3 were shown at δ 7.9, 12.4 ppm.
3.4. Conductance Measurements
The conductivities of all the complexes were measured in DMF at 25°C at a concentration 10-3 M, which were considered to be an indicator for proposing their formulas. The molar conductance values of the complexes were in the range of 4- 15 ohm-1 cm2 mol-1, which indicated that these complexes behaved as non electrolytes in DMF and were neutral in nature.
3.5. Thermal Studies
Thermal gravimetric analyses gave information concerning the thermal stability of the complexes and decide whether the water molecules were in the inner or outer coordination sphere of the central metal ion. All complexes lost hydration water between 50 and 120 °C, and then the coordinated water molecule was lost above ≥180°. The thermal degradation of Cu (II), Mn (II) Ni (II), Zn (II), Cu (II) and VO (II) complexes was studied using thermogravimetric techniques and a temperature range of 25–800 °C. The TGA data of some complexes agreed with the formula suggested from the elemental analyses. The data from the thermogravimetric analysis clearly indicated that the decomposition of the complexes proceeds in successive steps. The thermogram of the complexes (2, 4 and 5) showed decomposition in the temperature range 80- 20C˚ corresponding to the loss of 2, 2 and 1 of hydration water molecules respectively with a weight loss of 8.05, 8.15 and 4.29 %( cal. 7.94, 8.02 and 4.12 %) respectively, whereas the complex (3 and 6) showed no mass loss up to 130 C˚, indicating the absence of hydrated water molecules. It can also be seen that TG curve of complexes 2-6) displayed decomposition in the temperature range 180-220 C˚ indicating the loss of one molecule for each of coordination water with a weight loss of 3.70, 4. 69, 4.21, 4.42 and 4.01 % (Cal. 3.97, 4.40, 4.01, 4.12 and 4.18 %) respectively. The second step of decomposition for the complexes (2-5) in the temperature range 270–300 C˚ associated with the loss of one molecule of CH3COOH for each with a weight loss of 13.13, 14.87, 13.07 and 13. 42 % (calc. 13.23, 14.67, 13.37 and 13.72%) respectively, whereas the complexes (6) decomposed in the temperature range 310–350 C˚ associated with the loss of two molecules of HCl with a weight loss of 16.66 % (calc. 16.95 %) respectively. The final step of decomposition for the complexes (2-6) at the temperatures 570, 500, 570, 510 and 550, leaving the metal oxide, CuO, MnO, NiO, ZnO and CuO ,with a weight loss of 17.09 17.83, 16.11 and 18.15 % (cal. 17.54, 17.35, 16.65, 18.61 and 18.48 %) respectively12-14.
3.6. Antibacterial and Antifungal Screening
The ligand and its metal complexes have been screened for their antibacterial and antifungal activities at different concentration using well diffusion method against E. Coli and Aspergillus niger and the results obtained were presented in Table 4. It was observed that, the activities of the compounds increased with increasing the concentration of the solutions as well as the metal complexes were more potent than the parent ligand. This enhancement in the activity can be explained on the basis of chelation theory34, 35. Chelation reduced the polarity of the metal ion considerably, mainly because of the partial sharing of its positive charge with donor groups and possible π- electron delocalization on the whole chelate ring. Chelation may lead to the breakdown of the permeability barrier of the cell resulting in interference with the normal cell processes. If the geometry and charge distribution around the molecule were incompatible with geometry and charge distribution around the pores of the bacterial cell wall, penetration through the wall by the toxic agent cannot take place and this will prevent the toxic reaction within the pores. Chelation was not the only criterion for the antibacterial activity. Some important factors such as the nature of the metal ion, nature of the ligand, coordinating sites, and geometry of the complex, concentration, hydrophobicity, lipophilicity and presence of co-ligands have considerable influence on antibacterial activity. Certainly, steric and pharmacokinetic factors also played a decisive role in deciding the potency of an antimicrobial agent. The results showed that, complex (4) exhibits higher antibacterial than the other complexes. The order of antifungal activity for the compound was (9) > (7) > (4) > (6) = (ligand) > (2) = (3) = (8) > (5). While the order of antibacterial activity for the compound was (9) > (7) = (Ligand) > (11) > (4) = (2) > (6) > (5) > (3) > (8).
4. Conclusion
The hydrazone- oxime ligand, H2L (C13H18N4O3), derived from para methoxy-Phenylaminoacetohydrazide and acetyl mono oxime in EtOH, and some of its transition metal complexes were prepared. The analytical data and the spectroscopic studies suggested that the ratios of complexation were 1M: 1L and 1M:2L in the prepared complexes and it was found that all complexes were mononuclear. The molar conductance measurements of the complexes showed their non-electrolytic nature. The IR, electronic transition data lead to the conclusion that the Cu(II) , Mn(II) Ni(II), Zn(II), Fe(III) and Ru(III) ions assumes six ligands around the central ion, whereas was eight around the UO2 (II)ion and five around the VO(II). According to results obtained from TGA and elemental analyses, there were the lattice and coordinated water molecules in the complexes. Based on the obtained results, the structure of the coordination compounds under investigation can be formulated as shown in Figures mentioned in the text. The bioactivity of these complexes were assessed and listed in table 4.
Table 4. The inhibition zone (mm) of the ligand and its metal complexes on microorganisms at different concentrations
| Comp. No. | 250 μg/ mL | 200 μg/ mL | ||
| A. niger | E. coli | A. niger | E. coli | |
| DMSO | 0 | 0 | 0 | 0 |
| (Tetracycline) | 0 | 28 | 0 | 20 |
| Amphotricene B | 18 | 20 | 15 | 13 |
| 1 | 19 | 22 | 12 | 8 |
| 2 | 18 | 19 | 12 | 11 |
| 3 | 18 | 15 | 8 | 6 |
| 4 | 20 | 19 | 13 | 8 |
| 5 | 17 | 16 | 7 | 5 |
| 6 | 19 | 17 | 11 | 10 |
| 7 | 25 | 22 | 12 | 13 |
| 8 | 18 | 14 | 8 | 6 |
| 9 | 29 | 24 | 10 | 11 |
References
- Lijun L, Mohammad S A & Dong-Ung L, Bull. Korean Chem. Soc. 2012, 33,10, 3361.
- Prasanna M K & Pradeep K, Int J Pharm Biomed Sci. 2013, 4(1), 24-29.
- Ola A El-G, Faten E. El-M, Bakir J & Ahmed A El-A , Can. Chem.Trans.2013, 1, 4, 277-291.
- Ram K A, Lakshman S, Deepak K S & Ritu S, Turk J Chem. 2005, 29, 309 – 316.
- Ilknur B , Esin P C & Halil B, Maejo Int. J. Sci. Technol. 2013, 7(01), 26-41.
- Kurtoglu M, DOI:10.2298/JSC091118102K.
- Beyza C , Baris , Mehmet G U , Ahmet K Z & Mukerrem K,Turk J Chem. 2013, 37: 422 -438
- Ilknur B, Esin P Ç, Ali, Halil B & Burcu I,African Journal ofMicrobiology Research. 2011, 5(3) 271-283.
- RAMA S. L, Vishwanathr. P , Poonamp S & Sushama m L, Int. J. Chem. Sci.2010, 8(1), 88-96.
- Al-Hakimi A N, Abdou S El-T & Mohamad M E S, J. Chem .Res. 2009,770–774.
- EL-Saied F A, Shakdofa M ME & Al-Hakimi A N, J. Korean Chem.Soc.2011, 55, 3,1-12.
- El-Tabl A S, Shakdofa M M E , El-Seidy A M A & Al-Hakimi A N , J.Korean Chem. Soc.2011, 55,19-27.
- [13.] El-Tabl A S, El-Saied F A & Al-Hakimi, A.N., Trans. Met. Chem. 200, 32, 689.
- Ashwaq M A Q (Physico-chemical studies on some metal complexes with new azo dyes as a ligand), M.sc.thesis,Ibb university, 2015.
- Esmaiel, J.Chin. Chem. Soc. 2010, 57, 332-337.
- Esmaiel S, J.Chin. Chem. Soc. 2010, 57, 653-658.
- Tuna S , Canpolat E & Kaya M , Polish J. Chem., 2006, 80, 1651–1656.
- El-Asmy A A , Khalifa M E & Hassanian M M , Ind.J.Chem.,2004, 43A,92- 97.
- Dede B , Fatma K & Mustafa C,J. Chem. Sci.2009, 121, 2, 163–171.
- Kumar D, Gupta K P & Syamal A, J. Chem. Sci. 2005, 117, 3, 247–253.
- Kriza A, Lucica V A, Nicoleta C, Ileana R & Nicolae S,J. Serb. Chem.Soc.2010, 75 (2) 229–242.
- Mohamad M E S, Fathy A EL-S & Al-Hakimi A. N., Main Group Chem. 2012, 11, 189–204.
- Nora H. Al-Sha’alan,Molecules2007, 12, 1080-1091.
- Swamy S I, Dharma R A & Bhaskan K, Ind. J. Chem.2001, 40A, 1166-1171.
- Siddappa K & Patil C R, IJABPT, 2012, 3(3)168.
- Jadhav V B , Gonewar N R , Jadhav K D & Sarawadekar R G, IOSR-JPBS2013, 5, 5, 01-06.
- Rakhi C & Shelly , Int. J. Pharm. St. Res. 2011, 2,1,39-47.
- Jayaramudu M & Reddy H, Indian J.Che,1999, 38A,1173-1176.
- Eid A A, Al-Ramadane O M & Al-Numa K S, Amer.J. Appl. Sci. 2010, 7 (5),628-633.
- Raman N, Dhaveethu Raja J & Sakthivel A, J. Chem. Sci. 2007, 119, 4, 303–310.
- Priyarega S , Muthu Ttmizh M, Karvembu R, Prabhakaran R & Nnatarajan K, J. Chem. Sci. 2011, 123, 3, 319–325.
- Al-Ne'aimi M, Moudar Al-K M & Salim J M, Raf. J. Sci. 2012, 23, 4, 51-69.
- Raja Reddy G N, Kondaiah S, Nagaraja Setty K, Mallikarjuna Rao R & SreeRamulu J, Orient. J. Chem. 2012, 28(4), 1673-1683.
- Franklin T J & Snow G A, Biochemistry of Antimicrobial Action, 2nd edn.Chapman and Hall, London, 1971.
- Collins C H. & Lyn P.M., "Microbial Methods, University Park Press, altimore, 1970.


