Chemistry Journal, Vol. 1, No. 2, April 2015 Publish Date: Mar. 31, 2015 Pages: 15-19
Extraction-Spectrophotometric Study of Ternary Complexes of NbV and TaV
Ali Z. Zalov1, Kiril B. Gavazov2, *
1Department of Analytical Chemistry, Azerbaijan State Pedagogical University, Baku, Azerbaijan
2Department of General and Inorganic Chemistry, University of Plovdiv "Paissii Hilendarski", Plovdiv, Bulgaria
Abstract
29 liquid-liquid extraction-chromogenic systems containing MV (M=Nb or Ta), thiocatecholic compounds (TCs) and hydrophobic amines (HAs) were studied. The following TCs were used: 2,4-dihydroxythiophenol (DHTP), 2-hydroxythiophenol (HTP), 2-hydroxy-5-chlorothiophenol (HCTP), 2-hydroxy-5-bromothiophenol (HBTP), and 2-hydroxy-5-iodothiophenol (HBIP). The HAs were aniline (An), N-methylaniline (MAn), N,N-dimethylaniline (DAn), aminopyridine (APy), dipyridyl (DiPy), guanidine (Gu), diphenylguanidine (DPG), and triphenylguanidine (TPG). The best organic solvent was chloroform. Under the optimum conditions, the molar absorptivities (εmax) and the degrees of MV extraction (R%) in this solvent were in the ranges (1.6-3.9)×104 L mol-1cm-1 and (98.1-99.3)%, respectively. The molar ratio of the reacting species was 1:2:2 (MV:TC:HA). Relationships were studied between the acid-base properties of the sulfhydryl group of TCs (pKSH) and some characteristics of the ternary complexes (εmax and ΔpH50).
Keywords
Liquid-Liquid Extraction, Niobium, Tantalum, Complex Formation, Ion-Associate, Constants of Dissociation, Relationship, Spectrophotometric Investigation
Received: March 15, 2015
Accepted: March 26, 2015
Published online: March 30, 2015
@ 2015 The Authors. Published by American Institute of Science. This Open Access article is under the CC BY-NC license. http://creativecommons.org/licenses/by-nc/4.0/
Contents
1. Introduction 2. Experimental 2.1. Reagents and Instruments 2.2. Optimization Procedure 3. Results and Discussion 3.1. Effect of pH 3.2. Absorption Spectra 3.3. Reagents Concentrations, Molar Absorptivities and Effect of Time 3.4. Stoichiometry of the Ternary Complexes and General Formula 3.5. Dissociation Constants of TCs 3.6. Correlation Between Properties of the Reagents and Complexes 4. Summary and Conclusions
1. Introduction
The chemical similarity of the transition metals Nb and Ta caused by their belonging to the same group of the Periodic Table and the phenomenon of the lanthanide contraction, leading to equalization of the ionic radii, requires a joint study of their compounds.1 Many reagents and techniques have been applied for simultaneous1c, 2 or separate3 determination of these elements. However, the developed procedures are most often characterized by drawbacks, such as low selectivity, high running costs, need of expensive equipment, preliminary separation, well-trained personnel, etc.
In the present work we use conventional spectrophotometry to investigate the formation and liquid-liquid extraction (LLE) of series of NbV and TaV ternary complexes which seems to be prospective for the spectrophotometric determination of these elements. The following reagents were used: i) thiocatechols (TCs): 2,4-dihydroxythiophenol (DHTP), 2-hydroxythiophenol (HTP), 2-hydroxy-5-chlorothiophenol (HCTP), 2-hydroxy-5-bromothiophenol (HBTP), and 2-hydroxy-5-iodothiophenol (HBIP); and (ii) hydrophobic amines (HAs): aniline (An), N-methylaniline (MAn), N,N-dimethylaniline (DAn), aminopyridine (APy), dipyridyl (DiPy), guanidine (Gu), diphenylguanidine (DPG), and triphenylguanidine (TPG).
Some of the mentioned reagents have been recently applied for LLE-spectrophotometric determination of various elements in real samples.4 For the determination of NbV one of as used the couples HBTP-Gu, HBTP-DPG, and HBTP-TPG.3m To best of our knowledge, investigations on the TaV-TC-HA complexes have not been performed so far.
2. Experimental
2.1. Reagents and Instruments
Stock solutions of NbV and TaV were prepared according to known procedures.5 They were standardized gravimetrically with phenylarsonic acid and N-benzoil-N-phenylhydroxylamine, respectively.3a Working solutions (0.1 mg mL–1) were prepared by appropriate dilution of the stock solutions. Chloroform solutions (1.3´10–2 mol L–1) of the reagents TCs and HAs were used. HAs (97-99% purity) were purchased from Sigma-Aldrich. TCs were synthesized according to the procedure of Kuliev et al.6 Their purity was verified by melting point determination and paper chromatography. The acidity was adjusted by adding HCl or NaOH solutions (0.1 mol L–1). pH was measured using an I-120.2 potentiometer with a glass electrode. The absorbance was recorded with a KFK-2 photocolorimeter and a Camspec M508 spectrophotometer, equipped with 5 and 10 mm path-length cells.
2.2. Optimization Procedure
An aliquot containing MV solution (M=Nb or Ta) was placed in a calibrated tube. Chloroform solutions of TC and HA were added and the organic phase was diluted to 5 mL with organic solvent. The volume of the aqueous phase was increased to 25 mL. The tube was closed and shaken for a fixed time. After separation of the layers, a portion of the organic extract was transferred into a cell and the absorbance was read against simultaneously prepared blank sample.
3. Results and Discussion
The binary complexes, NbV-TC and TaV-TC, cannot be extracted in chloroform or other slightly polar organic solvents. Experiments with KU-2 and AV-17 ion-exchangers showed that these yellow species are charged negatively. Electroneutral ternary complexes can be formed in the presence of HAs. The following organic solvents were tested for the extraction of these complexes: chloroform, 1,2-dichloroethane, carbon tetrachloride, benzene, toluene, xylene, iso-butanol, and iso-pentanol. Chloroform was found to be the most effective. At the optimum conditions this solvent provides degrees of extraction R>98.1% (Tables 1 and 2).
Table 1. Characteristics of the NbV-TC-HA-water-chloroform extraction-chromogenic systems
| Reagents | рНopt | λmax (nm) | εmax´10–4 (L mol–1 cm–1) | R (%) | Linear range (μg mL–1) |
| DHTP+An | 4.5-6.3 | 420 | 3.5 | 98.3 | 2.2-100 |
| DHTP+MAn | 4.8-6.8 | 425 | 3.8 | 98.5 | 2.2-100 |
| DHTP + DAn | 5.0-6.8 | 430 | 3.9 | 98.6 | 2.2-100 |
| HTP+AmPy | 6.2-7.8 | 445 | 2.1 | 98.3 | 1.5-115 |
| HTP+DiPy | 5.0-6.1 | 458 | 2.5 | 98.6 | 1.8-90 |
| HTP+An | 4.2-6.5 | 435 | 3.3 | 98.5 | 2.0-90 |
| HCTP+An | 4.1-6.4 | 438 | 2.8 | 98.3 | 1.0-95 |
| HCTP+Gu | 4.2-6.6 | 418 | 3.6 | 98.2 | 3.2-80 |
| HCTP+DPG | 4.1-6.4 | 425 | 3.4 | 98.1 | 3.1-75 |
| HCTP+TPG | 4.0-6.2 | 430 | 3.2 | 99.3 | 3.2-70 |
| HBTP+An | 4.0-6.3 | 442 | 2.7 | 99.1 | 1.0-105 |
| HITP+AmPy | 5.8-6.5 | 452 | 1.8 | 98.3 | 2.6-110 |
| HITP+DiPy | 4.9-5.7 | 475 | 1.9 | 98.4 | 3.4-100 |
| HITP+An | 3.9-6.1 | 447 | 2.6 | 98.6 | 2.0-120 |
Table 2. Characteristics of the TaV-TC-HA-water-chloroform extraction-chromogenic systems
| Reagents | рНopt | λmax (nm) | εmax´10–4 (L mol–1 cm–1) | R (%) | Linear range (μg mL–1) |
| DHTP+An | 3.6-5.7 | 418 | 3.3 | 98.5 | 1.0-80 |
| DHTP+MAn | 4.2-6.7 | 423 | 3.6 | 98.3 | 1.0-80 |
| DHTP+DAn | 4.3-6.8 | 428 | 3.9 | 98.2 | 1.0-80 |
| HTP+AmPy | 5.0-6.0 | 453 | 2.0 | 98.1 | 2.4-100 |
| HTP+DiPy | 5.1-6.0 | 465 | 2.2 | 98.2 | 1.8-90 |
| HTP+An | 4.1-6.4 | 440 | 3.0 | 98.3 | 1.0-100 |
| HCTP+Gu | 4.1-6.5 | 436 | 3.0 | 98.4 | 4.2-90 |
| HCTP+DPG | 4.0-6.3 | 440 | 3.3 | 98.6 | 3.6-95 |
| HCTP+TPG | 4.1-6.0 | 447 | 3.3 | 98.5 | 3.8-100 |
| HBTP+Gu | 3.1-5.7 | 435 | 3.2 | 98.3 | 1.6-100 |
| HBTP+DPG | 2.5-5.7 | 442 | 3.1 | 98.3 | 2.0-80 |
| HBTP+TPG | 2.4-5.3 | 451 | 3.0 | 98.6 | 3.0-90 |
| HITP+AmPy | 4.6-5.4 | 460 | 1.6 | 98.6 | 3.0-100 |
| HITP+DiPy | 4.8-5.6 | 470 | 1.7 | 98.5 | 2.6-100 |
| HITP+An | 3.8-6.0 | 450 | 2.5 | 98.3 | 2.8-90 |
3.1. Effect of pH
Extractable ternary complexes are formed in acidic and neutral media. The optimum pH intervals (Tables 1 and 2) are wide enough to ensure stable and reproducible results without using buffer solutions. The course of all pH-curves supports the assumption that only one complex is formed in each of the extraction-chromogenic systems (Fig. 1). At pH values higher than pHopt, the extraction efficiency reduces most likely due to a decrease of the degree of HA protonation. At pH values lower than pHopt, the concentration of the anionic TC species is insufficient for quantitative complex formation.
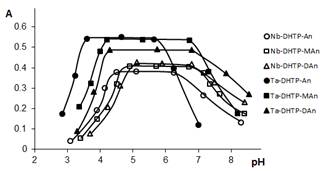
Figure 1. Absorbance of the ternary MV-TC-HA complexes vs. pH of the aqueous phase. CNb=2.15´10–5 mol L–1, CTa=3.3´10–5 mol L–1, CTC=1.3´10–3 mol L–1, CHA=1.0´10–3 mol L–1, ℓ=0.5 cm
3.2. Absorption Spectra
The absorption bands in the visible range of the ternary MV-TC-HA complexes are symmetrical and relatively narrow (Fig. 2). They are situated in the range of 418-475 nm (M=Nb) and 418-470 nm (M=Ta) (Tables 1 and 2, respectively). The color reactions are very contrast. The bathochromic shifts Dl calculated towards lmaxTC are in the range of 135-185 nm (DlNb) or 140-187 nm (DlTa).
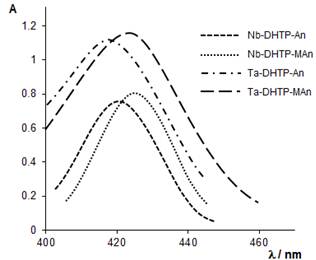
Figure 2. Absorption spectra of extracted ternary complexes of NbV and TaV. CNb=2.15´10–5 mol L–1, CTa=3.3´10–5 mol L–1, CTC=1.3´10–3 mol L–1, CHA=1.0´10–3 mol L–1, ℓ=1.0 cm
3.3. Reagents Concentrations, Molar Absorptivities and Effect of Time
Maximum and constant MV extraction can be achieved at TC and HA concentrations not lower than (0.95-1.28)´10–3 mol L–1 and (5.2-9.4)´10–4 mol L–1, respectively. MV concentration ranges in which the Beer’s law is obeyed are listed in Tables 1 and 2. The molar absorptivities (emax) belong to the interval (1.6-3.9)´104 L mol–1 cm–1 and (1.8-3.9)´104 L mol–1 cm–1 for the complexes of NbV and TaV, respectively. The couples DHTP-DAn and HITP-AmPy ensure the highest and the lowest emax values, respectively. The extraction equilibria establish within 5-10 minutes. The absorbance of the extracts is stable for at least 72 hours.
3.4. Stoichiometry of the Ternary Complexes and General Formula
The molar ratios TC:MV and HA:MV in the ternary complexes were determined by the mobile equilibrium method,7 straight line method of Asmus,8 and relative yield method.9 The results show a complex composition of 1:2:2 (MV:TC:HA). Using the Nazarenko’s method,10 we found that the coordinating ion is [M(OH)3]2–. Hence, the complexes can be regarded as ion-associates between doubly charged anionic chelates [MV(OH)3(TC2–)2]2– and two protonated HA species: (HHA+)2[MV(OH)3(TC2–)2].
3.5. Dissociation Constants of TCs
TCs contain -OH and -SH groups in their molecules. Depending on the acidity of the medium TCs can exist in molecular (H2R) or anionic (HR– and R2–) forms. The process of dissociation can be presented by the following scheme:
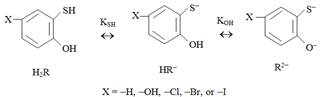
Scheme 1. Dissociation of TCs (H2R) in aqueous solutions
To determine the corresponding constants of dissociation, KSH and KOH, we used pH-titration with NaOH.11 The results are presented in Table 3.
Table 3. Calculated pK values for the studied ligands at μ=0.1 (NaClO4) and 25±0.5°C
| TC | pKSH | pKOH |
| DHTP | 6.33 | 11.2 |
| HTP | 5.8 | 10.9 |
| HCTP | 5.1 | 10.6 |
| HBTP | 5.05 | 10.4 |
| HITP | 5.0 | 10.2 |
3.6. Correlation Between Properties of the Reagents and Complexes
To establish relationships between the acid-base properties of the sulfhydryl group (pKSH) and some properties of the ternary complexes (DpH50 and emax) we constructed Fig. 3 and Fig. 4. The pH50 values were determined graphically from the dependence A=f(pH) (see Fig. 1) for absorbance of 50%. DpKSH values in Fig. 3 and Fig. 4 are the differences between pKSH of the unsubstituted reagent (HTP; X=H) and pKSH of its substituted analogues (X=OH, Cl, B, and I). DpH50 in Fig. 3 is the corresponding difference between the pH50 values for HTP and DHTP, HCTP, HBTP or HITP.
The relationship between DpKSH and DpH50 (Fig. 3) can be adequately described by a straight-line equation (R2=0.9998). The relationship between DpKSH and emax can be better described by a non-linear regression type equation (Fig. 4). The linear model applied to this set of data gave R-squared value of 0.9728. All calculations were made using MS Excell software.
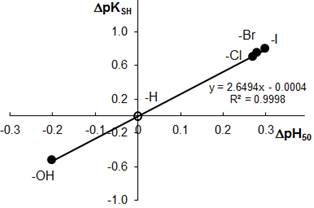
Figure 3. Correlation between the acidic properties of TCs (DpKSH) and DpH50 for the NbV-TC-An complexes
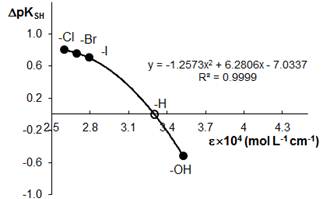
Figure 4. Correlation between the acidic properties of TCs (DpKSH) and molar absorptivity of the NbV-TC-An complexes
4. Summary and Conclusions
1. NbV and TaV form well chloroform-extractable ternary complexes with thiocatechols (TCs) and hydrophobic amines (HAs).
2. The molar ratio of the reacting MV, TC and HA species is 1:2:2. The general formula of the ternary complexes is (HHA+)2[MV(OH)3(TC2–)2. They can be regarded as ion-associates between doubly charged anionic chelates [MV(OH)3(TC)2]2– and protonated HA species.
3. The molar absorptivities (emax) belong to the interval (1.6-3.9)´104 L mol–1 cm–1 and (1.8-3.9)´104 L mol–1 cm–1 for the complexes of NbV and TaV, respectively. The highest molar absorptivity can be achieved with the couple DHTP-DAn.
4. Relationships exist between the acid-base properties of the sulfhydryl group of TCs (pKSH) and some characteristics of the ternary complexes. The relationship between DpKSH and DpH50 for the NbV complexes can be adequately described by a straight-line equation (y=2.6494x-0.0004). The relationship between DpKSH and emax for the same complexes can be described by a non-linear regression equation
(y=-1.2573x2+6.2806x-7.0337).
References
- (a) Pienaar, A.; Wagener, J.; Crouse, P. L. Int. J. Miner. Process. 2012, 114, 7. (b) Greenwood, N. N. Catal. Today 2003, 78 , 5. (c) Nagiev, K. D. J. Anal. Chem. 2004, 59, 930.
- (a) Li, G.; Wei, Q.; Hu, Q.; Huang, Z.; Yang, G. Microchim. Acta 2007, 158, 95. (b) Dongling, L.; Xiaoyan, H.; Haizhou, W. Talanta 2004, 63, 233. (c) Vachirapatama, N.; Doble, P.; Haddad, P. R. Anal. Chim. Acta 2000, 409, 35. (d) Vachirapatama, N.; Macka, M.; Paull, B.; Münker, C.; Haddad, P. R. J. Chromatogr. A 1999, 850, 257. (e) Yang, X.; Pin, C. Anal. Chimica Acta 2002, 458, 375. (f) He, R.; Chen, J.; Huang, Z.; Yin, J.; Yang, G. Asian J. Chem. 2007, 19, 3851.
- (a) Gibalo, I. M. Analiticheskaya khimiya elementov. Analiticheskaya khimiya niobiya i tantala (Analytical chemistry of elements. Analytical chemistry of niobium and tantalum). Nauka: Moscow, 1967 [In Russian]. (b) Chhakkar, A.; Kakkar, L. Fresenius' J. Anal. Chem. 1995, 351, 720. (c) Chhakkar, A.; Kakkar, L. Microchim. Acta 1995, 117, 137. (d) Amin, A. S. Microchem. J. 2000, 65, 261. (e) Patel, K.; Menon, S. K.; Agrawal, Y. K. Microchem. J. 1996, 53, 158. (f) Tamhina, B.; Gojmerac Ivšić, A.; Bartolinčić, A. Croat. Chem. Acta 2000, 73, 57. (g) Gojmerac Ivšić, A.; Galić, N.; Tomišić, V. J. Solution Chem. 2009, 38, 149. (h) Smolik, M.; Turkowska, M. Talanta 2013, 115, 184. (i) Sekomo, C. Rwanda Journal Series D. 2013, 25, 22. (j) Suvorova, D.S.; Khudonogova, E. V.; Revenko, A. G. Analitika i control 2014, 18, 23 [in Russian]. (k) Lekova, V.; Racheva, P.; Stojnova, K.; Dimitrov, A.; Gavazov, K. Chemija 2010, 21, 106. (l) Racheva, P.; Lekova, V.; Stefanova, T.; Dimitrov, A.; Gavazov, K. Nauch. Tr. Plovdiv Univ. Khim. 2010, 37, 33; (m) Zalov, A. Z.; Verdizade, N. A.; Dzhamalova, R. I. Azerb. J. Chem. 2011, (1), 97. (n) Marczenko, Z.; Balcerzak, M. Metod’y spektrofotometrii v UF i vidimoj oblastyakh v neorganicheskom analize (UV-Vis spectrophotometry in inorganic analysis) Binom. Laboratoriya znanij: Moscow, 2007 [in Russian].
- (a) Zalov, A.; Verdizade, N. A.; Abaskulieva, U. B. Izv. Vuz. Khim. Kh. Tekh. 2012, 55(10), 23. (b) Zalov, A. Z.; Verdizade, N. A. J. Anal. Chem. 2013, 68, 212; (c) Kuliev, K.; Verdizade, N.; Abaskulieva, U. Izv. Vuz. Khim. Kh. Tekh. 2012, 55(9), 22; (d) Zalov, A. Z.; Gavazov, K. B. Chem. J. 2014, 4, 20. (e) Zalov, A. Z.; Gavazov, K. B. J. Adv. Chem. 2014, 10, 3003.
- Korostelev,P.P., Prigotovlenie rastvorov dlya khimiko-analiticheskikh rabot (Preparation of solutions for chemical analytical labours). Khimiya: Moscow, 1964 [in Russian].
- Kuliev, A. M.; Aliev, S. R.; Mamedov, F. N.; Movsumzade, M. Zh. Org. Khim. 1976, 12, 426.
- Zhiming, Z.; Dongsten, M.; Cunxiao, Y., J. Rare Earths 1997, 15, 216.
- Asmus, E. Fresenius' J. Anal. Chem. 1960, 178, 104.
- Barbanel, Y. A., Zh. Neorg. Khim. 1964, 9, 437.
- Nazarenko, V. A. Trud’y komissii po analiticheskoj khimii AN SSSR (Proceedings of the Commission on Analytical Chemistry). Nauka: Moscow, 1969; Vol. 17 [in Russian].
- Al'bert, A.; Sergent, E. Konstant’y ionizatsii kislot i osnovanij (Ionization Constants of Acids and Bases). Khimia: Moscow-Leningrad, 1964 [in Russian].


