Chemistry Journal, Vol. 1, No. 2, April 2015 Publish Date: Apr. 2, 2015 Pages: 31-34
Changes of the Quercetin Absorption Spectra in Dependence on Solvent
Martina Bancirova*
Palacky University, Department of Medical Chemistry and Biochemistry, Hnevotinska 3, 77515 Olomouc, Czech Republic
Abstract
The autooxidation of quercetin under laboratory conditions was studied by changes of the absorption spectra during seven hours after dilution. The influence of the primal solvent was observed. In case of quercetin dissolved in ethanol, there can be observed the decrease in lmax at 380 nm, in case of quercetin dissolved in methanol; there can be observed the decrease in lmax at 385 nm, in case of quercetin dissolved in DMSO, there can be observed the decrease in lmax at 390 nm. There is also the appearance of new peak at 330 nm for quercetin dissolved in all solvents.
Keywords
Quercetin, Solvent, Spectrophotometry
Received: March 13, 2015 / Accepted: March 26, 2015 / Published online: April 2, 2015
@ 2015 The Authors. Published by American Institute of Science. This Open Access article is under the CC BY-NC license. http://creativecommons.org/licenses/by-nc/4.0/
1. Introduction
The natural flavonoid compounds quercetin (3,3′,4′,5,7-pentahydroxyflavone) is important bioactive compound with antioxidative, anti-allergic, and anti-inflammatory properties. It is believed to exhibit estrogenic and anticancer activity by acting as an effective radical-scavenger against oxidative cell damage. Various epidemiological studies have shown that quercetin and related isoflavonoids suppress cancerous tumor growth in vivo and in vitro. However, the mechanism by which this occurs is not clearly understood.[1]
The edible portion of some foodstuffs has an unusually high concentration of quercetin. Hertog et al.[2] examined hydrolyzed samples from numerous fruits and vegetables for total aglycone content and found the highest concentration of quercetin in onions (284-486 mg/kg), kale (110 mg/kg), French beans (32 mg/kg), broccoli (30 mg/kg), lettuce (14 mg/kg) and tomatoes (8 mg/kg). Among the fruit examined, the quercetin concentration averaged 15 mg/kg, with apples having the highest concentration (21-72 mg/kg). In a similar study, Hertog et al. [3] studied the quercetin content of tea infusions, fruit juices and wines. The quercetin concentration in beverages such as beer, coffee, chocolate milk and white wine were below 1 mg/liter. By contrast, the quercetin concentration in red wine ranged from 4 to 16 mg/liter, while grape juice contained 7-9 mg/liter. Fruit juices other than lemon (7 mg/liter) and tomato (13 mg/liter) contained below 5mg/liter quercetin. Tea infusions were the highest, ranging in quercetin concentration from 10 to 25 mg/liter. Since approximately 5% of the flavonoids consumed exist as quercetin.
The solubility and stability of quercetin seems to be one of the important problems during the study of its properties and influence on the living organism.
2. Materials and Methods
2.1. Chemicals
Quercetin,ethanol, methanol, dimethylsulfoxide (DMSO) were purchased fromSigma-Aldrich, Germany.
2.2. Samples Preparations
Quercetin was dissolved in ethanol, methanol, DMSO, respectively, and diluted 100 fold by PBS (final concentration was 10 mM).
2.3.UV–Vis Spectroscopy
The UV–Vis spectra of quercetin were recorded byTecan Infinite multimode reader. Scans were performed over a wavelength range of 290 to 490 nm at time 0 and 5 and following every 10 minutes up to 420 minutes under laboratory circumstances.
3. Results and Discussion
Quercetin is unstable when exposed to UV-irradiation, electrochemical oxidation, enzyme catalyzed oxidation but also to atmospheric oxygen. The oxidative degradation reduces the pharmacological efficiency of this antioxidant and makes analytical determination imprecise.
Flavonoids are benzo-γ-pyrone derivatives consisting of phenolic and pyran rings and are classified according to the substitutions in the basic skeleton. Their structures and functions differ in the presence or absence of hydroxyl, methoxy, glycosidic and other groups attached to the A and B rings of the basic skeleton. In nature, flavonoids exist primarily as 3-O-glycosides and polymers.[4]
The most important structural elements of flavonoids are: an o-dihydroxy group in the B ring (catechol structure) as a radical target; a double bond between positions 2 and 3 of the C-ring conjugated with keto group in position 4, because of its capacity to delocalize the uncoupled electron of a flavonoid radical; C-3,C-5 and C-7 hydroxyl groups (of the C and A rings, respectively) as scavengers of free radicals. [5,6]
The absorption spectra of flavonoids consist of two distinctive bands in a broad range of 240–400 nm. Band I, covering the range 300–380 nm, is attributed to the B-ring (with lmax around 350–370 nm), while band II, covering the range of 240–280 nm (with lmax around 260–270 nm) is attributed to the A–C benzoyl system; a weak band with an absorption maximum around 300 nm was also detected; it is attributed to the C-ring only.
The oxidative degradation of flavonoids has been reported in literature by several authors.[6]The oxidation pathway of hydroxy compounds is given by the distribution of various dissociation forms in solution.[7-10]Quercetin is decomposed to 2-(3′,4′-dihydroxybenzoyl)-2,4,6-trihydroxybenzofuran-3(2H)-one and subsequently to 2-(3,4-dihydroxyphenyl)-2-oxoacetic acid, 2,4,6-trihydroxybenzoic acid and 3,4-dihydroxybenzoic acid. [9]
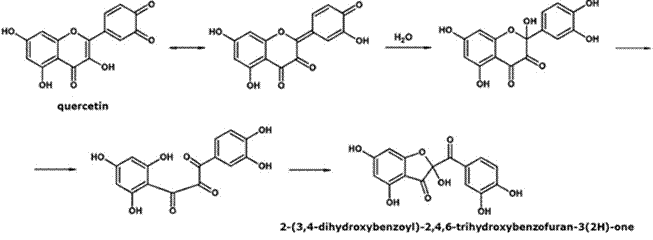
Figure 1. Formation of the decomposition products of quercetin (Sokolova 2011)
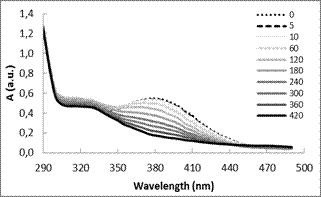
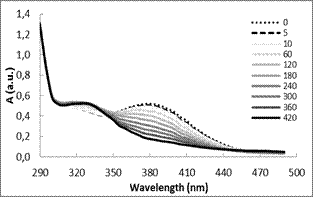
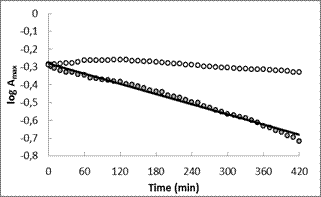
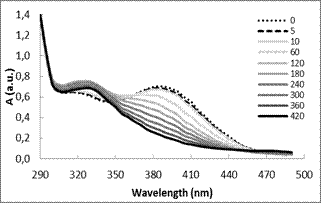
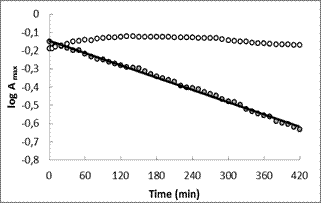
As shown in Figures 2-4 (part A), the displacement of quercetin peaks with maximum at 380 nm (quercetin dissolved in ethanol), at 385 nm (quercetin dissolved in methanol), at 390 nm (quercetin dissolved in DMSO) (band I) resulted in a new peak with maximum absorbance at ca. 330 nm for all samples. The measurements were done after 100 fold dilutions by PBS, after 5 minutes, and following every 10 minutes up to 420 minutes (the selected spectra are shown).
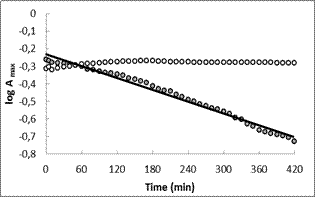
In part B, thereare shown the corresponding kinetic log plots obtained by the lmax values (grey dots) at 380 nm, 385 nm, 390 nm, respectively, as a function of the time period.The plots show linear fitting, with R2= 0.983, R2 = 0.988, R2 = 0.996, respectively. The increases of lmax values (white dots) at 330 nm are not linear (as it was shown during UV-irradiation, electrochemical or enzyme catalyzed oxidation).
A B
Figure 2. Quercetin dissolved in ethanol and 100 fold diluted by PBS to the final concentration 10 mM. A) The changes in the absorption spectra during the quercetin autooxidation after 0; 5; 10; 60; 120; 180; 240; 360 and 420 minutes. B) The corresponding kinetic log plot was obtained by following the lmax values (grey dots) at 380 nm as a function of the time period of autooxidation, log lmax(380 nm) = f (tautooxidation).The plots show linear fitting, with R2 = 0.983. White dots - lmax values at 330 nm.
A B
Figure 3. Quercetin dissolved in methanol and 100 fold diluted by PBS to the final concentration 10 mM. A) The changes in the absorption spectra during the quercetin autooxidation after 0; 5; 10; 60; 120; 180; 240; 360 and 420 minutes. B) The corresponding kinetic log plot was obtained by following the lmax values (grey dots) at 385 nm as a function of the time period of autooxidation, log lmax(385 nm) = f (tautooxidation).The plots show linear fitting, with R2 = 0.988. White dots - lmax values at 330 nm.
A B
Figure 4. Quercetin dissolved in DMSO and 100 fold diluted by PBS to the final concentration 10 mM. A) The changes in the absorption spectra during the quercetin autooxidation after 0; 5; 10; 60; 120; 180; 240; 360 and 420 minutes. B) The corresponding kinetic log plot was obtained by following the lmax values (grey dots) at 390 nm as a function of the time period of autooxidation, log lmax(390 nm) = f (tautooxidation).The plots show linear fitting, with R2 = 0.996. White dots - lmax values at 330 nm.
4. Conclusions
The easy oxidation of quercetin by air oxygen is known since the beginning of the last century. The subsequent changes in the flavonoid skeleton in the upshot modify the chemical and biological properties of these molecules. Although the mechanism is still not absolutely clear, it is influenced by the surrounding media and also by the primal solvent. In case of quercetin dissolved in ethanol, there can be observedthe decrease in lmax at 380 nm, in case of quercetin dissolved in methanol; there can be observed the decrease in lmax at 385 nm, in case of quercetin dissolved in DMSO, there can be observed the decrease in lmax at 390 nm. There is also the appearance of new peak at 330 nm for quercetin dissolved in all solvents but the increase is not linear. The autooxidation of quercetin manifests itself in the visible part of spectra during seven hours after dilution.
Acknowledgements
This research was supported by the grant from Grant Agency of the Czech Republic GAP301/11/0767.
References
- Tan, W.-f., et al. 2003. Quercetin, a dietary-derived flavonoid, possesses antiangiogenic potential. European Journal of Pharmacology 459: 255-262.
- Hertog, M. G., et al. 1992. Content of potentially anticarcinogenic flavonoids of 28 vegetables and 9 fruits commonly consumed in the Netherlands. Journal of Agricultural and Food Chemistry 40: 2379-2383.
- Hertog, M. G., et al. 1993. Content of potentially anticarcinogenic flavonoids of tea infusions, wines, and fruit juices. Journal of Agricultural and Food Chemistry 41: 1242-1246.
- Heim, K. E., et al. 2002. Flavonoid antioxidants: chemistry, metabolism and structure-activity relationships. Journal of Nutritional Biochemistry 13: 572-584.
- Makris, D. P. and J. T. Rossiter 2002. An investigation on structural aspects influencing product formation in enzymic and chemical oxidation of quercetin and related flavonols. Food Chemistry 77: 177-185.
- Sokolová, R., et al. 2011. The oxidation mechanism of the antioxidant quercetin in nonaqueous media. ElectrochimicaActa 56: 7421-7427.
- Zhou, A., et al. 2007. Electrochemical degradation of quercetin: Isolation and structural elucidation of the degradation products. Electrochemistry Communications 9: 2246-2255.
- Sokolová, R., et al. 2010. Oxidation pathways of natural dye hematoxylin in aqueous solution. Collection of Czechoslovak Chemical Communications 75: 1097-1114.
- Ramešová, Š., et al. 2012. On the stability of the bioactive flavonoids quercetin and luteolin under oxygen-free conditions. Analytical and Bioanalytical Chemistry 402: 975-982.
- Sokolová, R., et al. 2012. The oxidation of natural flavonoid quercetin. Chemical communications (Cambridge, England) 48: 3433.


