
International Journal of Mathematics and Computational Science, Vol. 1, No. 5, October 2015 Publish Date: Jun. 17, 2015 Pages: 234-241
Modeling of Pedestrian Walking Characteristics at Erbil CBD
Saad Issa Sarsam*, Marwa Wahab Abdulameer
Department of Civil Engineering, College of Engineering, University of Baghdad, Baghdad, Iraq
Abstract
To enable and encourage walking, understanding of the characteristics of pedestrian movements is vital. The restrictions on vehicular movement, and scarcity of parking lots had changed the whole traffic movement to the unserviceable condition. Therefore, Walking is considered as the most efficient mode of transportation at Erbil CBD area. In rapidly developing countries like Iraq, however, the recognition of the importance of walking studies is still in its infancy; minimal data exist on this important mode of travel. Knowledge of pedestrian characteristics could effectively assist in the optimization of policies concerning urban land use and the locational distribution of transport-related facilities in Erbil. In this paper, the pedestrians and their walking characteristics in two specific locations at Erbil CBD were studied. The continuous video capturing technique was implemented, the variations in walking speed of pedestrians among pedestrian characteristics such as gender, age group, and clothing traditions have been detected. The level of service was calculated for each sidewalk location. It has been found that the local pedestrians’ walks slower than other pedestrians do in the developed countries or in the region. The mean free flow walking speed of Erbil pedestrians that has been observed is 51.31 m/min and it is comparatively slower than that of others countries. On the other hand, elder Pedestrians (50 years or older) were the slowest among others, with an average walking speed of nearly 20 m/min. The walking speed, pedestrian density, and flow rate of pedestrian were modelled. Mathematical models were obtained, and compared with those of other countries. It was concluded that Male pedestrian wearing Kurdish style are faster by about 2 m/min when compared with pedestrian wearing western style (trousers). When female pedestrian are considered, the variation of walking speed among using different clothing style was not significant. Knowing the local pedestrian characteristics and its variation from the international standards is essential in the design of pedestrian facilities.
Keywords
Pedestrian, Walking Behavior, Clothing Tradition, Walking Speed, Modeling
Received:May 10, 2015
Accepted: May 17, 2015
Published online: June 18, 2015
@ 2015 The Authors. Published by American Institute of Science. This Open Access article is under the CC BY-NC license. http://creativecommons.org/licenses/by-nc/4.0/
Contents
1. Introduction 2. Site Description 3. Counts Method 3.1. Collection of Geometric Data 3.2. Sampling 3.3. Pedestrian Walking Speed, Volume, and Density Determination 4. Analysis and Discussion of Field Data 4.1. Variation of Walking Speed with Gender and Land Use 4.2. Effect of Age Groups on Walking Speed 4.3. Effect of Clothing Tradition on Walking Speed 4.4. Pedestrian Traffic Flow Characteristics 5. Conclusions
1. Introduction
Pedestrian facilities are an integral part of the overall transportation network. Pedestrianization has become an integral part of sustainable modern urban design. Thus, the design, arrangement and development of support infrastructures should be in favour of pedestrian movements to popularize walking. To achieve so, pedestrian facilities should be planned based on the concrete information on user characteristics, travelling patterns and objectives of pedestrians flow. One of the objectives of the pedestrian studies is to evaluate the effects of a proposed policy on the pedestrian facilities before its implementation. The implementation of a policy without pedestrian studies might lead to a very costly trial and error due to the implementation cost (i.e. user cost, construction, marking etc.). (Fruin, 1971), (Hoogendoorn et al. 2007) state that two people walking side by side or passing each other while travelling in opposite directions take up an average space of 1.4 m with adequate buffer areas on either side as demonstrated in Fig. 1. The minimum width that best serves two pedestrians walking together or passing each other is 1.8 m. For design purposes, the (HCM, 2000) sets out a simplified body ellipse of 50 cm x 60 cm for standing areas, with a total area of 0.3 m2 as shown in Fig. 2.
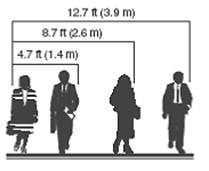
Fig. 1. Spatial Dimensions for Pedestrians, (Hoogendoorn et al., 2007).
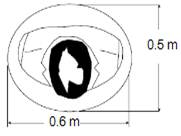
Fig. 2. Pedestrian Body Ellipse for Standing Areas, (HCM, 2000).
When determining pedestrian density, location and size of measurement area shall be carefully selected. (Hoogendoorn et al. 2007) demonstrated that high density of pedestrian might occur very locally such as waiting in front of stairs. The average measured density therefore depends directly on how the measurement area is defined (Hoel, 1968; Koushki, 1988).
(Sarsam, 2013) stated that the contributing factors of the walking speed for male and female pedestrian are clothing tradition, gender, and age group. He concluded that Male pedestrians move faster than female pedestrians do. Pedestrians in the age group of 15–30 years had the highest speed of the range 77.7 – 66.1 m/min, on the other hand; female pedestrian had the range of 74.5 – 69.9 m/min. for the same age group.
The literature also suggests that different locations have different effects on pedestrian movements. For example, (Al-Masaeid et al., 1993) developed pedestrian speed-flow relationships for CBD areas in developing countries, and compared them to the average values quoted in the 1985 edition of the HCM. One of the earliest researchers of pedestrian behaviour was (Polus et al., 1983) who used slow motion video surveys to collect pedestrian data. Since then, the method has been widely used and described including (Benz and Fruin, 1984; Turvey et al., 1987; Khisty and Jotin, 1982). The purpose of this study is to investigate how urban characteristics and land use affects pedestrian mobility; in terms of walking and crossing speed, and to model the effect of pedestrian characteristics such as clothing tradition, age group, and gender on walking and crossing speed.
2. Site Description
The case study was performed in the city of Erbil. To conduct the speed, density and volume studies in the concentrated CBD areas, several sidewalks along the main streets were selected as the observation sites. The pedestrian volume and speed data were collected at two selected locations in Erbil, the first site (Al-Qalat) is located in a tourist zone; while the second site (Ainkawa) is located in a recreational and shopping zone as shown in Fig. 3. It was expected that sites with different land use could show different pedestrian characteristics.
3. Counts Method
3.1. Collection of Geometric Data
The required data of each survey site in Erbil are recorded. The effective width of sidewalks was recorded, and measured for each survey site. Video recording was performed; the video provided more details that could be observed in a repetitive manner and with awareness. The video camera used was a Canon HG10 and the sampling period was for 1 hour. The studied segment of sidewalks has dimensions shown in Table 1; where the arcades widths are measured as the available space for pedestrian to walk.
Table 1. Dimension of Sidewalk test section for each Street.
| Street location | Length of section (m) | Width of section (m) |
| Al-Qalat | 8 | 1.5 |
| Ainkawa | 8 | 2 |
3.2. Sampling
The collection of the field data was made for sample lengths of 1 hour and during good weather conditions, i.e. a sunny or cloudy day without rain. The hours in which the counts were performed, were the ones where the peak hour was expected to take place. It must be stated that some counts were performed for more than an hour, e.g. 2 hours. These hours were selected considering the background information of the place. Specifically, the ranges selected were 13:00-14:00 and 17:00-18:00. The workdays were used as the main sample days for this study. In this respect, random days among this group were chosen of December 2013 and April 2014. The data that was gathered which include the walking time and approximate age; this was based on a subjective judgment. Young were considered to be below 18 years, adults between 18 and 50 years and the rest as elderly. The clothing Tradition was Kurdish male and female styles as shown in Fig.4.
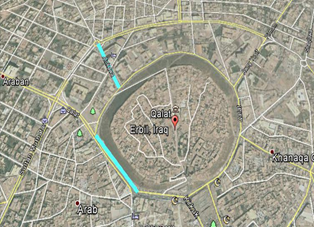
Fig. 3. Al-Qalat and Einkawa Street in Erbil City, Google Earth (2014).
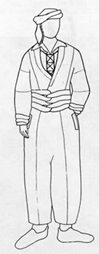
Fig. 4. Typical Kurdish Clothing Style.
3.3. Pedestrian Walking Speed, Volume, and Density Determination
The technique adopted in the field-work is by marking a longitudinal section of known length and width on the pedestrian facility and continuously recording the movement of pedestrians within this section. Video capture technique has been implemented, Pedestrians were manually timed over a measured test length, volume and speeds were then calculated. Random pedestrian about to enter the section was selected, and tracked through the study area. The time taken by a pedestrian to traverse the test length was measured using a digital stopwatch, the entry and exit times in and out of the test area were recorded. Walking speed was then derived by dividing the known length of the section by the walking time. The density was obtained by counting the number of walking pedestrians within the boundaries of the observation section site at unit time. The flow was obtained by counting the number of pedestrians passing the section entry and exit lines of the observation site within the time interval. Data were subjected to statistical analysis using IBM SPSS Statistics 19 software. The volume, speed, and density were calculated using the mathematical models below, (Pignataro, 1973). From this data, regression models have been constructed and the predictive performances of these models were assessed. The data obtained from the field survey were examined to determine the relationships between speed and flow, speed and density, and flow and density.
SN = L / TN (1)
SS = L / TS (2)
D = V / S (3)
Vu = V / We (4)
Du = Vu / S (5)
Where:
TN; TS represents travel time in each direction (min)
SN; SS represents the space mean speed (meter / minutes) in each direction
L = the test section length (meters)
D = the density of pedestrian (pedestrian / meters)
V = the volume of pedestrian (pedestrian / 15 minutes)
We = Effective width of side walk section in meters
S = pedestrian speed (meters / minutes)
Vu= unite width flow (pedestrian / 15 minutes / meter)
Du = the unit area density of pedestrian (pedestrian / meters 2)
4. Analysis and Discussion of Field Data
4.1. Variation of Walking Speed with Gender and Land Use
Table 2 shows pedestrian mean and 15th percentile speeds in relation to pedestrian gender for Erbil. The 15th percentile speed is the one normally used in design and it means that 85% of pedestrians walk faster than this speed. As indicated in the Table, male pedestrian walks faster than female for both of the tested sites. Such findings agrees with the study held in Singapore by (Tanaboriboon et al, 1989) which shows that the Singapore males generally walked faster than the females as their mean walking speeds are 79 m/min and 69 m/ min for males and females, respectively. The present study findings shows lower walking speed as compared to walking speeds reported by (koushki, 1988) for Saudi Arabia (mean walking speed 65 m/min) ,and for Indonesia (mean walking speed 52 m/min).
Table 2. Pedestrian Speed in Relation To Gender for Erbil City.
| Tested site | Pedestrian walking speed (m/min.) | ||
| Gender | Mean | 15th percentile | |
| Site 1 (Al-Qalat) | Male | 25.8 | 18.2 |
| Female | 20.6 | 16.5 | |
| Site 2 (Ainkawa) | Male | 20.1 | 14.1 |
| Female | 18.2 | 14.9 | |
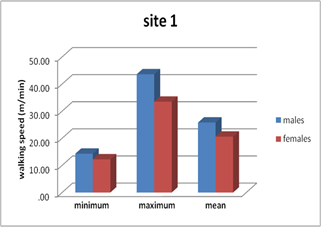
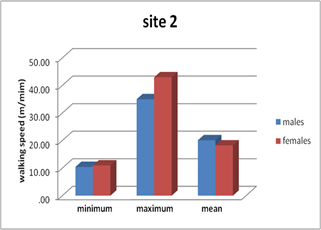
Fig. 5. Variation of Walking Speed with Gender.
On Erbil site one which is a tourist zone, it shows the slowest walking speed (mean walking speed is 20.1 m/min – 18.2 m/min. for male and female respectively), this could be related to the presence of older age pedestrians. The shopping and recreational site exhibits almost the slower walking speed of a range 20.6 – 30.7 m/min. for both genders. Fig. 5 shows the minimum, maximum, and mean walking speed for male and female for Erbil. This slow speed may be attributed to the fact that people were not in hurry and move slowly to enjoy the shopping site. This was in agreement with work by (Lam and Cheung, 2000) as cited by (Sarsam and Abdulameer, 2014) who observed that pedestrians walking in commercial areas are faster than those in recreational areas, and the walking speed of the pedestrian depends on the surrounding environment. The wide range of variation of mean speed between the tested sites which reflects the impact of land use was in agreement with (Finnis and Walton, 2007) in their statement that pedestrian walking speeds varied from 98 m/min to 33m/min and with (Sarsam, 2002,and 2013) in his studies for Mosul and Baghdad . (Rastogi et al, 2011) tabulated a global walking speed of a range 65 – 90 m/min in their study as cited by (Sarsam and Abdulameer, 2015).
4.2. Effect of Age Groups on Walking Speed
As indicated in Fig. 6, adult pedestrians (18-50 years) were the fastest compared to other age groups with an average speed of 30.9 m/min and 24.3 m/min for male and female respectively at Erbil site 1. Pedestrians 50 years or older (elderly) were the slowest among others, with an average walking speed of nearly 20 m/min. These findings are in agreement with those reported by (Fruin, 1971; Polus et al., 1983; koushki, 1988; Tarawneh, 2001; Sarsam, 2002, and 2013). Fig. 6 shows the variation of walking speed with gender and age groups for Erbil.
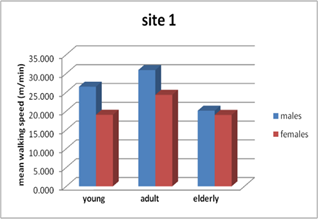
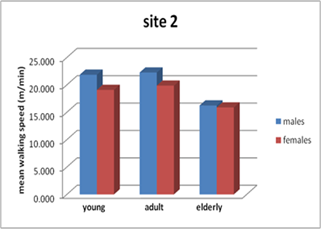
Fig. 6. Variation of Walking Speed with Gender and Age Groups.
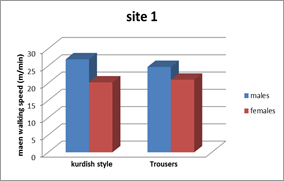
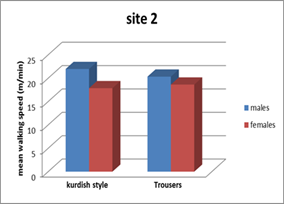
Fig. 7. Variation of Walking Speed with Gender and Clothing Tradition.
4.3. Effect of Clothing Tradition on Walking Speed
Fig. 7 illustrates bar charts for the variation of mean walking speed of pedestrian in relation to pedestrian clothing tradition for Erbil city and it shows two clothing traditions: Kurdish style, and western style (trousers) for both genders. It was found that males wearing Kurdish style are faster by about 2 m/min when compared with pedestrian wearing trousers. This was in agreement with (Sarsam, 2013) findings on the effect of local clothing tradition, where it was found that males, wearing trousers are faster than males with Arabic style by about 3.9 m/min. This may be attributed to the limitations practiced in the step length, which is restricted due to clothing when using the western clothing tradition. When female pedestrian are considered, the variation of walking speed among using different clothing style was not significant. This could be attributed to the slower average speed of female as compared to male. This was found to be in agreement with results found by (kuishki, 1988) in Saudi Arabia, and (Sarsam, 2013) in Baghdad.
4.4. Pedestrian Traffic Flow Characteristics
Table 3. Pedestrian Traffic Flow Characteristics.
| Site | Unit width flow rate (Ped./min/m) | Mean walking speed (m/min.) | Standard deviation | Density (Ped./m2 ) |
| Site 1 | 49 | 26.627 | 6.23 | 1.88 |
| Site 2 | 45 | 21.617 | 5.39 | 2,08 |
Table 4. Level of Service Parameters.
| Site | Effective walking area (m2) | Capacity (pedestrian) | V/C ratio | LOS |
| Site 1 | 12 | 37.6 | 0.86 | E |
| Site 2 | 12 | 41.6 | 0.72 | E |
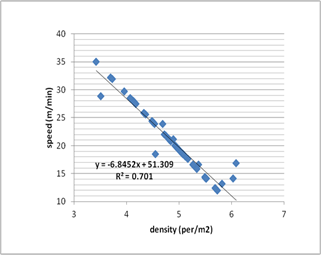
Fig. 8. Density – Walking Speed Relationship.
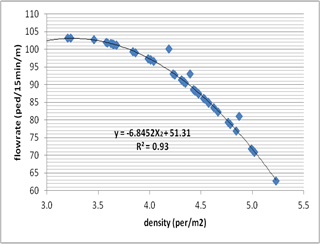
Fig. 9. Flow Rate – Density Relationship.
Table 3 shows the variation of pedestrian flow rate and walking speed among different sites in Erbil. The mean flow rate of 96 pedestrian / 15 minutes / m is considered high when compared to other studies in Europe and United States, (Tanaboriboon et al, 1989), while it is comparable to the findings by (Sarsam, 2002 and 2013). While Table 4 shows the level of service for each site. Fig.8 presents the (walking speed – Pedestrian density) relationship for Erbil. The mean free flow walking speed was found to be 51.31 m/min. The mean free flow walking speed of Erbil pedestrians that has been observed as comparatively slower than that of American counterpart of 88 m/min, (Hoel, 1968). Table 5 shows a Comparative Summary for the design mathematical models. Table 6 shows a Comparison of pedestrian walking speeds in different studies. On the other hand, Fig. 8, 9, and 10 demonstrates the green shield models obtained.
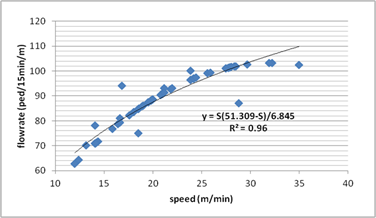
Fig. 10. Flow Rate – Walking Speed Relationship.
Table 5. A Comparative Summary for the Design Mathematical Models.
| City, Country | S=f(k) | Q=f(k) | Q=f(S) |
| USA | S=81.4-20.4k | Q=81.4k-20.4k² | Q=S (81.4-S)/20.4 |
| BRITAIN | S=78.6-20.2k | Q=78.6k-20.2k² | Q=S (78.6-S)/20.2 |
| SINGAPORE | S=73.9-15.3k | Q=73.9K-15.3K² | Q=S (73.9-S)/15.3 |
| MOSUL | S=2.5-0.04k | Q=2.5K-0.04K² | Q=S (2.5-S)/0.04 |
| BAGHDAD | S = 63.586-9.93K | Q=63.58k-9.93K2 | Q=S(63.58-S)/9.93 |
| ERBIL (present study) | S = 51.309-6.84K | Q=51.31k-6.84K2 | Q=S(51.31-S)/6.84 |
Table 6. Comparison of Pedestrian Walking Speeds in Different Studies (Sarsam and Abdulameer, 2015).
| City, Country | free flow Speed (m/min) | Author(s) |
| American and European Countries | ||
| Pittsburgh, United States | 88.0 | Hoel (1968) |
| London, England | 79.0 | Older (1968) |
| Columbia, United States | 79.0 | Navin and Wheeler (1969) |
| New York, United States | 81.0 | Fruin (1971) |
| Paris, France | 87.6 | Kamino (1980) |
| Asian Countries | ||
| Fukuoka, Japan | 81.0 | Kamino (1980) |
| Koori-cho, Fukushima, Japan | 69.6 | Kamino (1980) |
| Osaka, Japan | 90.0 | Kamino (1980) |
| Tokyo, Japan | 93.6 | Kamino (1980) |
| Roorkee, India | 84.0 | Laxman et al. (2010) |
| Madras, India | 72.0 | Victor (1989) |
| Singapore | 74.0 | Tanaboriboon et al. (1986) |
| Riyadh, Saudi Arabia | 65.0 | Koushki (1988) |
| Yogyakarta, Indonesia | 52.0 | Poei et al. (1995) |
| Kuwait city, Kuwait | 71.0 | Koushki and Ali (1993) |
| Shanghai, China | 72.0 | Yu (1993) |
| Mosul, Iraq | 29.6 | Sarsam (2002) |
| Baghdad, Iraq | 63.5 | Sarsam and Abdulameer (2013) |
| Baghdad, Iraq | 66 – 74 | Sarsam (2013) |
| Erbil, Iraq | 51.3 | Present study (2015) |
5. Conclusions
Within the limitations of field investigation procedure and assumptions, the following conclusions may be drawn:
1- Male pedestrians have significantly faster walking speeds than female pedestrians by about 5% with mean walking speed of 25.8 m/min for Erbil.
2- Pedestrians of 18–50 years old are the fastest group of pedestrians with an average speed of 30.9 m/min at Erbil. Pedestrians over 50 years old were found to be the slowest group with an average walking speed of nearly 20 m/min.
3- Males wearing Kurdish style are faster by about 2 m/min when compared with pedestrian wearing western style (trousers) in Erbil city.
4- The mean free flow walking speed of Erbil pedestrians that has been observed is comparatively slower than that of others countries. In addition, it was found to be 51.3 m/min for Erbil.
References
- Al-Masaeid, H. R., Al-Suleiman, T. I., and Nelson, D. C. (1993). "Pedestrian speed flow relationship for central business areas in developing countries." Transp. Res. Rec., 1396, 69–74.
- Benz, G and Fruin, J (1984) "Pedestrian Time-Space Concept for Analyzing Corners and Crosswalks", Transportation Research Record 959, Transportation Research Board, USA.
- Finnis, K. K., & Walton, D. (2006). "Field observations of factors influencing walking speeds". Ergonomics.
- Fruin, J. (1971) "Pedestrian planning and design" Metropolitan Association of Urban Designer and Environmental Planners, Inc., New York.
- HCM (2000) Highway capacity manual, federal highway ]administration, USA.
- Hoogendoorm, S. P., Daamen, W. and de Boer, A. and Vaatstra, I. (2007). "Assessing Passenger Comfort and Capacity Bottlenecks in Dutch Train Stations." Transportation Research Record, Journal of the Transportation Research Board, No. 2002, Transportation Research Board of the National Academies, Washington D.C., pp. 107-116.
- Hoel, L (1968) "Pedestrian travel rates in Central Business Districts", Traffic Engineering and Control, January 1968, UK.
- Koushki, P. A. (1988). "Walking characteristics in central Riyadh, Saudi Arabia" J. Transp. Eng., ASCE, 114(6), 735-744.
- Khisty, and C. Jotin (1982) "Pedestrian Cross Flows in Corridors", Transportation Research Record 847, Transportation Research Board, USA.
- NZ Transport Agency (2009). "Pedestrian Planning and Design Guide." New Zealand Government.
- Pignataro L. "Traffic Engineering theory and practice" Prentice-Hall; 1973.
- Polus, A., Schofer, J. L., & Ushpiz, A. (1983). "Pedestrian flow and level of service" Journal of Transportation Engineering, 109(1), 46-56.
- Sarsam, S. (2002) "Modeling pedestrian crossing and walking behavior at Mosul CBD", Proceedings, Safety on roads: 2nd international conference 21- 23 October-2002 Bahrain SORIC` 02.
- Sarsam, S. (2013) "Assessing Pedestrian flow characteristics at Baghdad CBD area", 2nd Scientific Engineering Conference, University of Mosul, 19-21 November, Mosul, Iraq.
- Sarsam, S., & Abdulameer, M. (2014). "Evaluation of Pedestrians Walking Speeds in Baghdad City", Journal of Engineering, Vol.20, No. 9, September, Iraq.
- Sarsam S. & Abdulameer M. (2015) "Modeling Pedestrian Walking and Crossing Characteristics at Baghdad CBD" Research Journal of Modeling and Simulation (RJMS) 2015, 2(2), P 1-9.
- Tarawneh, M.S., (2001), "Evaluation of pedestrian speed in Jordan with investigation of some contributing factors." Journal of Safety Research 32, pp 229-236.
- Turvey, I. G; May, A. D; and Hopkinson, P. G (1987) "Counting methods and sampling strategies for determining pedestrian numbers", Institute for Transport Studies, ITS Working Paper 242, University of Leeds, UK.
- Tanaboriboon, Yordphol and Guyano, Jocelyn A. (1989) "Level of Service Standards for Pedestrian Facilities in Bangkok A Case Study’', ITE Journal, Institution of Transportation Engineers (ITE), November 1989, USA.


