
International Journal of Mathematics and Computational Science, Vol. 1, No. 2, April 2015 Publish Date: Mar. 25, 2015 Pages: 37-49
Seismic Response Control of Buildings Using Base Isolation
Gabriel Danila*
Technical Sciences Department, Faculty of Architecture, "Ion Mincu" University of Architecture and Urbanism, Bucharest, Romania
Abstract
Among the methods of passive control of buildings, the base isolation method seems to be the most effective. Its efficiency has been proven in the major earthquakes of the late twentieth century and early twenty-first century. The paper presents a comparative study between two seismic isolation systems. The first system is composed of high damping rubber bearings and of nonlinear fluid viscous dampers (HDRB+NFVD) and the second system is composed of friction pendulum bearings with two sliding surfaces (FPB2S). The study showed that the mean response relative displacements and also the base shear forces of the building with two isolation systems have close values. The minimum values of absolute acceleration response are obtained with HDRB+NFVD isolation system. Regarding the dissipated energy, the HDRB+NFVD isolation system dissipates more energy, than the FPB2S isolation system.
Keywords
Friction Pendulum Bearing, High Damping Rubber Bearing, Nonlinear Fluid Viscous Damper, Nonlinear Time-History Analysis
Received: March 4, 2015
Accepted: March 20, 2015
Published online: March 24, 2015
@ 2015 The Authors. Published by American Institute of Science. This Open Access article is under the CC BY-NC license. http://creativecommons.org/licenses/by-nc/4.0/
Contents
1. Introduction 2. Description of the Building and of the Seismic Isolation Systems 3. The Seismic Action 4. Preliminary Design and Structural Analysis of the Isolated Structure 5. Nonlinear Time-History Analysis and Comparative Results 5.1. The Response in Relative Displacements 5.2. The Response in Absolute Accelerations 5.3. The Input and Dissipated Energies 5.4. The Base Shear Forces 6. Conclusions
1. Introduction
The first seismic isolation system was proposed in 1909 by the english doctor Johannes Avetican Calanteriants. He suggested the separation of the structure from the foundation through a layer of talc [1]. Later in 1969, the natural rubber bearings were used for seismic protection of Pestalozzi school in Skopje, Macedonia. In Romania, the first seismic isolated building was Victor Slăvescu’s building from Bucharest, whose rehabilitation was completed in 2010. Thus, no data are available concerning the behaviour of seismic isolated buildings to the earthquakes from Vrancea source.
This study makes a comparison between two different seismic isolation systems in terms of relative displacements, absolute accelerations, base shear forces and dissipated energies, considering the seismic action from the Vrancea source. The comparison was made on a reinforced concrete building having the height regime of ground floor and eight storeys.
The first system (HDRB+NFVD) is composed of twenty five high damping rubber bearings (Fig.1.1) - one bearing under each column and two bearings under each reinforced concrete wall - and twelve nonlinear fluid viscous dampers - six on the longitudinal direction and six on the transversal direction of the building.
The second system (FPB2S) is composed of twenty five friction pendulum bearings with two sliding surfaces (Fig. 1.2) -one bearing under each column and two bearings under each reinforced concrete wall.
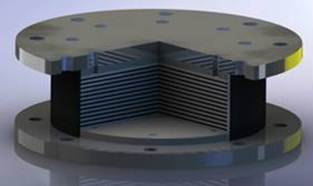
Fig. 1.1. High damping rubber bearing [2]
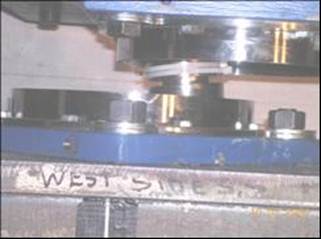
Fig. 1.2. Friction pendulum bearing with two sliding surfaces [3]
2. Description of the Building and of the Seismic Isolation Systems
The analysed structure is a dual structure, with reinforced concrete shear walls and frames, for which was considered the Bucharest location.
The height regime consists of ground floor and eight storeys, with storey height of 2.8m. The building has three spans - the central one of 3m and the marginal ones of 7m – and four bays of 8m.
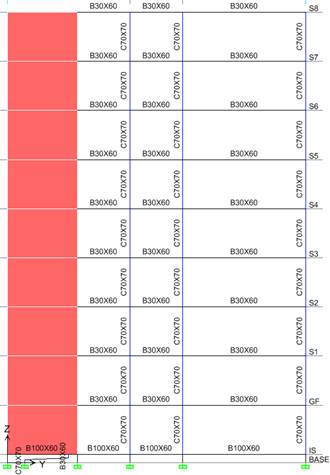
The resistance to the lateral forces is provided by the reinforced concrete shear walls, placed on both directions of the building and reinforced concrete frames. The wall thickness on the x direction is 35cm and on the y direction is 30cm, being constant on the entire height of the building. The columns are made of square section of 70cmx70cm, without reduction of section with height. The longitudinal beams are made of T cross-section with the web thickness of 35cm, the height of 70cm, the flange thickness of 16cm and flange width of 100cm. The transversal beams are also made of T cross-section with the web thickness of 30cm, the height of 60cm, the flange thickness of 16cm and the flange width of 100cm. The thickness of the reinforced concrete slabs was of 16cm.
a)
b)
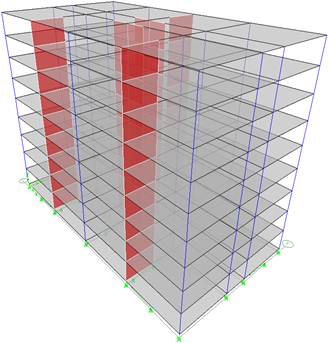
Fig. 2.1. The analysed building: a) General view, b) Elevation B
At the level of the isolation plane, a reinforced concrete slab of 16cm thickness was considered, having the main role of distributing the horizontal forces to the isolation system.
The reinforced concrete slab is supported on the longitudinal and on the transversal beams of the T cross-section with the web thickness of 100cm, the height of 60cm, the flange thickness of 16cm and the flange width of 170cm. This beams has greater cross-sections in order to avoid the plastic hinges occurrence and to ensure a good connection with the isolation devices.
In Fig. 2.2 is presented the isolation plane, of the HDRB+NFVD system, with one bearing under each column and two bearings under each reinforced concrete wall, and six nonlinear fluid viscous dampers on the x direction and six on the y direction.
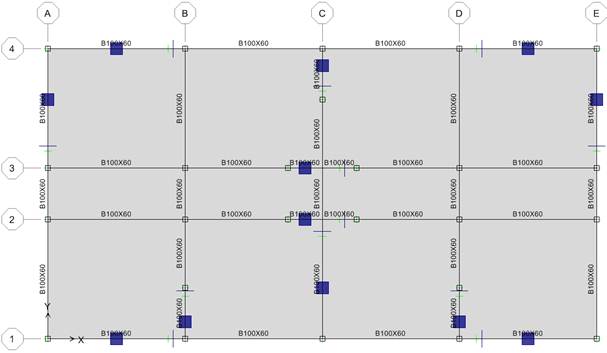
Fig. 2.2. The isolation plane of the HDRB+NFVD system
3. The Seismic Action
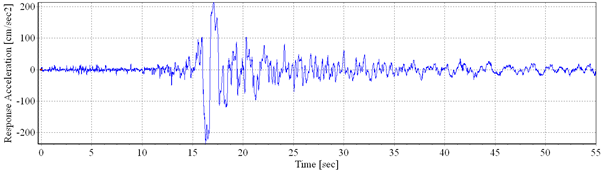
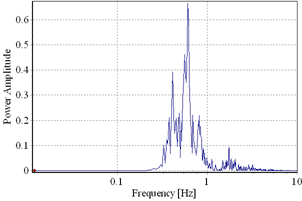
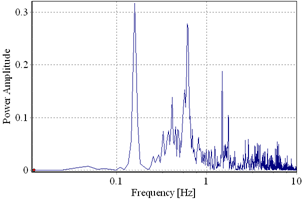
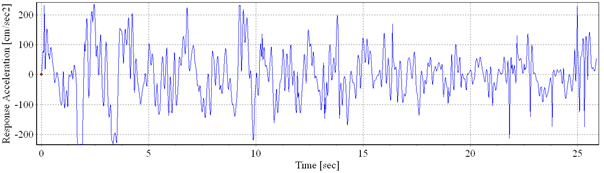
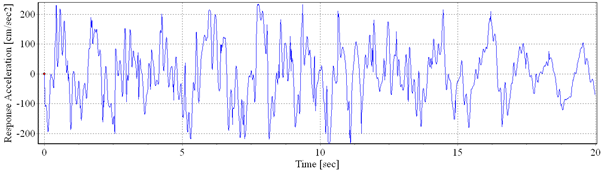
The seismic action is described by six artificial accelerograms compatible with the design spectrum for Bucharest and one accelerogram, recorded on INCERC-Bucharest site, corresponding to the N-S component of the March 4, 1977 earthquake.
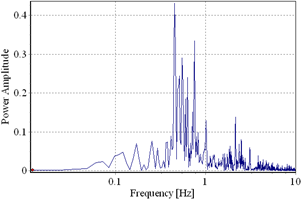
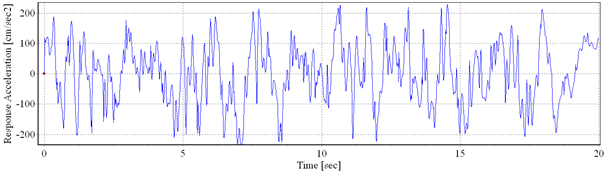
The recorded accelerogram (Fig. 3.1) was scaled, according to the P100-1/2006 [4] seismic code, to the maximum ground acceleration of 0.24g, corresponding to the design ground acceleration for Bucharest, having the mean recurrence interval of 100 years.
a) b)
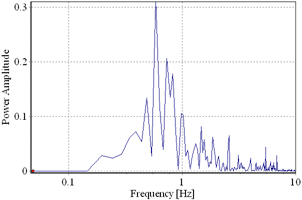
Fig. 3.1. a) Recorded accelerogram: NS component of recordedaccelerogram, March 4, 1977 Vrancea Earthquake; b) Power spectral density
a) b)
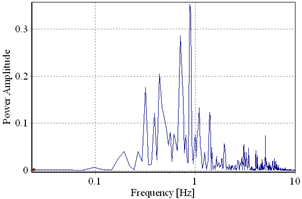
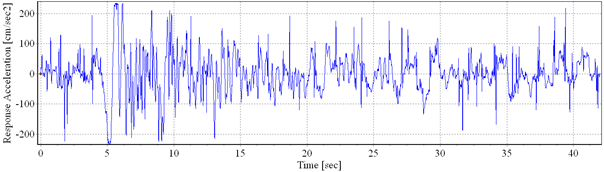
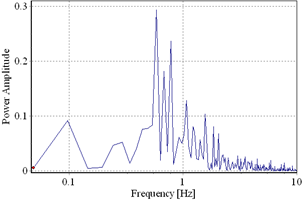
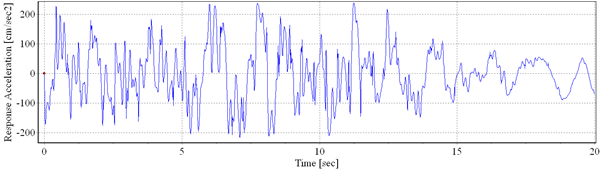
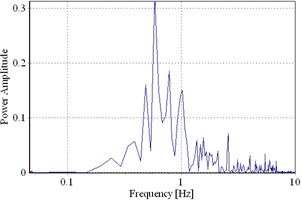
Fig. 3.2. a) Artificial accelerogram, generated starting from the NS component of recorded accelerogram, March 4, 1977 Vrancea Earthquake; b) Power spectral density
a) b)
Fig. 3.3. a) Artificial accelerogram, generated starting from the NS component of recorded accelerogram, August30, 1986Vrancea Earthquake; b) Power spectral density
a) b)
Fig. 3.4. a) Artificial accelerogram, generated starting from the NS component of recorded accelerogram, May30, 1990Vrancea Earthquake; b) Power spectral density
a) b)
Fig. 3.5. a) Artificial accelerogram 1; b) Power spectral density
a) b)
Fig. 3.6. a) Artificial accelerogram 2; b) Power spectral density
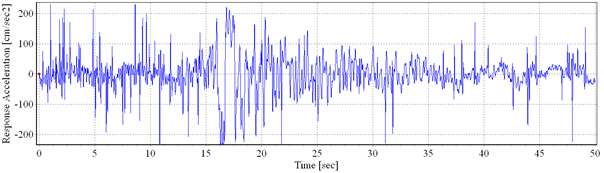
The artificial accelerograms were generated by means of SeismoArtif [5] computer program using two procedures.
Three accelerograms were generated starting from the recorded accelerograms, on the INCERC-Bucharest site, of the March 4, 1977 (Fig. 3.2); August 30, 1986 (Fig. 3.3) and May 30, 1990 (Fig. 3.4) earthquakes, N-S component. The frequency content of the three recorded accelerograms was adjusted, using the Fourier transformation method, to fit the target spectrum (design spectrum from P100-1/2006 seismic code, corresponding to Bucharest city). The maximum ground acceleration was considered 0.24g.
The other three accelerograms were generated using random processes by correction in the frequency domain. It were applied the envelope shapes Compoundfor the artificial accelerogram 1 (Fig. 3.5), Saragoni&Hart for the artificial accelerogram 2 (Fig. 3.6) and Exponential for the artificial accelerogram 3 (Fig. 3.7).
a) b)
Fig. 3.7. a) Artificialaccelerogram 3; b) Power spectral density
The following abbreviationswere used for the seismic actions:
• Vn’77_scaled: the seismic action corresponding to the scaled accelerogram of March 4, 1977 earthquake, recorded on the INCERC-Bucharest site;
• Vn’77_gen: the seismic action corresponding to the generated accelerogram starting from the recorded accelerogram, of March 4, 1977 earthquake, on the INCERC-Bucharest site; the N-S component;
• Vn’86_gen: the seismic action corresponding to the generated accelerogram starting from the recorded accelerogram, of August 30, 1986 earthquake, on the INCERC-Bucharest site; the N-S component;
• Vn’90_gen: the seismic action corresponding to the generated accelerogram starting from the recorded accelerogram, of May 30, 1990 earthquake, on the INCERC-Bucharest site; the N-S component;
• Artif. 1: the seismic action corresponding to the artificial accelerogram 1;
• Artif. 2: the seismic action corresponding to the artificial accelerogram 2;
• Artif. 3: the seismic action corresponding to the artificial accelerogram 3.
The seismic action was considered simultaneously in the three directions of the building (two horizontal directions and one vertical one), complying with the provisions of paragraph 4.5.3.6.2 (4) from the P100-1/2006 seismic code.
4. Preliminary Design and Structural Analysis of the Isolated Structure
The preliminary design of the isolation systems was performed, considering the analysed structure a system with one dynamic degree of freedom. The structure was isolated at a vibration period, Tis=3.5s,considering a damping ratio of the isolation systems, ξef=28%.
The displacement demand of the isolation systems, ddc, to the design earthquake was determined using Eq. (4.1) [4,6].
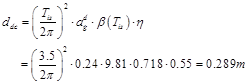 (4.1)
(4.1)
where: agd is the ground acceleration corresponding to the design earthquake; β(Tis) is the normalised spectral ordinate, corresponding to the vibration period, Tis and η is the damping correction factor.
The damping constant, Cnvd, of the nonlinear fluid viscous dampers was determined using Eq. (4.2) [7].
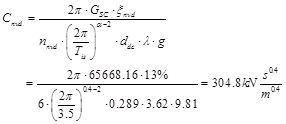 (4.2)
(4.2)
where: GSC is the total weight of the building in the special combination of loads; ξnvd is the damping ratio of the nonlinear fluid viscous dampers; nnvd is the number of the nonlinear fluid viscous dampers on x and y direction, respectively; λ is the coefficient of the nonlinear fluid viscous dampers and g is the ground acceleration.
The effective horizontal stiffness, kefhdrb, of one high damping rubber bearing was determined using Eq. (4.3) [7].
![]() (4.3)
(4.3)
where: nhdrb is the number of high damping rubber bearings.
The effective horizontal stiffness, kef2fpb, of one friction pendulum bearing with two sliding surfaces was determined using Eq. (4.4) [3].
![]()
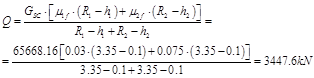
![]() (4.4)
(4.4)
where: R1 is the radius of curvature of the sliding surface 1, R2 is the radius of curvature of the sliding surface 2, h1 is the distance from the pivot point of the articulated slider to the sliding surface 1, h2 is the distance from the pivot point of the articulated slider to the sliding surface 2, k3 is the horizontal stiffness of the friction pendulum bearings after sliding onset on both surfaces, Q is the characteristic strength of the friction pendulum bearings, μ1f is the friction coefficient of the sliding surface 1, μ2f is the friction coefficient of the sliding surface 2 and n2fpb is the number of friction pendulum bearings with two sliding surfaces.
The linear static analysis was performed using the ETABS v9.2.0 [8] computer program, considering the stiffness of the elements reduced with fifty percent due to concrete cracking. The dynamic properties of the analysed structure with fixed base are given in Table 4.1and the dynamic properties of the analysed structure with isolated base are given in Table 4.2.
Table 4.1. The dynamic properties of the analysed structure with fixed base.
| The eigenmode of vibration | Dynamic properties | ||||||
| The vibration period [s] | Modal participating mass ratios [%] | ||||||
| UX | UY | UZ | RX | RY | RZ | ||
| 1 | 1.045 | 0.00 | 75.29 | 0 | 99.57 | 0 | 0 |
| 2 | 1.024 | 58.60 | 0 | 0 | 0 | 77.47 | 17.16 |
| 3 | 0.952 | 16.78 | 0 | 0 | 0 | 22.09 | 60.77 |
| 4 | 0.303 | 0 | 13.09 | 0 | 0.06 | 0 | 0 |
| 5 | 0.302 | 5.32 | 0 | 0 | 0 | 0.03 | 7.05 |
| 6 | 0.287 | 7.53 | 0 | 0 | 0 | 0.02 | 4.78 |
Table 4.2. The dynamic properties of the analysed structure isolated base.
| The eigenmode of vibration | Dynamic properties | ||||||
| The vibration period [s] | Modal participating mass ratios [%] | ||||||
| UX | UY | UZ | RX | RY | RZ | ||
| 1 | 3.596 | 0 | 99.83 | 0 | 74.63 | 0 | 0 |
| 2 | 3.593 | 98.91 | 0 | 0 | 0 | 73.72 | 0.95 |
| 3 | 3.425 | 0.942 | 0 | 0 | 0 | 0.73 | 98.91 |
| 4 | 0.615 | 0 | 0.16 | 0 | 24.97 | 0 | 0 |
| 5 | 0.602 | 0.133 | 0 | 0 | 0 | 21.76 | 0.03 |
| 6 | 0.549 | 0.013 | 0 | 0 | 0 | 3.44 | 0.11 |
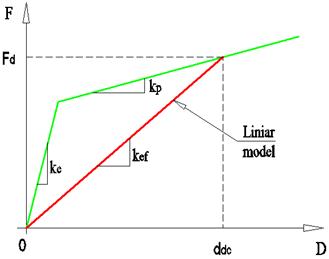
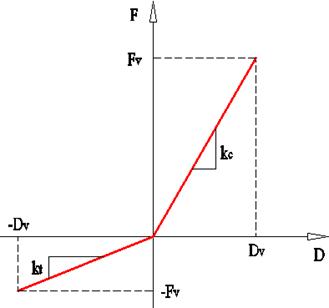
Modelling of the high damping rubber bearings (Fig. 4.1) was made using the link type element Isolator 1, which was put in parallel with a Gap element to take into account the different behaviour in tension and compression. For the nonlinear fluid viscous damper, a Damper element was used. The friction pendulum bearings with two sliding surfaces were modelled using Isolator 2 link type element.
a)
b)
Fig. 4.1. a) Modeling of high damping rubber bearings a) Horizontal directions; b) Vertical direction
The horizontal seismic forces, fi, applied to the each level of the analysed structure, were determined using Eq. 4.5 [4,6].
![]() (4.5)
(4.5)
where: mi is the mass of each storey; Sa(Tef,ξef) is the design spectral acceleration corresponding to the effective period of vibration, Tef, in the fundamental mode of vibration of the analysed structure, and to the effective damping, ξef; Se(Tef,ξef) is the elastic spectral acceleration corresponding to the effective period of vibration, Tef, in the fundamental mode of vibration of the analysed structure, and to the effective damping, ξef; q is the behaviour factor taken as 1.5.
The structural elements were designed like low-dissipative elements, adopting the ductility class L, according to SR EN 1998-1:2004 [6]. According to the recommendations of SR EN 1998-1:2004 and P100-1/2006, it is not necessary to meet the requirements of the capacity method and global or local ductility. The reinforcement steel used for the longitudinal bars was S355 and for the stirrups was S235. The concrete class used was C20/25.
5. Nonlinear Time-History Analysis and Comparative Results
The nonlinear dynamic analysis of the isolated structure was performed using the SAP2000 v15.1.0 [9] computer program, considering the structural elements and the isolation systems with nonlinear behaviour.
The nonlinear behaviour of beams and columns was modelled with plastic hinges at the elements ends (concentrated plasticity model) of M3 type and PM2M3, respectively.
The shear walls were modelled with shell layered-nonlinear elements, with nonlinear behaviour in both bending with axial force and shear force. For the concrete from the boundary elements of the shear wall was used a model with constant confinement - Mander 1988 model [10] - and for reinforcement was used the model automatically generated by the program with yielding plateau and post-elastic hardening.
The strenght of the materials was considered with mean values.
The devices which form the isolation system HDRB+NFVD were modelled in the following manner: the high damping rubber bearings were modelled using the link type element RubberIsolator, which was put in parallel with a Gap element to take into account the different behaviour in tension and compression and the nonlinear fluid viscous damper were modelled using Damper element. In Table 5.1 are given the parameters of the devices which compose the HDRB+NFVD isolation system, used in the nonlinear time-history analysis.
Table 5.1. Parameters of HDRB+NFVD isolation system used in nonlinear dynamic analysis.
| Direction | RubberIsolator | Gap | Damper | ||||
| ke | fy | kp/ke | ke | ke | C | α | |
| [kN/m] | [kN] | [-] | [kN/m] | [kN/m] | [kNs/m] | [-] | |
| U1 | 209600 | - | - | 2934400 | 243600 | 304.81 | 0.4 |
| U2 | 2728 | 85.9 | 0.233 | - | - | - | - |
| U3 | 2728 | 85.9 | 0.233 | - | - | - | - |
where: ke is the elastic stiffness; kp is the post-elastic stiffness; fy is the yielding strength; C is the damping coefficient and α is the velocity exponent.
The devices which form the isolation system FPB2S were modelled using two Rubber Isolator link type elements and a Gap element, which were put in parallel. Modelling the friction pendulum bearing with two sliding surfaces, using two Rubber Isolator elements, was considered to simulate, in the first stage, the initiation of sliding on the surface with the smaller friction coefficient and then continuation of sliding on both surfaces. In Table 5.2 the parameters of the devices which compose the FPS2S isolation system, used in the nonlinear dynamic analysis are given.
Table 5.2. Parameters of FPS2S isolation system used in nonlinear dynamic analysis.
| Direction | RubberIsolator 1 | RubberIsolator 2 | Gap | ||||
| ke | fy | kp/ke | ke | fy | kp/ke | ke | |
| [kN/m] | [kN] | [-] | [kN/m] | [kN] | [-] | [kN/m] | |
| U1 | 0 | - | - | 0 | - | - | 3250000 |
| U2 | 800000 | 78.8 | 0 | 808.22 | 118.2 | 0.5 | - |
| U3 | 800000 | 78.8 | 0 | 808.22 | 118.2 | 0.5 | - |
where: ke is the elastic stiffness; kp is the post-elastic stiffness; fy is the yielding strength.
The elastic damping was taken into account by using Rayleigh damping, considering the damping ratio of 3% for the vibration modes between 0.2T1 and 1.5T1 (T1 is the period of vibration in the fundamental mode).
5.1. The Response in Relative Displacements
The response in displacements of the isolated structure is highlighted for each seismic action described in the Chapter 3 and for each horizontal direction of the structure
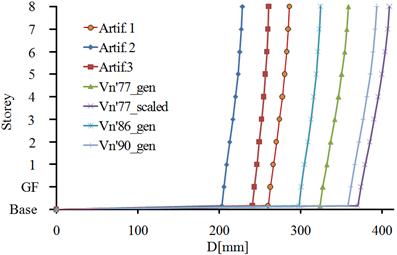
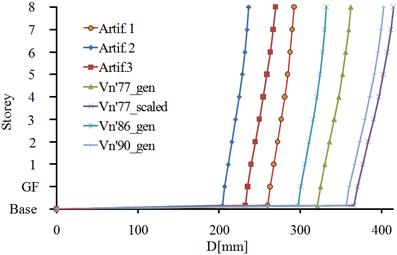
Figure 5.1 presents the displacement response of the HDRB+NFVD isolation system in both horizontal directions of the building. The isolation system has the maximum displacement to the Vn’77_scaled seismic action and the minimum displacement to the Artif.2 seismic action. The percentage difference between the two seismic actions, at the level of the isolation plane, is 45.1% for the x direction of the building and 44.3% for the y direction.
a)
b)
Fig. 5.1. The relative displacements of the structure, isolated with the HDRB+NFVD system: a)x direction;b)y direction
a)
b)
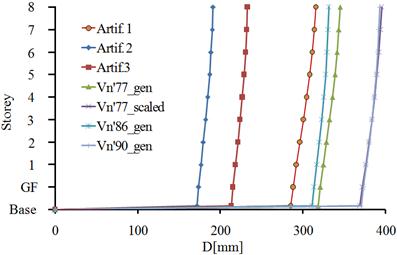
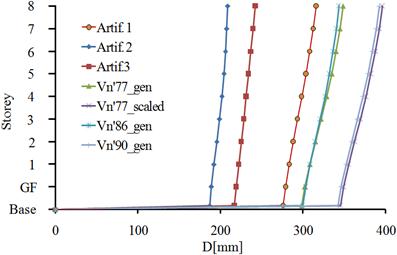
Fig. 5.2. The relative displacements of the structure, isolated with FPB2S system: a) x direction; b) y direction
In Fig. 5.2 the displacement response of FPB2S isolation system is presented in both horizontal directions of the building. The isolation system has the maximum displacement, on the x direction, to the Vn’90_gen seismic action and on the y direction, to the Vn’77_scaled seismic action. The minimum displacement is recorded to the Artif.2 seismic action, for both horizontal directions of the building. The percentage difference between the two seismic actions, at the level of the isolation plane, is 53.6% for the x direction of the building and 45.4% for the y direction.
a)
b)
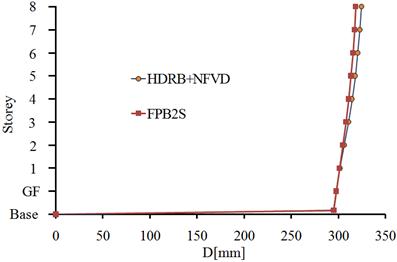
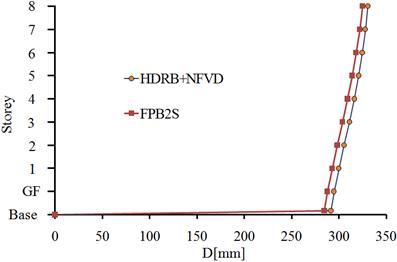
Fig. 5.3. The mean relative displacements of the structure, isolated with HDRB+NFVD and FPB2S system: a) x direction; b) y direction
The mean relative displacements of the two isolation systems are given in Fig. 5.3.
For the x direction of the building, the displacement of the HDRB+NFVD isolation system, at the level of the isolation plane is almost equal with the displacement of the FPB2S isolation system. At the 8th storey the building has smaller displacements when it is isolated with the FPB2S system. The percentage difference between the two isolation systems at the 8th floor is 1.9%.
For the y direction of the building, the minimum displacements are obtained with the FPB2S isolation system. The percentage difference between the two isolation systems, at the level of the isolation plane, is 2.3%.
5.2. The Response in Absolute Accelerations
In the same design cases it is necessary to limit the accelerations in the structure to protect a certain valuable content. Thus, were made comparisons in terms of accelerations both at the level of the isolation plane and at each floor level of the structure.
a)
b)
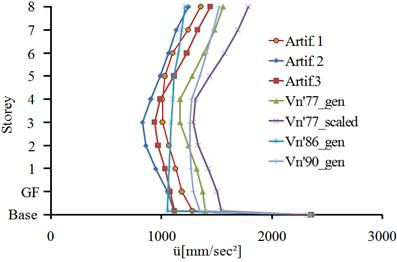
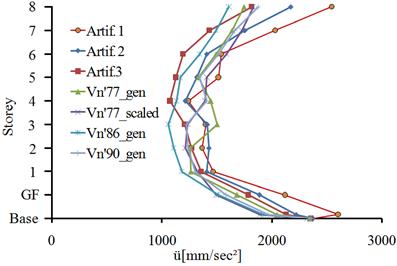
Fig. 5.4. The absolute accelerations of the structure isolated with HDRB+NFVD system: a) x direction; b) y direction
Figure 5.4 presents the absolute accelerations of the HDRB+NFVD isolation system in both horizontal directions of the building. On the x direction, the minimum accelerations, at the level of the isolation plane, are recorded to the Vn’86_gen seismic action and the maximum accelerations to the Vn’77_scaled seismic action. The percentage difference is 31.9%. On the y direction, the minimum accelerations, at the level of the isolation plane, are recorded to the Vn’86_gen seismic action and the maximum accelerations to the Artif. 2 seismic action. The percentage differenceis 40%.
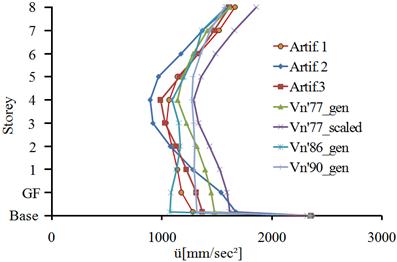
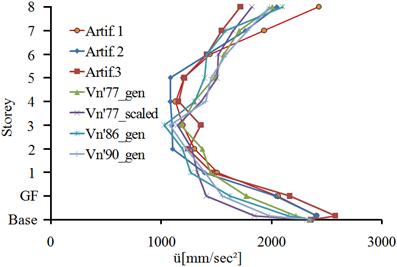
In Fig. 5.5 the absolute accelerations of FPB2S isolation system are presented in both horizontal directions of the building. On the x direction, the minimum accelerations, at the level of the isolation plane, are recorded to the Vn’77_scaled seismic action and the maximum accelerations to the Artif.1 seismic action. The percentage difference is 27.2%. On the y direction, the minimum accelerations, at the level of the isolation plane, are recorded to the Vn’77_scaled seismic action and the maximum accelerations to the Artif. 3 seismic action. The percentage difference is 28.4%.
a)
b)
Fig. 5.5. The absolute accelerations of the structure, isolated with FPB2S system: a) x direction; b) y direction
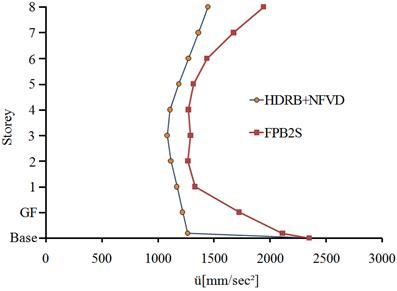
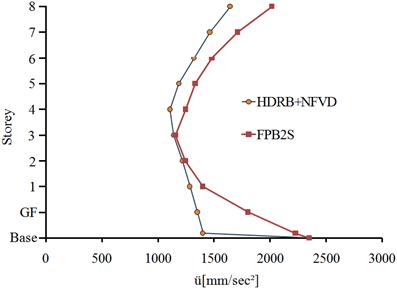
The mean absolute accelerations of the two isolation systems are given in Fig. 5.6. In both horizontal directions of the structure, minimum accelerations are obtained with the HDRB+NFVD isolation system. The percentage difference between the mean absolute accelerations at the level of isolation plane for two isolation systems is 29.2% for the x direction of the building and 37.1% for the y direction.
a)
b)
Fig. 5.6. The mean absolute accelerations of the structure, isolated with HDRB+NFVD and FPB2S system: a) x direction; b) y direction
5.3. The Input and Dissipated Energies
In the conventional design, the energy induced by an earthquake is dissipated through the post-elastic deformations of the structural elements. Through base isolation, the dynamic properties of the structure are changed, so that the energy induced by an earthquake is greatly diminished and is dissipated, most of it, by the isolation system. To analyse the energy dissipated by the two isolation systems, the hysteretic curves were integrated through the entire duration of the seismic actions described in the Chapter 3.
In Fig. 5.7 the hysteretic curves for a high damping rubber bearing are presented, i.e. a nonlinear fluid viscous damper and a friction pendulum bearing with two sliding surfaces. The hysteretic curves correspond to the seismic action Vn’77_gen in the y direction of the building. Figure 5.7b shows the hysteresis curves of the two link elements used for modelling the friction pendulum bearing with two sliding surfaces in horizontal directions.
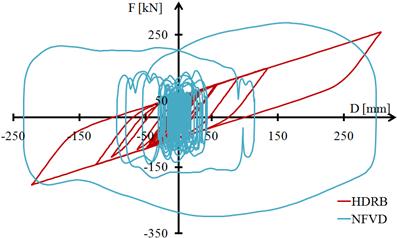
a)
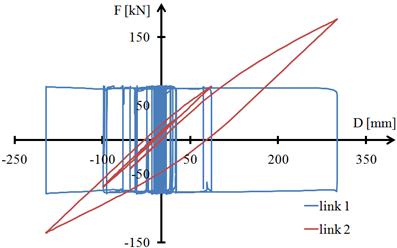
b)
Fig. 5.7. Hysteresis curves: a) High damping rubber bearing and nonlinear fluid viscous damper; b) Friction pendulum bearing with two sliding surfaces
a)
b)
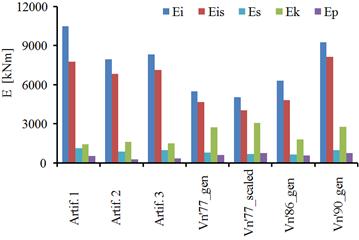
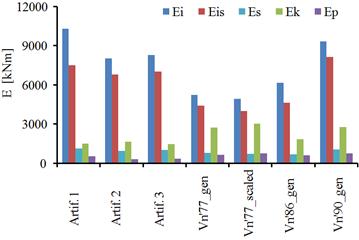
Fig. 5.8. The input energies and dissipated energies for the building isolated with HDRB+NFVD system:a) x direction; b) y direction
a)
b)
Fig. 5.9. The input energies and dissipated energies for the building isolated with FPB2S system:a) x direction; b) y direction
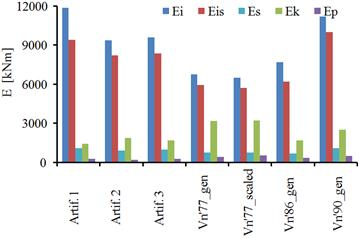
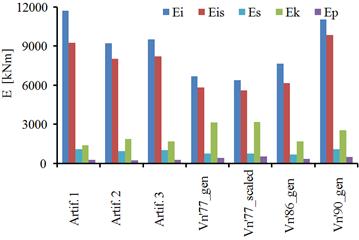
In Figure 5.8 and Figure 5.9 the energies induced by the seismic actions and dissipated by the isolated structure are presented, in both horizontal directions of the building. The following notations were used:
• Ei: the energy induced by the seismic actions;
• Eis: the energy dissipated by the isolation system;
• Es: the energy dissipated by the structure through post-elastic deformations and elastic damping;
• Ek: the kinetic energy;
• Ep: the potential energy.
For both isolation systems, the maximum energy dissipated takes place in the case of the seismic action Vn’90_gen and the minimum energy dissipated by the isolation system takes place for Vn’77_scaled seismic action, in both horizontal directions of the building.
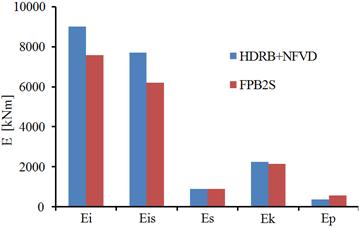
The mean energies induced by the seismic actions and dissipated through various mechanisms are presented in Fig. 5.10.
a)

b)
Fig. 5.10. The mean energies of the two isolation system: a) x direction; b) y direction
In order to have a fair indicator of the energy dissipated by the isolation systems and by the structure, this must be reported to the energy induced by the seismic actions. Thus, for the x direction of the building, the isolated structure, with the HDRB+NFVD system, dissipates 85.6% of the energy induced by the seismic actions through the isolation system and 9.8% through post-elastic deformations and elastic damping.
The isolated structure with the FPB2S system, dissipates 82.1% of the energy induced by the seismic actions through the isolation system and 11.7% through the post-elastic deformations and the elastic damping.
For the y direction of the building, the isolated structure with the HDRB+NFVD system, dissipates 85.1% of the energy induced by the seismic actions through the isolation system and 10.5% through the post-elastic deformations and elastic damping. The structure, isolated with FPB2S system, dissipates 81.4% of the energy induced by the seismic actions through the isolation system and 12.3% through post-elastic deformations and elastic damping.
5.4. The Base Shear Forces
The base shear force is a key parameter in characterizing the seismic response of the structures and it is used to design them.
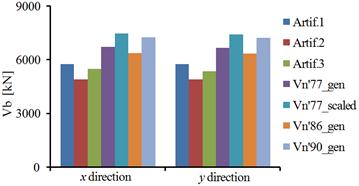
Figure 5.11a presents the base shear forces for the isolated building with the HDRB+NFVD system, in both horizontal directions of the building. For both directions of the building, the maximum base shear force is recorded to the Vn’77_scaled seismic action and the minimum base shear force is recorded to the Artif. 2 seismic action. The percentage difference between these two seismic actions is 34.5% for the x direction of the building and 33.8% for the y direction.
In Fig. 5.11b the base shear forces are presented for the isolated building with the FPB2S system, in both horizontal directions of the building. On the x direction, the maximum base shear force is recorded to the Vn’77_scaled seismic action and the minimum base shear force to the Artif.2 seismic action. The percentage difference between these two seismic actions is 30%. On the y direction, the maximum base shear force is recorded to the Vn’90_gen seismic action and the minimum base shear force to the Artif.2 seismic action. The percentage difference between these two seismic actions is 23.1%.
a)
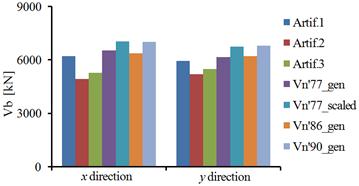
b)
Fig. 5.11. The base shear forces for the isolated building:a) Isolated building with HDRB+NFVD system; b) Isolated building with FPB2S system
The mean base shear forces, for the two isolation systems, are presented in Fig. 5.12. For both horizontal directions of the building, the maximum base shear force is obtained for the structure isolated with the HDRB+NFVD system. The percentage difference between the two isolation systems is of 1.3% on the x direction and of 2.6% on the y direction.
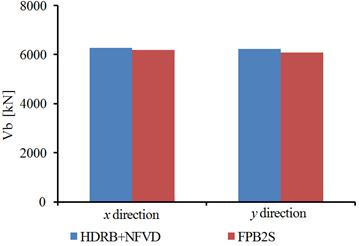
Fig. 5.12. The mean base shear forces for the building isolated with the HDRB+NFVD system and the FPB2S system
6. Conclusions
The performed study examines the seismic performance of two different base isolation systems. The paper analyses the seismic response expressed in terms of relative displacements, absolute accelerations, dissipated energies and base shear forces of base isolated structure to recorded and simulated earthquake ground motions.
The mean relative displacements of the structure with two isolation systems have close values regarding the relative displacements and base shear forces. The minimum absolute accelerations are obtained with the HDRB+NFVD isolation system. Regarding the dissipated energy, the HDRB+NFVD isolation system dissipates more energy than the FPB2S isolation system.
Both isolation systems have advantages and disadvantages. Depending on the design requirements a system or another can be used; for example, if the limitation of the storey accelerations is required the HDRB+NFVD isolation system is more suitable.
References
- Naeim, F., Kelly, J. M. (1997). Design of Seismic Isolated Structures. From Theory to Practice. New York, Chichester, Weinheim, Brisbane, Singapore, Toronto: John Wiley & Sons.
- Shanghai Eagle Bridge Technolgy Co. Ltd. Retrived January 04, 2012, from http://www.se-bt.com/en/index/.
- Constantinou, M.C. (2004, October). Technical Report. Friction Pendulum Double Concave Bearing. Retrived January 05, 2012, from http://nees.buffalo.edu/docs/dec304/FP-DC%20Report-DEMO.pdf.
- UniversitateaTehnică de ConstrucțiiBucurești. (2006). Cod de proiectareseismică P100: Partea I - Prevederi de proiectarepentruclădiri. P100-1/2006.București.
- SeismoArtif [computer software]. (2012). Pavia: SeismoSoftsrl. Available: http://www.seismosoft.com.
- European Committee for Standardization. (2004). Design of Structures for Earthquake Resistance – Part 1: General Rules, Seismic Actions and Rules for Buildings, European Standard. EN 1998-1:2004. Brussels.
- Cheng, F., Jiang, H., Lou, K. (2008). Smart Structures. Innovative Systems for Seismic Response Control. Boca Raton, London, New York: Taylor and Francis Group.
- Etabs v9.2.0 [computer software]. 2007). Berkeley: Computers and Structures Inc.
- SAP2000 v15.1.0 [computer software]. (2011). Berkeley: Computers and Structures Inc.
- Mander, J. B., Priestley, M. J. N., and Park, R. (1988). Theoretical stress-strain model for confined concrete. Journal of Structural Engineering ASCE. 114(8), 1804-1826. DOI: 10.1061/(ASCE)0733-9445(1988)114:8 (1804).


