
International Journal of Education and Information Technology, Vol. 1, No. 2, June 2015 Publish Date: May 28, 2015 Pages: 38-47
Why Do Students Drop out of School in Benin
Barthelemy Mahugnon Senou*
National School of Applied Economics, Management, University of Abomey-Calavi, Cotonou, Republic of Benin
Abstract
The important role of education in economic growth has long been recognized in econonic literature. The aim of this study was to analyze the dropping out phenomenon in primary school during the year in Benin by identifying its causes. The study used individual data about school children and classes, which enabled a close examination of the causes of each individual case in dropping out of school. With a multinomial logit model, we estimated the probability that the school child would be found in one of the three situations which are "to attend school regularly", "to take to absenteeism", and "to abandon school altogether". The results obtained showed that variables such as the level of health, student’s doing activities outside school hours, level of household, the quality of education and teachers' absenteeism are determinants of dropping out during the year, and that the phenomenon of dropping out is more pronounced among girls compared to boys. In view of these results, policy issues have been formulated to slow the phenomenon of dropping out.
Keywords
Dropping Out, Education, Quality, Logit Multinomial
Received: April 7, 2015
Accepted: April 25, 2015
Published online: May 27, 2015
@ 2015 The Authors. Published by American Institute of Science. This Open Access article is under the CC BY-NC license. http://creativecommons.org/licenses/by-nc/4.0/
Contents
1. Introduction 2. Background and Research Problem 3. Methodology 3.1. The Analytical Model 3.2. The Variables 3.3. Data Sources and Analytical Tools 4. Presentation, Analysis and Interpretation of Results 4.1. Outputs of Hausman and Mcfadden Test 4.2. Results of the Estimation of the Full Multinomial Logit Model 4.3. Results of the Reduced Multinomial Model 5. Conclusions and Policy Recommendations Acknowledgements
1. Introduction
The important role of education in economic growth has always been recognized: the first studies on the link between education and growth were based on the neoclassical model (Solow, 1956); the pioneer study was the article by Mankiw et al. (1992). The basic idea in this approach is that, human capital plays the same role in production as physical capital, and that accumulating years of schooling amounts to increasing the workforce, or, in other words, increasing productive efficiency while technology is held constant. This increased efficiency enables compensation for the decreasing returns to capital and, as a result, sustainable growth in the long term. The per capita GDP growth rate during a given period is thus proportional to the growth rate of the level of education during the same period, with the proportionality factor being the macroeconomic return to education. More recently, Lucas (2002) insisted on the contagion effects (or "externalities") of human capital: not only will an educated person be more productive to himself/herself, but he/she will also cause the others to be more efficient by getting them to accept new ideas and by advocating a better utilization of existing resources. Evidence for the relationship between education and economic growth has been, not only macroeconomic, but also microeconomic, as shown by Becker’s (1964) study, which has led to the gain function (Mincer, 1974).
In this ways, it is also important to be interested in every phenomenon which could reduce the education size or the share of population which seek after a high level of education. So, aware of its role, countries of the world have accorded an increasingly important role to education. This renewed interest in education was translated into the goal of universal primary school education, which countries of the world set themselves on the occasion of the World Education Forum held in Dakar from 26 to 28 April 2000. In this connection, the policies that have been followed during the last decade have contributed to improving the conditions of access to primary school education, thanks to investment in infrastructure and furniture.
2. Background and Research Problem
The classical approach to education considers that, increasing the rate of school enrolment is the chief goal, that parents are the principal stakeholders to be convinced, and that the financial costs of education are a real obstacle. But, according to Duflo (2010), this approach is fundamentally flawed to the extent that it does not take into account school absenteeism. Indeed, depending on the degree of motivation on the part of children, which is perhaps even more crucial in an environment where they are the first target of education (Duflo, 2010), the rate of school absenteeism throughout the world is quite telling (e.g., 49% in the rural area of India in 2005, 13% in the rural area in the Western Province of Kenya in 2006, and 14% in the rural area of Madagascar in 2007) (Duflo, 2010).
Benin, like other countries in Africa, experiences this problem of school absenteeism, too. The history of the educational system in Benin shows that in 1975, the country adopted reforms that defined the concept of "New School". The implementation of these reforms had positive effects on schools in Benin during the first years[1], effects which started dwindling between 1983 and 1985, in part due to the political and social crises the country was going through.
At first sight, one could be led to believe that Benin is very close to achieving universal primary school education, thus meeting the quantitative requirement of school enrolment. However, this impressive gross enrolment ratio is offset by a low rate of retention or survival (the proportion of children enrolled in primary school and who reach the fifth and sixth years of primary school) even though access to the first year of primary school is almost universal thanks to the abolition, in 2000, of primary school tuition fees within the framework of the Highly Indebted Poor Countries (HIPC) Initiative.
Table 1. Trends in the rates of primary school children reaching Class 6.
| Year | 1990 - 1991 | 2001 - 2002 | 2003 – 2004 | 2005 – 2006 | 2015* |
| Rate of reaching Class 6 | 23% | 28% | 50% | 52% | 71% |
Source: INSAE, 2010, Ministry in charge to Education, DPP and DES.
These data show a high level of dropping out of primary school. Such a high level calls for an investigation into the causes of this phenomenon, especially when it is known that both repeating a school year and dropping out of school cost resources that should have been used to increase the school enrolment ratio or to improve the quality of educational services. In relation to this, the Constitution of Benin stipulates, in its article 13, the following: "The State shall provide for the education of the youth in public schools. Primary school education is compulsory. The State shall progressively guarantee free education in public schools."
It is against this background that the present study set out to investigate the persistent phenomenon of dropping out of school in Benin in spite of the efforts made, and the resources used, by the government to retain children at school. The study thus sought to address the following question: What are the causes of the persistent dropping out of school in the course of the year despite the policies against dropping out of school the country has been implementing for about two decades now? The aim of the paper is to analyse the phenomenon of dropping out of primary school in the course of the year in Benin by identifying its causes.
However, before invest the phenomenon in Benin, it is important to indicate what we know about it. There have been quite a number of studies, both in the social sciences and economics, on the phenomenon of dropping out of school. One of the early studies on the dropout is that of Ortiz et Dehon (2013), who studies the factors that influence both dropout in the French-speaking Belgian community. Generally, most of these studies focused on the explanatory factors for this phenomenon. The various studies looked at these factors from several angles: some analysed the role of information (Becker, 1964; Jensen, 2007; Nguyen, 2008; Duflo, 2010), others analysed the role of health (Grossman and Kaestner, 1997; Hammond, 2002; Dickson et al. 2000; Bobonis et al., 2006; Bleakley, 2007a & 2007b; Duflo, 2010), still others looked at the role of parents (Hanushek et Woessman, 2007; Duflo, 2010), and still more others the role of the quality of school (Behrman et Birdsall, 1983; Harbison et Hanushek, 1992; Hanushek et Woessman, 2007; Sènou, 2014).
3. Methodology
The present study used individual data about school children and classes, which enabled a close examination of the causes of each individual case of dropping out of school.
3.1. The Analytical Model
From a purely micro-econometric point of view, and following Hanushek et Woessman. (2007), the study assumed that there were three choices for each schoolchild: to attend school regularly, to take to absenteeism, and to abandon school altogether. The study set out to estimate the probability that the schoolchild would be found in one of these three situations.
Suppose that ![]() represents the situation in which a given schoolchild is during a given year.
represents the situation in which a given schoolchild is during a given year. ![]() takes one of three values of
takes one of three values of ![]() (
(![]() =0 is the schoolchild attends school regularly,
=0 is the schoolchild attends school regularly, ![]() =1 if he/she takes to absenteeism, and
=1 if he/she takes to absenteeism, and ![]() =2 if he/she abandons school altogether). The probability to be estimated is:
=2 if he/she abandons school altogether). The probability to be estimated is:
![]() (1)
(1)
where ![]() represents a vector of explanatory variables for the situation in which the schoolchild is. These are variables related to the demand for education and the provision of education.
represents a vector of explanatory variables for the situation in which the schoolchild is. These are variables related to the demand for education and the provision of education.
Those related to the demand for education are: the schoolchild’s characteristics (age, sex, previous education, his/her activities during out-of-school time, etc.), his/her state of health, the characteristics of the household where he/she lives (income, level of education, number of children, ethnic group affiliation, religion, etc.).
Those related to the provision of education are: the quality of the school (as reflected in the availability of infrastructure and teaching materials, types of classrooms, electricity supply in the classrooms, etc.) and the way the school functions (as reflected in the presence of teachers, the length of time they have been in the job and at the school, the nature of their contract, their level of training, etc.).
In its analysis, the present study split the situation of the schoolchild into different aspects, as shown in the tree of situations in the figure below, where the "regular school attendance" situation has been separated from the other situations (of non-regular school attendance).
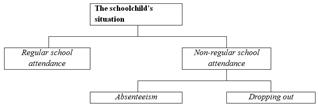
Figure 1. Differents school child’s situation.
Source: Constructed by the author.
Let us now turn to how all this was specified mathematically. Two specifications are possible, depending on whether or not the independence or otherwise of the non-relevant alternatives (Hypothesis IIA) was taken into account: the Multinomial Logit (ML) specification and the Embedded Multinomial Logit (EML) specification (Mc Fadden, 1987).
With the ML model, the probability that a school child would take to absenteeism or abandon school altogether, meaning clearly that he/she does not attend school regularly, was estimated using the following equation:
 (2)
(2)
The way the probability that the school child would attend school regularly was going to be different in an EML model. This probability was estimated using the following equation:
![]()
where
 (3)
(3)
In this specification, the vector ![]() corresponds to a set of variables that are specific to the explanation of regular school attendance or the lack of it. These variables can be different from the explanatory variables of the type of non-regular school attendance (absenteeism or dropping out)
corresponds to a set of variables that are specific to the explanation of regular school attendance or the lack of it. These variables can be different from the explanatory variables of the type of non-regular school attendance (absenteeism or dropping out) ![]() . The term
. The term ![]() represents the inclusive value for the cluster of situations concerned (in this case the two of non-regular school attendance). In this formulation, if λ is equal to 1, the EML model gets reduced to a standard ML one. It is only by enabling the λ term to be different from 1 that the EML model relaxes the hypothesis IIA through the different "branches" of the situation tree above. This hypothesis is maintained between the choices belonging to the same cluster but is released between groups. The probability that the school child will be in one situation or another can be expressed as follows:
represents the inclusive value for the cluster of situations concerned (in this case the two of non-regular school attendance). In this formulation, if λ is equal to 1, the EML model gets reduced to a standard ML one. It is only by enabling the λ term to be different from 1 that the EML model relaxes the hypothesis IIA through the different "branches" of the situation tree above. This hypothesis is maintained between the choices belonging to the same cluster but is released between groups. The probability that the school child will be in one situation or another can be expressed as follows:
![]()
The specification we use depends on the results of IIA test (Hausman and McFadden test).
3.2. The Variables
In the model that was used in the different tests of the validity of the hypothesis IIA, the explained variable is the situation in which the schoolchild was during the year; it was written as SITUATION. This is a discreet variable that was assigned the values 0 (if the schoolchild attended school regularly), 1 (if he/she had taken to absenteeism) and 2 (if he/she had dropped out of school). As specified earlier, the explanatory variables are those related to the demand for and provision of education.
The variables taken into account regarding the demand for education were the following:
Age mismatch (written as RETAGE): this measured the number of years which the school child had lost in relation to the age required for the class he/she was in. The study assumed that the schoolchild whose age was higher than that required for his/her class would be less inclined to attend school regularly.
Sex (SEXE): in view of the sociological context in Benin, the study expected a positive effect of this variable on the explained variable, given that households tend to send more boys to school than girls.
Previous education (SCOLANTEk): this measured the school child’s performance during previous years. It was assumed that this variable would have a positive effect on dropping out of school, because if a school child repeated a year many times, this was likely to discourage parents from keeping him/her at school and, instead, involved them in income-generating activities.
Activities carried out during out-of-school time (ACTIVITE): for example, domestic chores, working on the farm (especially in rural areas), and small trade (especially in urban areas) are activities usually done by school children during out-of-school time and which are likely to affect their regular school attendance (Manier, 1999). It was assumed that such activities would have a positive effect on absenteeism or dropping out of school.
State of health (SANTE): the school child’s state of health was estimated based on the number of times he/she had fallen sick during the previous year. It was assumed that the more often a schoolchild would fall sick, the lower the probability that he/she would attend school regularly (Bobonis et al., 2006).
Household characteristics: the household’s income, its expenses, its size, the parents’ level of education, their religion, etc. Since education is an investment (Becker, 1964), sending children to school is a question of financial means, which means that children whose parents have a high income tend to stay at school longer. Likewise, children of educated parents will also tend to stay at school longer. For its part, the size of the household was assumed to have a negative impact on keeping a child at school for the same economic reasons (Altinok, 2007). As a sociological factor, the effect of religion was assumed to be indeterminate, as it depended on where the school child lived.
The variables taken into account regarding the provision of education were the following:
Quality of the school (QUALITE): recent research has brought to the fore the issue of the quality of education which, as Hanushek and Woessman (2007) underscore, counts for more when it comes to accounting for the differences in the average number of years of school or the school enrolment ratio. An index of the availability and quality of school facilities was constructed using the multiple components analysis (MCA). This index was obtained from eleven variables (among which the availability of electricity and materials to build walls, roofs, and floors; the general state of the school buildings, the existence of a clean drinking water point, a canteen, a library, etc.). It was expected that the schoolchildren frequenting the schools with the best facilities would be less likely to take to absenteeism or to drop out of school (Hanushek and Woessman, 2007).
Functioning of the school: this variable covered the presence of teachers, their length of service, the nature of their contract, and their level of education. Following PASEC Bénin’s (2005) findings, the present study postulated that the most regular teachers, those who had been in service for a long time, those who were on a permanent contract, and those who had a high educational or teacher training qualification would tend to keep the schoolchildren at school longer.
Table 3 presents the description of the variables, their features and values and their expected effects on dropping out of school.
Table 2. Description of variables, their features and values and expected effects.
| Category of variable | Specific variable | Description | Features and values | Expected effect on dropping out of school |
| Education demand variables | RETAGE | Schoolchild’s age mismatch | Discrete (in years) | + |
| SEXE | Schoolchild’s sex | 1, if a girl; 0, if not | + | |
| SCOLANTE_k[2] | Schoolchild’s previous schooling | 1, if schoolchild has not repeated the year; 0, if he/she has | - | |
| TRANSFERE | Whether the schoolchild was transferred from another school | 1, if the schoolchild was transferred from another school; 0, if not | +/- | |
| ACTIVITE1 | Schoolchild does domestic chores | 1, if he/she does domestic chores; 0, if not | +/- | |
| ACTIVITE2 | Schoolchild participates in small trade activities | 1, if he/she is used in small trade activities; 0, if not | + | |
| ACTIVITE3 | Schoolchild works on the farm | 1, if he/she works on the farm; 0, if not | + | |
| SANTE | Schoolchild’s state of health (number of times he/she fell sick in the course of the year) | Discrete | + | |
| MGETAILLE | Size of the household | Discrete | + | |
| MGEREVENU | Household’s average income | In CFAF | - | |
| REVENU_INF1 | Schoolchild’s parents belong to the 1st income quintile | 1, if the parents are in the 1st income quintile; 0, if not | + | |
| REVENU_INF2 | Schoolchild’s parents belong to the 2nd income quintile | 1, if the parents are in the 2nd income quintile; 0, if not | + | |
| REVENU_MOY | Schoolchild’s parents belong to the 3rd income quintile | 1, if the parents are in the 3rd income quintile; 0, if not | +/- | |
| REVENU_SUP1 | Schoolchild’s parents belong to the 5th income quintile | 1, if the parents are in the 5th income quintile; 0, if not | - | |
| REVENU_SUP2 | Schoolchild’s parents belong to the 5th quintile | 1, if the parents are in the 5th income quintile; 0, if not | - | |
| MGEDEPENSE | Household’s average monthly expenses | In CFAF | - | |
| RELIGION_christian | Parents or tutors are Christians | 1, if the parents are Christians; 0, if not | +/- | |
| RELIGION_musulman | Parents or tutors are Muslims | 1, if the parents are Muslims; 0, if not | +/- | |
| RELIGION_animism | Parents or tutors are animists | 1, if the parents are animists; 0, if not | +/- | |
| PEREEDUC | Father’s literacy | 1, if the father is literate; 0, if not | - | |
| MEREEDUC | Mother’s literacy | 1, if the mother is literate; 0, if not | - | |
| SEXE_CHEF_MGE | Sex of the head of the household | 1, if the head of the household is female; 0 if not | - | |
| Education provision variables | QUALITE | School’s quality index | Continuous (between 0 and 1) | - |
| MTPRESENCE | Teacher’s rate of absenteeism | Discrete (number of days of absence) | + | |
| MTANCIENTE | Teacher’s length of service | In number of years | - | |
| MTPERMANENT | Teacher’s contract status | 1, if permanent; 0, if not | - | |
| MTNIVEDUC | Teacher’s level of education | 1, if he/she completed secondary school; 0, if not | - | |
| MTDIPLPED | Teacher’s level of teacher training education | 1, if he/she underwent teacher training; 0, if not | - |
Source: Constructed by the author.
3.3. Data Sources and Analytical Tools
The individual data used in the present study were drawn from the database of PASEC-CONFEMEN Bénin 2004-2005.[3] To this end, requests were made, both to the CONFEMEN office in Dakar and its branch in Benin, to get the various databases: databases for "schoolchildren" and those for "teachers" for the second and fourth years. Some 86% of the sample came from public primary schools.
4. Presentation, Analysis and Interpretation of Results
The estimations’ results of the school-dropping-out model are presented by level (second-year classes and fourth-year classes). First, the results of the complete model (covering all the explanatory variables are presented. Then, the results of the estimations of the reduced ML model are presented.
4.1. Outputs of Hausman and Mcfadden Test
We test H0: alternatives are independents versus to H1: alternatives are dependents.
Whatever the alternative removed, the chi2 obtained is always less than the tabulated chi2 which is 27.587. Different alternatives (attendance, absenteeism and dropping out) are then independent; it is therefore no significant difference when removing one of the alternatives, and therefore it is appropriate to use a multinomial logit model (LM) rather than Embedded multinomial logit (EML).
4.2. Results of the Estimation of the Full Multinomial Logit Model
Below are presented the results of the estimation of this model. It should be noted that the estimation was done using the relative-risk ratio (RRR) in order to enable an interpretation of coefficients in terms of both their signs and their magnitude.
Table 3. Hausman and McFadden test result.
| class | Alternative removed | Degree of freedom | Chi2 | Prob>chi2 | Conclusion |
| CP | Regular school attendance | 17 | 10.27 | 0.8921 | H0 accepted |
| Absentéist | 17 | 9.89 | 0.8247 | H0 accepted | |
| CM1 | Regular school attendance | 17 | 7.32 | 0.8355 | H0 accepted |
| Absentéist | 17 | 8.74 | 0.8971 | H0 accepted |
Source: Author’s computations using Stata.
Table 4. Results of the estimation of the full ML model.
| Variable | 2nd year classes | 5th year classes | ||||||
| Regular school attendance | Dropping out of school | Regular school attendance | Dropping out of school | |||||
| RRR | p-value | RRR | p-value | RRR | p-value | RRR | p-value | |
| RETAGE | (-).7217925** | 0.015 | (+).9984251 | 0.974 | (-)1.082614 | 0.235 | (+)1.031165 | 0.470 |
| SEXE | (-)1.049354 | 0.811 | (+).8536124 | 0.025** | (-)1.762968** | 0.006 | (+).9489546** | 0.019 |
| SCOLANTE_1 | (+)2.241501** | 0.001 | (-).840548 | 0.214 | - | - | - | - |
| SCOLANTE_2 | (+) .9683457 | 0.912 | (-).8087229 | 0.235 | - | - | - | - |
| SCOLANTE_4 | - | - | - | - | (+)1.019269 | 0.846 | (-)1.311295 | 0.154 |
| SCOLANTE_5 | - | - | - | - | (+)1.744284* | 0.065 | (+).8059587 | 0.325 |
| ACTIVITE1 | (-) 1.348728 | 0.479 | (+)1.074524 | 0.757 | (-)1.818135 | 0.225 | (+)1.691625 | 0.101 |
| ACTIVITE2 | (-) 1.349478 | 0.258 | (+)1.754875** | 0.001 | (-)1.016587 | 0.925 | (+)1.18202 | 0.039 |
| ACTIVITE3 | (-) 1.326912 | 0.185 | (+).8004112* | 0.096 | (-).664145* | 0.099 | (+)1.199220 | 0.265 |
| SANTE | (+) 1.032521 | 0.677 | (-).9619578** | 0.031 | (+).9949352 | 0.954 | (-).731624** | 0.001 |
| MGETAILLE | (+)1.135812 | 0.325 | (+)1.435610** | 0.001 | (-).7773695* | 0.098 | (+)1.127552 | 0.224 |
| MGEREVENU | (+)1.134533 | 0.142 | (-)1.000075** | 0.001 | (+).9999801** | 0.0441 | (-)1.000002 | 0.176 |
| PEREEDUC | (+).5898961** | 0.012 | (-).7896514* | 0.079 | (+).9834320 | 0.995 | (-).9756299 | 0.088 |
| MEREEDUC | (+).8353701 | 0.495 | (-)1.252124 | 0.134 | (+)1.140958 | 0.641 | (-)1.224069 | 0.251 |
| QUALITE | (-)3.194925 | 0.201 | (+)15.70574** | 0.001 | (-).8009241 | 0.765 | (+).8596410 | 0.781 |
| RELIGION_christian | (+).185214 | 0.925 | (-).73584 | 0.568 | (+).138527 | 0.710 | (-).351257 | 0.352 |
| RELIGION_musulman | (+).23589 | 0.192 | (-).50012 | 0.172 | (+).84581 | 0.684 | (-).75881 | 0.411 |
| SEXE_CHEF_MGE | (-)1.30458 | 0.047 | (+).58245 | 0.081 | (-).96584 | 0.158 | (+).73395 | 0.049 |
| MTPRESENCE | (-)1.115025** | 0.004 | (+).6236124** | 0.001 | (-)1.119588** | 0.001 | (+).7471120** | 0.001 |
| MTANCIENTE | (+)1.003762 | 0.884 | (-)1.006784 | 0.558 | (+)1.052362** | 0.034 | (-)1.07054** | 0.001 |
| DIPLPEDAG | (+)1.273304 | 0.324 | (-)2.324847** | 0.0001 | (+).8049652* | 0.059 | (-).8957211* | 0.076 |
| MTBAC | (+).5082112 | 0.115 | (+).3294235** | 0.0012 | (+)1.667968 | 0.122 | (-)1.150025 | 0.539 |
| Prob > chi2 | 0.0001 | 0.0001 | ||||||
| Number of observations | 1986 | 1700 | ||||||
| Likelihood logarithm | 484.14 | 364.32 | ||||||
| Reference situation | Absenteeism | Absenteeism | ||||||
* Significant at the 10% threshold; ** Significant at the 5% threshold
(+), (-): the direction in which the explanatory variable affects the explained variable concerned
Source: Author’s computations using Stata
Overall analysis of the data In table 6, first, it can be observed that, overall, for both second-year and fourth-year classes, a number of variables related to the demand for education and those related to the provision of education, significantly explain the situation in which a given schoolchild was during the school year. The variables related to the demand for education are the sex of the schoolchild, the activities in which he/she engaged during out-of-school time, the size of the household in which he/she lived, his/her parents’ income, their level of education, and their health status. The variables related to the provision of education are the quality of education, the teachers’ length of service, their level of education, and their teacher-training qualifications.
It should also be noted that the explanatory factors for the phenomenon of dropping out of school were observed to vary according to the level of primary school concerned: that is, the variables that were found to be significant in the case of the second-year classes are not the same as those found to be significant in the case of the fourth-year classes: for example, it was observed that the explanatory factors for dropping out of school in the case of fourth-year classes were more those related to the provision of education than those related to the demand for it.
Furthermore, it was observed that the significance of variables such as the schoolchildren’s status of health and the activities they get involved in during out-of-school time confirmed the results of the statistical analyses done in the previous paragraphs, results according to which the main reasons given to justify school absenteeism were those related to health and domestic chores.
Considering cultural practices, one would have thought that the religion practised by schoolchildren’s parents or tutors would have a significant impact on dropping out of school. However, this study’s finding was that the impact of religion was not significant, be it for second-year or fourth-year classes. This finding can be justified by the awareness campaigns that the government has undertaken, since the last decade, to sensitize the parents and the different religious leaders and traditional chiefs on the necessity to send children to school and do everything possible to keep them in the educational system.
The sex of the head of the household was also found to be a significant variable in keeping schoolchildren at school: indeed, the present study found that children living in households headed by females were more likely to drop out of school than those living in households headed by males. This raises again the issue of the parents’ responsibility in their children’s education. Indeed, the statistics reported in Table 4 show that the percentage of literate men was higher than that of literate women. So, it would seem logical that the children living in households headed by more educated people would be less inclined to drop out of school.
Let us now turn to the interpretation of the parameters that were estimated within the ML model framework.
Analysis and interpretation of the effect of key variables on dropping out of school the direction in which the different variables affect the explained variables is indicated by the sign given between parentheses in Table 6. Looking at the different signs in the table, it is clear that they were found to be the same overall for both levels of school studied (the second-year classes and the fourth-year ones). More specifically, the variables related the demand for education such as the activities which the schoolchildren engage in during out-of-school time, their health status and the size of the households they lived in, were found to have a positive effect on the probability that the schoolchildren would drop out of school both in second-year classes and fourth-year ones. On the other hand, household income and the father’s level of education reduced this probability.
With regard to the variables related to the provision of education, the study found that only two variables, namely the fact that the teacher had secondary school education and the level of teacher absenteeism, increased the probability that the schoolchild would drop out of school in the course of the year. On the other hand, the quality of education, the teacher’s length of service, and his/her having a teacher-training qualification are variables that were found to reduce this probability.
The different results reported in the preceding paragraphs are consistent with theoretical expectations and corroborate the findings of other studies such as those by Hammond (2002), Dickson et al. (2000), Kremer and Miguel (2004), and Hanushek et Woessman. (2007). Similar results were reported for Uganda, as part of the assessment, in 2007, of the country’s progress in achieving the Millennium Development Goals In view of all that, what is the magnitude of the effect of the different variables on the explained variable? The response to this question requires that one make recourse to the value of the estimated RRR coefficients. Let us therefore examine this value for some key variables of the model, namely: the activities the schoolchildren get involved in during out-of-school time, household income, the schoolchildren’s health status, the quality of education, teacher absenteeism, and the teachers’ teacher-training education.
According to the results of the estimation, engaging in domestic chores did not have a significant influence on the probability of the schoolchildren dropping out of school. However, working on the farm and doing small-trade activities was found to significantly affect this probability: in the case of second-year classes, for a schoolchild involved in trading activities, this probability was 175% that of a schoolchild who simply took to absenteeism; for a schoolchild who worked on the farm, the same probability was 80% that of a schoolchild who took to absenteeism; in the case of fourth-year classes, that probability for the corresponding situations was 118% and 119%, respectively. All this suggests that getting involved in those activities led the schoolchild more to drop out of school than simply take to absenteeism.
Regarding the schoolchildren’s health status, the study found that, for a given schoolchild, an additional morbid spell multiplied by 0.96 the probability of a second-year class child to drop out than to simply take to absenteeism, and multiplied it by 0.73 in the case of a fourth-year class child. As for the effect of household income, a 1% additional increase in it left significantly invariant the probability of second-year children dropping out of school.
With regard to the level of quality of education in schools, it was observed that a one-point increase in the quality index for the school frequented by a given schoolchild in a second-year class divided the probability that he/she would drop out of school rather than simply take to absenteeism by 1.70; in the case of fourth-year classes, the effect of this probability was not significant. This finding could mean that schoolchildren in the lower classes may be more sensitive to the quality of education than those in upper classes because the latter are already getting near the completion of the primary school course and thus get encouraged by their parents to complete the course despite the difficulties encountered.
In relation to the teacher’s regular presence for teaching, it was observed that one additional day of the teacher’s absence was more likely to lead to his/her schoolchildren to drop out of school than simply take to absenteeism. It was further observed that the probability that schoolchildren in second-year classes would drop out of school rather than simply take to absenteeism was 230% (i.e., more than double) when the teacher had a teacher-training qualification than when he/she did not have one; the same probability was 89% in the case of fourth-year classes. This shows, once again, that the effect of the teacher having a teacher-training qualification on schoolchildren’s dropping out of school was more perceptible in the lower classes than in the upper ones.
4.3. Results of the Reduced Multinomial Model
This reduced model excludes the variables that are potentially endogenous such as the schoolchildren’s age mismatch (RETAGE), their previous schooling (SCOLANTE_k), the activities they get involved in during out-of-school time (ACTIVITE_i), and the variables related to income of the households they live in (REVENU-INF1, etc.), the aim here is to see whether the estimated RRR’s vary significantly so as to measure the real impact of the different explanatory variables on dropping out of school.
Table 5. Results of the estimation of the reduced multinomial model.
| Variable | Second-year classes | Fourth-year classes | ||||||
| Regular attendance | Dropping out of school | Regular attendance | Dropping out of school | |||||
| RRR | p-value | RRR | p-value | RRR | p-value | RRR | p-value | |
| SEXE | (-).048121 | 0.612 | (+).635514 | 0.023** | (-)1.568459** | 0.007 | (+).841512** | 0.015 |
| SANTE | (-) .042765 | 0.540 | (+).658125** | 0.047 | (-).588912 | 0.762 | (+).678451** | 0.001 |
| MGETAILLE | (+).358124 | 0.445 | (+)1.63701** | 0.000 | (-).425174* | 0.062 | (+).587891 | 0.324 |
| PEREEDUC | (+).458401** | 0.010 | (-).514253* | 0.042 | (+).622125 | 0.929 | (-).896524 | 0.051 |
| MEREEDUC | (+).752958 | 0.405 | (-).501364 | 0.111 | (+)1.129510 | 0.597 | (-)1.175874 | 0.248 |
| QUALITE | (+)1.025732 | 0.119 | (-)1.35874** | 0.001 | (+).566352 | 0.410 | (-).658415 | 0.242 |
| MTPRESENCE | (-)1.01952** | 0.001 | (+).512251** | 0.001 | (-)1.152471** | 0.001 | (+).840101** | 0.001 |
| MTANCIENTE | (+).296715 | 0.654 | (-)1.014621 | 0.481 | (+)1.041112** | 0.025 | (-)1.001914** | 0.001 |
| DIPLPEDAG | (+)1.05121 | 0.295 | (-)1.055844** | 0.001 | (+).625878* | 0.034 | (-).5986873* | 0.071 |
| MTBAC | (+).482132 | 0.201 | (+).3125469** | 0.001 | (+)1.598625 | 0.209 | (-)1.302155 | 0.475 |
| Prob > chi2 | 0.0001 | 0.0001 | ||||||
| Number of observations | 1,986 | 1,700 | ||||||
| Likelihood Log | 480.25 | 368.22 | ||||||
| Reference situation | Absenteeism | Absenteeism | ||||||
* Significant at the 10% threshold; ** Significant at the 5% threshold
(+), (-): the direction in which the explanatory variable affects the explained variable concerned
Source: Author’s computations using Stata
From the results in Table 7, three observations can be made: first, even though the value of the estimated RRR’s has changed vis-à-vis that obtained in the full model, their signs and the level of significance have remained the same overall. So, it can be concluded that the analyses done above remain valid overall, especially in terms of the direction in which the different variables affect the phenomenon of dropping out of school. Second, the value of the likelihood logarithm has not increased significantly, which relatively maintains the level of significance of the model. Finally, and most importantly, the "quality of education" variable this time round was found to have had a negative effect on dropping out of school, unlike what was found in the full model. This means that the efforts made towards improving the quality of education significantly reduced the rate of dropping out of school in the course of the year.
Even though the results reported in the previous paragraphs provide useful information on the phenomenon of dropping out of school in Benin, I deemed it useful to seek the views of the stakeholders in the educational system on the ground, so as to compare these views with the results obtained from the analysis of the data drawn from the PASEC-CONFEMEN database — which, it should be recalled, dates back to 2004-2005. Doing this was all the more appropriate because the phenomenon of dropping out of school can be more dynamic, as the causes of it can change over time.
5. Conclusions and Policy Recommendations
The present study set out to identify the key factors that are likely to influence school children’s dropping out of school. The results reported in previous sections and obtained from analyses of individual data drawn from the PASEC-CONFEMEN database as well as from interviews with stakeholders on the ground, show, as one might expect, that both the variables related to the provision of education and those related to the demand for it affect the school children’s propensity to drop out of school in the course of the year. That is why it is urgent for measures to be taken by both the government and the other stakeholders in the educational system, notably NGOs, in order to curb the phenomenon of dropping out of school.
The following measures are being proposed here: first, efforts must be made to improve the schoolchildren’s health status. This can be done, for example, by putting in place special programmes to monitor the health of schoolchildren, which would require availing schools with adequate health centres equipped with basic facilities and medicine to prevent the most frequent diseases, especially public health diseases.
Second, awareness campaigns should be conducted to persuade parents that having their children engage in trading and farming activities outside of school time is detrimental to their children, as it may lead the latter to drop out of school. The NGOs that are stakeholders in the educational system must be partners in these campaigns for them to be effective.
Third, measures must be taken to improve households’ living standards to enable parents to have enough resources to keep their children at school. Such measures could consist in giving small loans to households for income-generating activities.
Fourth, efforts must be made by both the central government and the local governments to improve the quality of education in schools, especially by using quality materials to build schools, by electrifying these and providing them with clean drinking water points, canteens, libraries, etc. An essential point to bear in mind here is that it is necessary to continue providing education to avoid creating a situation where it is the school that abandons schoolchildren by not having all the classes required for the complete course.
Fifth, efforts must be made by the government to reduce the rate of teacher absenteeism by putting in place, not only measures that are binding on teachers, but also those that offer them incentives. Still regarding teachers, efforts must also be made to offer them teacher training to empower them to do their job competently and, thus, to curb the dropout rate.
If the different measures recommended above are taken, even if the phenomenon of dropping out of school is not eradicated, it will at least be greatly reduced, thus increasing the chances of keeping both boys and girls at school, which is a necessary condition for achieving the education-for-all goal.
Acknowledgements
I am grateful to the African Economic Research Consortium for sponsoring the study under its thematic research grant scheme, and to its staff for the efficient way they facilitated the research. Early drafts of the study benefited from comments and suggestions made during the AERC’s biannual research seminars. I want to thank the participants of Group A (Poverty, Income Distribution and Food Security) at the December 2010, May 2011 and December 2011 biannual research workshops. I am particularly grateful to Erik Thorbecke, Patrick Plane, Jean-Yves Duclos and Germano Mwabu. The findings, interpretations, views, conclusions and policy suggestions are mine, and any flaws in the study remain my express responsibility.
References
- Altinok, N. 2007."Essais sur la qualité de l’éducation et la croissance économique". Doctoral Thesis, University of Bourgogne.
- Banque, Mondiale. 2009."Le système éducatif béninois analyse sectorielle pour une politique éducative plus équilibrée et plus efficace". Working Paper No. 165. Banque mondiale, avril, pp. 30-31.
- Becker, G. 1964. Human Capital: A Theoretical and Empirical Analysis with Special Reference to Education. New York: Columbia University Press.
- Behrman, J.R. and N. Birdsall. 1983. "The quality of schooling: Quantity alone is misleading". American Economic Review, 73(5): 928-46.
- Ben-Porath, Y. 1970. "The production of human capital over time". In W.L. Hansen, ed., Education, Income and Human Capital, pp. 129-47. New York: National Bureau of Economic Research.
- Bleakley, H. 2007a. "Disease and development: Evidence from hookworm eradication in the American South". Quarterly Journal of Economics, 122(1): 73-117.
- Bleakley, H. 2007b. "Malaria eradication in the Americas: A retrospective analysis of childhood exposure", American Economic Journal: Applied Economics 2(2): 1-45.
- Bobonis, G., E. Miguel and C.P. Sharma. 2006. "Iron deficiency anemia and school participation". Journal of Human Resources, 41(4): 692-721.
- CAPOD/MPDEPPCAG. 2009.: Réduction des inégalités de revenu et émergence d’une classe moyenne au Bénin. Final Report.
- Commission du Débat National sur l’Avenir de l’Ecole. 2004. Les Français et leur école - Le miroir du débat. Dunod.
- Dickson, R., S. Awasthi, P. Williamson, C. Demellweek and P. Garmer. 2000. "Effects of treatment for intestinal helminth infection on growth and cognitive performance in children: Systematic review of randomized trails". British Medical Journal, 320: 1697-1701.
- Duflo, E. 2010. "Le développement humain: Lutter contre la pauvreté (I)". La République des idées, Édition du Seuil.
- Grossman, M., and R. Kaestner. 1997. "Effects of education on health". In J.R. Behrman and N. Stacey, eds., The Social Benefits of Education. Ann Arbor, Mich.: University of Michigan Press.
- Hammond, C. 2002. "How education makes us healthy". London Review of Education, 1(1): 61–78.
- Hanushek, E.A., and L. Woessman. 2007. Education Quality and Economic Growth. Washington, D.C.: The World Bank.
- Harbison, R.W. and E.A. Hanushek. 1992. Educational Performance of the Poor: Lessons from Rural Northeast Brazil. New York: Oxford University Press.
- Heckman, J.J. 1976. "A life-cycle model of earnings, learning, and consumption". The Journal of Political Economy, 84(4): S11-S44.
- INSAE. 2008. Tableau de Bord Économique et Social du quatrième trimestre 2008.
- INSAE. 2010. Tableau de Bord Économique et Social du quatrième trimestre 2010.
- Jensen, R. 2007. "The (Perceived) Returns to Education and the Demand for Schooling," Quarterly Journal of Economics, 125(2), p. 515-548.
- Kremer, M. and E. Miguel. 2004. "Worms: Identifying impacts on education and health in the presence of treatment Externalities". Econometrica, 72(1): 159-217.
- Lucas, R. 2002. Lectures on Economic Growth. Cambridge, MA: Harvard University Press.
- Maddala, G.S. 1983. "Limited dependent and qualitative variables in econometrics". Econometric Society Monograph No. 3. Cambridge: Cambridge University Press.
- Manier, B. 1999. Le travail des enfants dans le monde. Paris: Éditions la découverte.
- Mankiw, N.G., D. Romer and D.N. Weil. 1992. "A contribution to the empirics of economic growth". Quarterly Journal of Economics, 107(2): 407-37.
- Mc Fadden, D. 1987. "Regression-based specification tests for the multinomial logit model". Journal of Econometrics, 34: 63-82.
- Mincer, J. 1974. Schooling, Experience and Earnings. New York: Columbia University Press for NBER.
- Ministères en charge de l’Education, DPP and DES. Annuaires statistiques de l’éducation, 2000 à 2007.
- Nguyen, T. 2008. "Information, role models and perceived returns to education: Experimental evidence from Madagascar". Unpublished Manuscript, J-PAL at MIT.
- Ortiz E.A. an Dehon C. 2013, " Roads to Success in the Belgian French Community's Higher Education System: Predictors of Dropout and Degree Completion at the Université Libre de Bruxelles", Research in Higher Education, Vol. 54, No. 6 , pp. 693-723.
- PASEC CONFEMEN Bénin. 2005. Rapport sur la qualité de l’éducation au Bénin.
- Rosen, S. 1976. "A theory of life earnings". The Journal of Political Economy, 84(4): S45-S67.
- Sènou B.M. 2014,Dropping out of School in the Course of the Year in Benin: A Micro-econometric Analysis, AERC Research Paper 270.
- Solow, R. 1956. "A contribution to the theory of economic growth". Quarterly Journal of Economics, 70: 65-94.
- UNESCO/BREDA. 2006. Éducation pour tous en Afrique : Statistiques et analyses sous-régionales, Dakar +6. The Dakar Centre.
Footnotes
[1] These effects are: a rapid increase in the numbers of children enrolled in primary school, a generalization of secondary school education, and a dramatic rise in the numbers of students registering for higher education.
[2] k refers to a year already completed by the schoolchild; at primary school level, for example, this means the first year of primary school for a child who is not repeating the year and the first and second years for one repeating the year.
[3] PASEC- CONFEMEN is a programme for analysing educational systems used by the Conference of the Ministers for Education. As part of this programme, surveys are organized in French-speaking countries in Africa to assess the quality of their education system.


