American Journal of Educational Science, Vol. 1, No. 4, September 2015 Publish Date: Aug. 17, 2015 Pages: 210-217
Exploring Factors Affecting Grade VIII Students’ Attainment in Science: Options for Reforms
Hafiz Muhammad Iqbal1, *, Fariha Bibi2, Namra Tayyab Saad Iqbal3
1Office of the Vice President for Academic Affairs, University of Dammam, Dammam, Saudi Arabia
2University of Modern Languages, Islamabad, Pakistan
3English Language Department, Preparatory Year Program, University of Dammam, Dammam, Saudi Arabia
Abstract
The study aimed at assessing the Pakistani grade VIII students’ attainment and the factors associated with their performance in science. Secondary analysis of data collected by the National Educational Assessment System (NEAS) from 13371 participants from 742 schools was carried out to investigate these issues. Both OLS linear and multi-level regression analysis revealed that only 9.3% variance can be explained by variables such as student attitudes, parental expectation, time spent on homework, having a desk at home, teacher questioning and school laboratory facilities. More than 90% variance can be attributed to the factors related to provinces, teacher and head-teacher attributes, parent characteristics and some other variables. Only parental expectation of student success shows a significant level 2 school variation. Negative predictors of attainment are family size, extensive text-book coverage, excessive involvement in extra-curricular activities, speaking Punjabi at home, and attending school in Sindh province. Students generally do better in the more developed provinces of the Punjab and the Islamabad Capital Territory. The relatively fewer mixed schools in an otherwise highly segregated system are notable for the under achievement of both boys and girls. From the present study the factors affecting students’ attainment in science were highlighted and it could guide in controlling and manipulating those variables where possible, to improve student achievement in science. Further analysis of the achievement data clearly reveal the effect of mother tongue on students’ performance, and hence implication of using English as a medium of instruction for students’ achievement.
Keywords
Achievement in Science, Contextual Factors, School Variation, Parental Expectation
Received: July 9, 2015
Accepted: August 5, 2015
Published online: August 17, 2015
@ 2015 The Authors. Published by American Institute of Science. This Open Access article is under the CC BY-NC license. http://creativecommons.org/licenses/by-nc/4.0/
1. Introduction
Education in general and science education in particular, plays a significant role not only in the progress and prosperity of an individual but in socio-economic development of the society as well (Krueger & Lindahl, 2001). Science and technology have changed the way of living, thinking and interacting with one another (Hathaway, 2005). Therefore the knowledge of science has become an essential component of school curricula and important element for the nations to succeed in this competing world. Thus, an effective education system has to play a role to equip students with sufficient scientific knowledge and skills which would enable them to participate in the developmental process. In addition to the knowledge of facts and figure, science education is required the scientific skills among students which they need to use in their everyday lives, such as, problem solving, reasoning ability, critical thinking, working cooperatively and effective use of technology. In this backdrop, science education dominates the school subjects and is included in the curriculum as a core component to prepare scientifically literate citizenry. The economic growth of a society is strongly correlated with the availability of technical and scientific work force (Hoffman & Stage, 1993).
Seen in this context, science education in Pakistan neither depicts a vivid picture nor a rich tradition. It may surprise the readers that unlike in many developed countries around the world, science education in Pakistan did not have its place in the primary and elementary school curricula till 1950s (Iqbal & Mahmood, 2000). It was the Commission on National Education (GoP, 1959) that recommended compulsory science education for classes VI-VII. Subsequently, various national education policies (1972, 1979, 1998-2010, 2009), put due emphasis to include science education in national curricula and particularly the New National Education Policy 1979 recommended various measures to popularise science education in the country. Where science education was made part of school curricula, it was taught without any hands on experience to students. In a UNESCO report on Pakistani science education, Chisman (1984) referred to science teaching in the middle schools as pure theory laden with virtually no equipment and with few science rooms or laboratories. This is despite the fact that science curricula in Pakistan is beyond the cognitive reach of students and it needs concrete materials and hands on experiences for students to develop clear understanding of the concepts. With regard to cognitive demand of science analysis by Iqbal &Shayer (1995) reveals that the Grade 8 curriculum either required formal or mature formal operational thinking to develop clear understanding of the concepts. Dogma and rote learning provided the bed-rock in what today remains a woefully under-resourced public system. (Bregman& Mohammad, 1998; Nation, 2009). Teachers and students are driven toward rote learning, as understanding is not possible. This leads to low performance of students in school science when it comes to assessing their conceptual understanding. In an attempt to compare Pakistani students’ performance with international students, Iqbal & Bashir (2006) administered the TIMSS 2003 science test of achievement to Grade 8 students of Punjab province and found that the Pakistani pupils were positioned just above the worst two performing countries of Columbia and South Africa. Testing and assessment in Pakistan are essentially procedures of organised memory recall of factual information at the lowest cognitive level, 'Bloom level 1' (Bloom, 1959; Hill & Tanveer,1990).The rote science taught in the government schools is comparable only in face value content with science as generally recognized (Salahuddin&Salahuddin, 1998).
Research in science education is helpful in improving science education and developing science specialists at all levels. Carrotte (1999) is of the view that it is important to identify factors affecting students’ achievement in science in order to improve their performance. Analysis of research reveals that students’ achievement in science is influenced by a variety of factors which exist both at schools and family level, in addition to individual learner level. Although Pakistan government is trying to provide schools with the needed resources, still there are schools and which are deficient in the required number of trained science teachers, science labs and other physical and human resources.
For a developing nation like Pakistan, science education is a tool and a source of progress and prosperity in this fiercely competing world. Developing and improving science education is the only way to achieve this objective. The objective of science education is to transfer scientific knowledge, develop scientific attitudes, understand natural phenomena and build scientific, logical and critical minds. It is the aim of the science education policy makers to make science teaching more effective to create a positive attitude of students towards learning of science and improve their achievement (Kahle, Meece, &Scantlebury, 2000). Achievements in mathematics and science education are considered very important for national development (Iqbal, 2004). In order to achieve the desired level of science literacy, it is necessary to investigate the factors hindering students’ learning and hence achievement in science at elementary level. The present study explored the factors influencing students’ achievement in science at the elementary level.
2. Method and Procedure
This research is based on the secondary analysis of data collected National Education Assessment System (NEAS) for assessing students’ achievement in various subjects at grade IV and VIII level. In addition to administering achievement tests to students, NEAS also collected background data from the students, parents, teachers and head teachers using three separate instruments. In the present study students achievement data for the subject of science at grade VIII level was used along with the background data. These tests were administered to 13371 students, 7186 males and 6186 females drawn from742 schools spread across Pakistan. In the preliminary analysis frequency distribution of students’ attainment in science and of different contextual variables, were drawn. Multilevel modeling technique was used to analyze the data and partition the variation in students’ attainment in science for different levels (schools and students).
3. Results
The frequency distribution of raw scores from 37 multiple choice items on Grade 8 science topics appear in Figure 1.
Raw scores and contextual data were available from all eight provinces or geographical areas but initially were analysed as a complete population. Breakdowns by contextual variables identified those that were likely to be significant predictors of attainment.
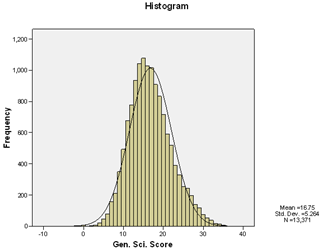
Figure 1. Frequency distribution of raw score in science.
Table 1. Science scores broken down by province.
| Province | N | Mean | Std. Dev. |
| Balochistan | 1560 | 15.94 | 4.63 |
| NWFP | 1867 | 16.31 | 4.94 |
| Punjab | 4233 | 18.65 | 5.69 |
| Sindh | 2095 | 14.41 | 4.88 |
| AJK | 1180 | 16.69 | 4.12 |
| FANA | 1150 | 15.97 | 4.46 |
| FATA | 933 | 15.68 | 4.89 |
| ICT | 353 | 19.23 | 4.59 |
| Total | 13371 | 16.75 | 5.26 |
p<1%, medium effect size
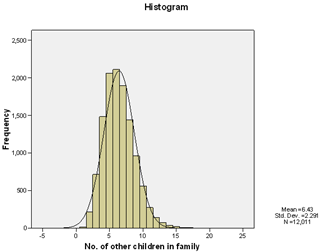
Figure 2. Family size.
The gender difference in attainment, although significant, is negligible in real terms (Cohen, 1998). The apparent under achievement of students in urban schools has a very small effect size. Although most students attend same gender schools, those in mixed schools do less well overall. The underperformance of the mixed schools affects both boys and girls equally.
Families can be very large (Figure 2), with an average of 7.43 children per family. The correlation of science attainment and family size is a significant - 0.10 (N=11937, small effect size). In other words, the larger the family the tendency is for attainment to be lower.
Table 2. Science scores broken down by gender.
| N | Mean | Std. Dev. | |
| Gender | |||
| Male | 7186 | 16.44 | 5.20 |
| Female | 6185 | 17.11 | 5.32 |
| Location | |||
| Rural | 5518 | 17.27 | 5.44 |
| Urban | 7853 | 16.38 | 5.11 |
| School type | |||
| Boys | 6453 | 16.60 | 5.13 |
| Girls | 6092 | 17.14 | 5.33 |
| Mixed | 826 | 15.00 | 5.41 |
| Over all | 13371 | 16.75 | 5.26 |
| Science scores broken down by student gender and school type | |||
| Boys in boys' schools | 6536 | 16.59 ** | 5.15 |
| Boys in mixed schools | 650 | 14.84 ** | 5.41 |
| Girls in girls' schools | 6009 | 17.16 ** | 5.31 |
| Girls in mixed schools | 176 | 15.59 ** | 5.40 |
p<1%, negligible effect size
**p<1%, t test between types of school, small effect size
Students from home where Punjabi is the main language showed greatest attainment (table 3).
Table 3. Science scores broken down by language spoken at home.
| Which language do you generally speak at home? | N | Mean | SD |
| Urdu | 1939 | 17.56 | 5.60 |
| Barahwi | 261 | 15.33 | 4.74 |
| Balochi | 824 | 15.63 | 5.02 |
| Punjabi | 3138 | 18.12 | 5.23 |
| Pashto | 2648 | 16.14 | 4.91 |
| Sindhi | 1171 | 14.44 | 5.05 |
| Saraeki | 833 | 17.77 | 6.06 |
| Kashmiri | 80 | 16.64 | 4.65 |
| Hindko | 614 | 16.46 | 4.59 |
| Persian | 87 | 16.71 | 4.85 |
| Balti | 405 | 16.39 | 4.35 |
| Shena | 484 | 15.85 | 4.51 |
| any other | 483 | 16.05 | 4.46 |
| Total | 12967 | 16.75 | 5.26 |
p<1%, small/medium effect size
The below average performance of students in Sindh is reflected in the scores where Sindhi is the medium of instruction (table 4).
Table 4. Science scores broken down by medium of instruction.
| Medium of instruction | Mean | N | Std. Dev. |
| Urdu | 17.06 | 11091 | 5.26 |
| Sindhi | 14.25 | 1209 | 4.96 |
| Pushto | 14.68 | 50 | 4.20 |
| unknown | 12.36 | 44 | 4.25 |
| Double | 15.72 | 18 | 3.59 |
| Total | 16.76 | 12412 | 5.30 |
p<1%, small effect size
The quality of the home environment is measured by ten items of possible availability of calculator, computer, internet, table/desk, dictionary, map books or atlas, TV, mobile phone, telephone and library or books. Having a calculator and a table/desk for personal use correlate most highly with general science attainment at 0.12 and 0.11 respectively (p<1%, N=13371). In the more affluent homes, taking a car journey to school is associated with higher attainment (table 5), which may be considered as family or socio-economic status.
Table 5. Science scores broken down by travel to school by car.
| N | Mean | Std. Dev. | |
| No car | 11789 | 16.66 ** | 5.19 |
| Car | 1387 | 17.80 ** | 5.58 |
**p<1%, t-test, small effect size
In table 6, the frequency of certain, student-reported, teaching practices on a scale of 1 to 4 are correlated with the science attainment.
Table 6. Correlations of teacher practice with science attainment.
| Teacher practice | R | N |
| Extent of coverage of text-book | 0.109 ** | 12680 |
| Frequency of science homework | 0.038 **n | 12161 |
| Frequency of teacher checking of science homework | 0.130 ** | 12899 |
| Teacher's depth of correction of homework | 0.132 ** | 12935 |
| Allowing students to ask questions (scale 1 to 3) | 0.126 ** | 12815 |
**p<1%, small effect size (n effect size negligible, Cohen, 1988)
Time spent on homework (4-point scale) as judged by the student correlates significantly with science attainment at 0.12 (p<1%, small effect size, N=12561). As judged by the parent, the correlation is 0.10 (p<1%, small effect size, N=12371). The parental and student estimates of homework time correlate at 0.39 (N=11952).
A factor analysis of responses to items referring to extra-curricular activities (scale range 1 to 3) indicated a scale of acceptable reliability (Alpha=0.75, N=9127) for the testing for group differences (table 7) (Youngman, 1979).
The correlation of science attainment scores with extra-curricular activity is negligible. Parental expectation of student success in science (3-point scale) correlates with science attainment significantly at 0.10 for boys (N=6861) and 0.13 for girls (N=5946).
A factor analysis of responses to items referring to liking science (scale range 1 to 3) indicated a scale of barely acceptable reliability (Alpha=0.68, N=10806) for the testing for group differences (table 7) (Youngman, 1979).
Table 7. Liking science scale.
| Item | Corrected Item-Total Correlation |
| I feel pleasure completing any science work. | 0.441 |
| When I get an interesting question of science, I don't give up till I have solved it. | 0.449 |
| I have a natural liking for science. | 0.417 |
| I can complete science work with great success as compared to other student of my age. | 0.385 |
| I feel proud when I solve a difficult question of science. | 0.373 |
| I praise those people a lot who are expert in science. | 0.406 |
The gender difference in Liking science scores is significant but very small (table 8).
Table 8. Liking science scores broken down by gender.
| Gender | N | Mean | Std. Dev. |
| Male | 6111 | 2.641 ** | 0.363 |
| Female | 5331 | 2.696 ** | 0.322 |
**p<1%, t-test, very small effect size
Science attainment correlates significantly with Liking science at 0.13 for boys (N=6074) and 0.11 for girls (N=5300). Table 9 shows that science is most popular in Punjab and AJK.
Table 9. Liking science broken down by province.
| Province | N | Mean | SD |
| Balochistan | 1300 | 2.64 | 0.36 |
| NWFP | 1666 | 2.63 | 0.34 |
| Punjab | 3809 | 2.72 | 0.32 |
| Sindh | 1573 | 2.67 | 0.37 |
| AJK | 1021 | 2.72 | 0.30 |
| FANA | 976 | 2.57 | 0.33 |
| FATA | 784 | 2.59 | 0.36 |
| ICT | 313 | 2.67 | 0.31 |
| Total | 11442 | 2.67 | 0.34 |
p<1%, small effect size
The educational level of the parents has an insignificant association with science attainment. Students whose parents expressed dissatisfaction about the availability of teaching aids scored significantly lower on the science test (table 10).
Table 10. Science scores broken down by dissatisfaction about teaching aids.
| Lack of teaching aids in the school | N | Mean | Std. Dev. |
| Yes | 3398 | 16.16 ** | 4.991 |
| No | 5762 | 17.14 ** | 5.199 |
**p<1%, t-test, small effect size
The dissatisfaction is strongest in FANA and Sindh and weakest in Punjab and ICT.
Table 11. School variables as correlates of student science attainment.
| Item | Scale | Correlation with science score | N |
| Number of library books | 4-point | 0.125 ** | 12618 |
| School enrolment in Grade 8 | continuous | 0.095 ** | 12483 |
| Usable science laboratory | 3-point | 0.091 ** | 12722 |
| Usable library | 3-point | 0.083 ** | 12735 |
| Usable science laboratory and library | 5-point | 0.101 ** | 12662 |
**p<1%
Table 11 shows the influence of several school variables on science attainment. All correlations have a small effect size. The correlations of the availability and usage of teaching kits, guides and textbooks are very small or negligible. Similarly, the social class profile of the students appears to have a negligible effect.
Student personal variables
Research indicate that a variety of students’ personal and home related factors such as gender, family size, home language, availability of learning resources, parental expectation, and students attitude toward/ liking science, all have variable influence on students attainment( Lindahl, 2005).
Linear multiple regression shows that the range of these variables appearing in table 12 is able to explain only 9.3% of the variance of the science attainment scores (the multiple correlation is 0.306). The strongest predictor variable is attending school in the Punjab. Negative influences on science scores are large families, attending a school in Sindh, being a boy, speaking Sindhi or Punjabi at home and engaging in excessive extra-curricular activities.
Table 12. Significant predictor variables for science scores (multiple OLS linear regression) (N=5152).
| Predictor variable | Regression coefficient | Std. error | Variance explained (%) |
| Constant | 9.444 | 0.763 | |
| Attends school in Punjab (scores '1') | 2.046 | 0.224 | 4.1 |
| How much time students spend on homework (scale 1 to 4) | 0.400 | 0.084 | 1.0 |
| Attends school in ICT (scores '1') | 2.406 | 0.428 | 0.8 |
| Liking science (scale 1 to 3) | 1.040 | 0.212 | 0.8 |
| Teachers allow students to ask questions about the subject taught? (scale 1 to 3) | 0.678 | 0.147 | 0.5 |
| Number of family members | - 0.073 | 0.018 | 0.4 |
| School has adequate and usable laboratory (scores '1') | 0.594 | 0.141 | 0.3 |
| Attends school in Sindh (scores '1') | - 0.944 | 0.261 | 0.3 |
| Parents expect their kids to do well in the science subjects (scale 1 to 3). | 0.471 | 0.135 | 0.2 |
| Student gender: Girl '0', boy '1' | - 0.408 | 0.143 | 0.2 |
| How many times teachers check homework (scale 1 to 3) | 0.520 | 0.153 | 0.2 |
| Home language is Punjabi (scores '1') | - 0.851 | 0.233 | 0.1 |
| Extra-curricular activities (scale 1 to 3) | - 0.443 | 0.152 | 0.02 |
| Use of a calculator at home? (scores '1') | 0.358 | 0.140 | 0.1 |
| Home language is Sindhi (scores '1') | - 0.494 | 0.236 | 0.1 |
| Student travels to school by car (scores '1') | 0.434 | 0.220 | 0.0 |
Of 13371 students with science scores, only 4196 have scores on all contextual variables, thus limiting the sample for multi-level regression below even that for linear regression, both of which need comprehensive data for consistent significant testing. (Data for MLWin multi-level must be pre-selected, unlike SPSS).
Table 13. Variance in science scores across three levels.
| Variance attributed to | Variance | Std. error |
| Students | 16.569 | 0.389 |
| Schools | 8.234 | 0.654 |
| Provinces | 1.126 | 0.667 |
A multi-level regression analysis was then conducted for the population of students who had complete scores on all the research variables. The initial 'null' analysis omitted any explanatory variables and tested the three-level design where students were nested within schools and the schools nested within provinces. The result is shown in table 13.
An approximate guide to the significance of the variance contribution is given by the ratio of variance to standard error. The criterion at p<5% is 2.0 (to one decimal place) from a normal curve distribution. From this analysis it is seen that there is no significant effect of the provinces on science scores.
The analysis then proceeded in the form of two-level model. The null analysis without explanatory variables shows that 63.60 % variance in students’ science score is located in students while 36.4% of the variance in schools (table 14).
Table 14. Variance in science scores across two levels in the null model.
| Variance attributed to | Variance | Std. Error |
| Students | 16.575 | 0.390 |
| Schools | 9.503 | 0.725 |
Linear regression suggested that the predictors of science attainment are generally weak. This is confirmed by the multi-level analysis, which used the variables which the original breakdowns of population scores showed had varied significantly with meaningful effect sizes. The eight provinces were entered into the analysis coded 1 or zero as appropriate.
Each variable was entered initially as a fixed parameter, i.e. the coefficient is taken as constant for all students. The variable was retained if its introduction caused a significant fall in the value of the loglikelihood characteristic. The coefficient was then allowed to vary randomly across the schools and tested for significance with loglikelihood characteristic. This level 2 variation would be incorporated into the model if significant.
Table 15 shows the results from the final stage of this process. Only significantly contributing variables are shown to avoid over-complexity for the reader.
The full multi-level model is seen to reduce the variance of the null model (table 14):
· by 0.414 for Level 1 students, or 2.50%;
· by 1.841 for Level 2 schools, or 19.37%, and
· by 2.255 for all three levels, or 8.65%.
Table 15. Coefficients and variances in the full multi-level analysis.
| Parameter | Coefficient | Variance | Std. error |
| Fixed coefficients | |||
| Constant | 16.335 | 0.193 | |
| Student variance in Constant | 16.161 | 0.390 | |
| School variance in Constant | 7.662 | 0.613 | |
| Attending school in Punjab (score 1) | 2.224 | 0.340 | |
| Attending school in Sindh (score 1) | - 1.062 | 0.441 | |
| Attending school in ICT (score 1) | 3.000 | 0.817 | |
| Number of family members, family size (centered on mean) | - 0.044 | 0.008 | |
| Speaking Punjabi at home (score 1) | - 0.579 | 0.235 | |
| Having a desk at home (score 1) | 0.329 | 0.145 | |
| Covering text book content (scale 1 to 4, centred on mean) | - 0.270 | 0.098 | |
| Parents’ expect their children to do well in the science subjects (scale 1 to 3, centered on mean). | 0.450 | 0.139 | |
| Teachers allow students ask questions about the subject taught? (scale 1 to 3, centered on mean) | 0.503 | 0.150 | |
| Time students spend on their homework? (scale 1 to 4, centered on mean) | 0.306 | 0.085 | |
| Extra-curricular activities (scale 1 to 3, centered on mean) | - 0.480 | 0.163 | |
| Liking science (scale 1 to 3, centered on mean) | 0.940 | 0.217 | |
| Random variations: school | |||
| Parents expect their children to do well in the science subjects (scale 1 to 3, centered on mean). | 0.408 | 0.429 |
By explaining an overall 8.65% of variance in attainment scores, the full multi-level model has an effective OLS regression type, multiple-correlation of 0.29 (Luke, 2004:37). The multi-level model is most effective at highlighting the elusiveness of student level predictors of science attainment, while identifying the school as a much stronger determinant of success in general terms of the variables available.
4. Discussion
The success of students in the subject of science is of particular importance for a country like Pakistan because this subject lays the foundation for skilled and technically strong manpower. Therefore it is of utmost importance to put efforts for improving students’ attainment in the subject of science (Ukeje, 1999). In the present study students’ attainment in science at grade VIII level was examined. The influence of number of contextual factors was investigated. These factors were related to students, parents, teachers, school and geographical location.
Analysis of students’ achievement data reveals that the lowest attainment is shown by the students of Sindh province. Further analysis (table 3) indicates that this low performance may be attributed to Sindhi being the home language as well as medium of instruction. Spurlin (1995) has asserted that higher level language proficiency is required for grasping the subjects like science and in which reading and understanding of textbooks is required. If the instructions are in the native language and textbooks and content are not in the same language it could create a barrier towards understanding the science concepts. Short and Spanos (1989) also conclude that under such circumstances students might not develop the clear understanding of the concepts.
The results revealed small and negligible effects of geographical location (rural/urban) and gender on students’ performance in science at this level. Young (1998) reported that students in the rural area have shown lower attainment in the subject of science and attributed it to low academic self-concept among the student of rural areas. However, in this case, rural students performed relatively higher than urban students, though the difference being not significant.Boys’ interest in science was revealed to be higher as compared to the girls and it is also reflected in higher performance of boys as compared to girls.
The effect of family size is found negative on students’ attainment which is in line with other researches (Nuttall, Nuttall, Polit, & Hunter, 1976; Gary, 2006). This result is supported by the effects of home environment variables which revealed that a quality home environment enhances students’ attainment in science. The variables associated with teachers, teaching practices and study habits and involvement in co-curricular activities of students have shown influence on students’ performances in science (Youngman, 1979). Science attainment is directly associated with teaching aids and where parents have shown scarcity of teaching aids facility, lower scores have been indicated. Similarly, the school related variables such as useable library, useable laboratory and enrolment in grade VIII are positively correlated with students’ achievement.
Multiple linear regressions analysis although indicated a range of predictor variables but also revealed that these variables could only explain a little above 9.00 % of the variance, with only one variable attending school in Punjab showing stronger effect. A multilevel regression analysis run on three levels design revealed negligible effect of provinces. Further analysis on two-level model resulted in explanation of much of the variance by students and schools. This final full multilevel model clearly shows that school level variables significantly contribute towards students’ science attainment.
5. Conclusion
In recent years there has been much debate regarding students’ low attainment in general and science and mathematics in particulars. The government has avowed her intention to raise the quality of students leaning in persuasion of Millennium Development Goals (MDGs). It was in this perspective that NEAS was initiated to measure students’ attainment and monitor its progress over the years. Seeing in this context, result of analysis of students’ performance provides valuable information to implement any reform agenda. From the above mentioned results it can be clearly concluded that there are a host of contextual variables that are related to students’ achievement in science at grade VIII level. Some of these variables are related to students (gender, liking of science, study habits etc.), and other related to schools (availability and use of teaching aids, library, laboratory, etc.) In addition to these variables, family size, parental expectations and other family related variables also affect students’ attainment in science in one way or the other. However, the final analysis conclusively indicate that out of all these factors, school and school related factors have strongest influence on students achievement. This analysis provides a valuable insight into the nature of students’ learning and their associated factors and can be used to plan and implement interventions to improve education quality Hence reform agenda must include findings of above analysis and focus on improving school related factors, including provision of missing facilities in schools, recruitment and retention of competent teachers, establishment of school libraries and provision of relevant book, equipping school laboratories and above all empowering teachers to implement student centred teaching, including homework assignment, its assessment and providing corrective feedback to students. To improve science education in the rural areas, more resources should be allocated and parents must be encouraged and motivated to take interest in the wellbeing their children.
Finally, the government and school administration must take realistic decisions with reference to the medium of instruction. Neither use of local regional language nor use of foreign language (English) will enable students to develop conceptual understanding. Use of national language Urdu as medium of instruction for teaching science seems the only viable alternative.
References
- Bloom, B. S. (1959). Taxonomy of educational objectives, Handbook 1: Cognitive Domain. New York: David McKay Co In.
- Bregman, J. & Mohammad, N. (1998) Primary and Secondary Education. In P. Hoodbhoy (ed.) Education and the State. Fifty years of Pakistan (pp.68-101). Karachi: Oxford University Press.
- Carrotte, P. (1999). Turning academics into teachers. In S. Rowland et al. Teaching in Higher Education, 4 (3), 411–14.
- Chisman, D.G. (1984). Pakistan Science Education: Participation and cooperation for Development Programme. Paris: UNESCO.
- Cohen, J. (1988) Statistical power analysis for the behavioral sciences. Hillsdale NJ: Earlbaum.
- Engin-Demir, C. (2009). Factors influencing the academic achievement of the Turkish urban poor. International Journal of Educational Development 29, pp. 17–29.
- Gary, N. M. (2006). Family size, family type, and student achievement: cross national differences and the role of socioeconomic and school factors," Journal of Comparative Family Studies, 37, pp. 1-24.
- Government of Pakistan (1959). Report of the Commission on National Education 1959, Islamabad, Ministry of Education, Islamabad .
- Government of Pakistan (1979). National Education Policy and Implementation Program, 1979, Ministry of Education, Islamabad.
- Hathaway, R. M. (2005) Introduction. In R.M. Hathaway (ed.) Education Reform in Pakistan: Building for the Future pp. 1_14. Washington, DC: International Center for Scholars.
- Hill, J. C. &Tanveer, S. A. (1990) Developing a Program to Improve Science Education in Pakistan: A Six Year Implementation Cycle. Science Education, 74 (2), pp. 241-251.
- Hoffman, K. M., & Stage, E. K. (1993). Science for all: Getting it right for the 21st century. Educational Leadership, 50(5), 27-31.
- Iqbal, H. M. & Bashir, M. (2006) Elementary Students' Achievement in Science: A comparison with TIMSS Results. Science, Technology & Development, Islamabad, 25 (4), pp. 1-6.
- Iqbal, H. M. & Mahmood, N., (2000). Science teacher education in Pakistan: Policies and practices. In Abell, S. K. (Ed). (2000). Science teacher education: An international perspective. London, Kluwer Academic Publishers.
- Iqbal, H. M. (2004) Education in Pakistan Today. Personal communication, University of the Punjab, Lahore.
- Iqbal, H. M., &Shayer, M. (1995). Distribution of Piagetian cognitive levels in middle school students and its match with science curricula. Bulletin of Education and Research, Lahore, XVII–XVIII (1, 2), 42-48.
- Kahle, J. B., Meece, J., &Scantlebury, K. (2000). Urban African American middle school science students: Does standards-based teaching make a difference. Journal of Research in Science Teaching, 37, pp. 1019–1041.
- Krueger, A. and Lindahl, M. (2001). Education and Growth: Why and for Whom? Journal of Economic Literature, 39, 1101-1136.
- Lindahl, M. (2005). Home versus school learning: a new approach to estimating the effect of class size on achievement. Scandinavian Journal of Economics 107 (2), pp. 375–394.
- Luke, D. A. (2004) Multilevel Modeling.Thousand Oaks CA: Sage Publications Inc.
- Nation (2009, September 15) Education in Ruins. The Nation. Editorial. On WWW at http://www.nation.com.pk/E-Paper/Lahore/2009-09-15/page-6.(Accessed 15.10.09).
- Nuttall, E. V., Nuttall, R. L., Polit, D., & Hunter, J. B., (1976). The effects of family size, birth order, sibling separation and crowding on the academic achievement of boys and girls. American Educational Research Journal, 3, pp. 217-223.
- Salahuddin, N. &Salahuddin, I (1998) Reforming medical education. In P. Hoodbhoy (ed.). Education and the State. Fifty years of Pakistan, pp.308-343. Karachi: Oxford University Press.
- Short, D. J. &Spanos, G. (1989). Teaching mathematics to limited English proficient students. Retrieved from www.ericdigests.org/pre-9214/english.htm
- Spurlin, Q. (1995) Making science comprehensible for language minority students. Journal of Science Teachers Education, 6(2), pp. 71-78.
- Ukeje, B. O. (1999). Teacher education in Nigeria: Current status, 21st century challenges and strategies for improvement. Paper presented at the Inter-University Collaborative Workshop on Teacher Education at the University of Jos, Nigeria.
- Young, D. J., (1998). Rural and Urban Differences in Student Achievement in Science and Mathematics: A Multilevel Analysis, School Effectiveness and School Improvement, 9(4), pp. 386 — 418
- Youngman, M. B. (1979) Analysing Social and Educational Research Data. London: McGraw Hill.


