
Advances in Applied Psychology, Vol. 1, No. 1, August 2015 Publish Date: Jul. 21, 2015 Pages: 35-46
Modality Dominance in the Perception of Incongruent Bimodal Emotion Expressions
Barbra Zupan1, *, Duncan R. Babbage2, Joan E. Sussman3
1Department of Applied Linguistics, Brock University, Ontario, Canada
2Auckland University of Technology, Centre for Person Centered Research, Auckland, New Zealand
3Department of Communicative Disorders and Sciences, University at Buffalo, Buffalo, New York, USA
Abstract
We report a preliminary investigation of how perception of congruent and incongruent visual and auditory cues of emotion changes from early childhood to adulthood. Research has shown that for speech perception, children prefer auditory cues whereas adults prefer visual cues. Forty listeners participated, ten in each of the following age groups: preschool, school-aged, early adolescents, and adults. Participants were exposed to a total of 184 semantically neutral sentences (60 congruent visual-auditory) portrayed by one male and female speaker with happy, sad, angry, or fearful emotional expressions. As expected, increased accuracy in identifying the emotion portrayed was seen for congruent stimuli in comparison to incongruent stimuli. Although a clear auditory dominance by preschool children was not indicated, they produced significantly fewer visually-based responses for incongruent visual-auditory signals compared to older children and adults. Explanation for this may include a difference in the salience of visual versus auditory emotion cues for this age group, the limited number of emotion categories included in the current study, and small participant groups.
Keywords
Emotion Processing, Bimodal Processing, Modality Dominance, Dynamic Cues, Incongruent, Children
Received: May 4, 2015
Accepted: June 4, 2015
Published online: July 20, 2015
@ 2015 The Authors. Published by American Institute of Science. This Open Access article is under the CC BY-NC license. http://creativecommons.org/licenses/by-nc/4.0/
Contents
1. Introduction 2. Research Significance 3. Study 1—Stimuli Development 3.1. Method 3.2. Planned Analyses 4. Study 2—Developmental Modality Preferences 4.1. Method 4.2. Data Analysis 4.3. Results 5. Discussion 5.1. Responses to Congruent Stimuli 5.2. Responses to Incongruent Visual–Auditory Combinations of Emotion 5.3. Limitations and Future Directions 6. Conclusion
1. Introduction
Everyday social communication is multi-sensory in nature, with the face and voice seemingly providing the most relevant cues (Ambady & Gray, 2002; Ganesalingam, Sanson, Aderson, & Yeates, 2007; Laukka, Juslin, & Bresin, 2005). When emotional cues provided by the face and voice are congruent with one another, intersensory redundancy occurs, facilitating processing (Dolan, Morris, & de Gelder, 2001; Massaro & Egan, 1996; Pell, 2005). When facial cues conflict with vocal cues, adults automatically integrate the information, as indicated by increased response times (de Gelder & Vroomen, 2000; Massaro & Egan, 1996). How adults integrate conflicting cues in bimodal (i.e., visual-auditory) emotion perception largely depends on the ambiguity of the information within each modality (Collignon et al., 2008; Massaro & Egan, 1996). For instance, Collignon et al. (2008) found that when the reliability of the stimuli was reduced (e.g., addition of noise), adults would rely upon the alternate modality to identify the emotion expression portrayed.
Studies in emotion and general bimodal perception suggest that integration of conflicting bimodal cues may additionally be influenced by modality dominance (Collignon et al., 2008; Napolitano & Sloutsky, 2004; Robinson & Sloutsky, 2007; Sloutsky & Napolitano, 2003; Zupan & Sussman, 2009) Research suggests that young children present with an auditory dominance – that is, when simultaneously presented with auditory and visual cues, the auditory information overshadows the visual information (Robinson & Sloutsky, 2004). Modality dominance has primarily been investigated using non-speech tasks that first habituate participants to a bimodal stimulus. One element of the bimodal stimulus is then changed during test trials and participants are expected to indicate when a change occurs. Participants who primarily note changes in the auditory component of the stimulus are said to have an auditory dominance in perception, while participants who are more likely to note change in the visual component are said to have a visual dominance. Studies of this nature suggest an overall auditory dominance in young children when presented with compound visual-auditory stimuli (Napolitano & Sloutsky, 2004; Nava & Pavani, 2012; Robinson & Sloutsky, 2007; Sloutsky & Napolitano, 2003; Zupan & Sussman, 2009). For instance, Sloutsky and Napolitano (2003) habituated four-year-old children to a compound stimulus consisting of landscape images and computer-generated patterns of three pure tones. Children did not identify changes that occurred in the visual modality, but did identify changes in the auditory component of stimuli. Adults in the Sloutsky and Napolitano (2003) study responded in the opposite direction of children, primarily identifying changes in the visual component of stimuli. Similar studies have also reported a consistent visual dominance in perception for adults, suggesting that this is a robust phenomenon (Robinson & Sloutsky, 2007; Zupan & Sussman, 2009).
Speech perception tasks have also been used to investigate decreasing auditory dominance from childhood to adulthood. These studies likewise show an auditory dominance for young children (McGurk & MacDonald, 1976; Thompson & Massaro, 1994) and a visual dominance for adults (Massaro & Cohen, 1996; McGurk & MacDonald, 1976; Saldana & Rosenblum, 1993). The point at which this developmental shift occurs remains unclear, but results of Nava and Pavani’s (2012) study employing a non-speech task suggests that it occurs before the age of nine. Nava and Pavani explored modality dominance in children through choice reaction tasks that required them to press one button in response to a light, and another in response to a tone. Three age groups were included: 6–7 year olds; 9–10 year olds and 11–12 year olds. Results indicated a consistent auditory dominance for children in the youngest age group across tasks. Visual dominance began to emerge in the 9-10 years olds and was found to be consistent in the 11–12 year olds (Nava & Pavani, 2012).
Modality dominance in children has not been specifically explored in a study of visual-auditory emotion perception. Studies in bimodal perception of emotion with adults report that when both the visual and auditory input is reliable, adults demonstrate a visual preference (Collignon et al., 2008; de Gelder & Vroomen, 2000; Massaro & Egan, 1996). While not specifically investigating modality dominance, Nelson and Russell (2011) recently investigated unimodal and multimodal perception of facial, vocal, and postural emotion expressions by preschoolers. Results of their study suggested that children were better able to identify facial-only emotion expressions than auditory-only ones, and that facial-only identification was similar to performance for multimodal expressions. In other words, preschoolers tended to rely upon the visual cues to interpret emotion expressions, even when additional cues (e.g., auditory ones) were present. These results seem to suggest that the auditory dominance reported for speech and non-speech tasks may not apply to emotion perception for preschoolers. However, since this study did not present children with mismatched cues, we cannot make conclusions about how modality dominance may influence emotion perception in younger children. Gaining a clearer understanding of how children of various ages integrate and interpret bimodal (i.e., visual-auditory) emotion cues is important –we need to learn more about the typical developmental course to inform treatment for children for whom emotion perception is interrupted. Thus, the objective of the current study was to investigate bimodal emotion perception in children from various age groups and adults, and specifically explore whether visual and auditory cues differentially influence their responses.
2. Research Significance
Being able to accurately interpret how someone is feeling allows us to become caring and compassionate people capable of building meaningful relationships with others (Bastian, Burns, & Nettlebeck, 2005; Brackett, Mayer, & Warner, 2004; Elfenbein, Marsh, & Ambady, 2002; Riggio, 2006). For children, it contributes to academic achievement (Riggio, 2006), and for adults, to employment success (Byron, Terranova, & Nowicki, Jr., 2007; Lopes, Grewa, Kadis, Gall, & Salovey, 2006). Difficulties with emotion perception put both children and adults at risk for bullying (Copeland, Wolke, Angold, & Costello, 2013; Woods, Wolke, Nowicki, & Hall, 2009), and contribute to self-esteem issues, loneliness, anxiety, and depression (Pickett, Gardner, & Knowles, 2004;Warnes, Sheridan, Geske, & Earnes, 2005). We need to better understand how emotion perception develops and changes across the lifespan so we can work toward developing social-emotional learning programs to maximize this skill. The results of this study will contribute information on emotion development to the field, by providing important insight into children of various ages, and adults, integrate and interpret emotion expressions.
3. Study 1—Stimuli Development
Study 1 was a pilot phase with the objective to develop stimuli, for the express purpose of their use in Study 2.
3.1. Method
3.1.1. Participants
One male speaker and one female speaker, both aged 20, were recruited. Both were amateur actors from the drama program at the host University of the First Author.
Ten additional participants—2 males, 8 females—were recruited to make judgments verifying whether the speakers had successfully transmitted the intended emotions. Participants in this group of decoders were between the ages of 21 and 53, mean = 28.7, sd = 10.39.
3.1.2. Procedure
Task stimuli for the current study were created using the following procedure. Both speakers produced five semantically neutral sentences in happy, sad, angry and fearful emotional expressions. They produced each sentence three times in each of the four emotional states, for a total of 60 sentences from each speaker. The sentences were all five syllables in length and were chosen from a larger group of sentences used by Robins, Hunyadi and Schultz (2009), who demonstrated that these sentences could be produced in happy, angry, and fearful vocal tones. The five semantically neurtral sentences were:
• Clouds are in the sky.
• It’s dark already.
• The dog is barking.
• The door is open.
• It’s across the street.
The speakers were filmed using a Sony DCR-DVD 108 Handycam digital video camera at a distance of 1.5 meters so that only the head and shoulders were included. The speakers' voices were also recorded using an Olympus DS-30 Digital Voice Recorder with a mouth-to-microphone distance of 10 centimeters. Video and audio recordings were processed using Magix Movie Edit Pro 12 software (Magix Entertainer, 2007). Visual and audio tracks were separated for a total of 120 visual-only stimuli and 120 auditory-only stimuli.
The separated audio and visual stimuli were then presented to the decoders. They performed the verification task using Cedrus SuperLab software (SuperLab, 2012). These participants were seated comfortably in front of a desktop computer with a 17-inch monitor at eye level and BOSE noise-cancelling headphones. One hundred twenty randomized visual-only stimuli were presented, followed by 120 randomized auditory-only stimuli. Participants were instructed to indicate which emotion was portrayed in each clip by pressing the corresponding key on an Ergodex DX-1 input system keyboard. The keyboard contained only four keys, each one-inch apart. Each key contained an emoticon and the corresponding text was in type-faced print below (i.e., picture of a happy face on the key with ‘Happy’ in text below the key).
3.2. Planned Analyses
Responses were analyzed using SPSS Statistics 19. It was planned that responses yielding an identification accuracy of 80% or higher would be selected for further use as task stimuli in the subsequent study.
3.3. Results
Using the specified criteria, 30 congruent stimuli (14 female, 16 male) were selected for further use. In addition, 62 incongruent stimuli (26 female, 36 male) were created for use in Study 2. Due to the stringent 80% accuracy criterion, no examples of fearful from the female speaker were selected for the resulting task stimuli. Decoders also had difficulty identifying the vocal expressions of happy produced by the male speaker, resulting in the inclusion of only two exemplars in the task stimuli.
The audio components of the stimuli were normalized for peak amplitude using Goldwave digital audio editor software (2008) to ensure that the auditory portion of incongruent stimuli would not in some cases be more salient than the visual portion simply because of its amplitude. After this editing, each audio segment was re-combined with its respective original video component using Movie Edit Pro 12 software, resulting in a total of 30 congruent stimuli. Incongruent stimuli were created by combining audio segments expressing one emotion with video segments of the remaining three emotion categories, resulting in a total of 62 stimuli. Lip-audio synchrony was maintained for congruent and incongruent stimuli. Due to the short duration of each segment, this was possible without adjusting rate of the clips. All of the final 92 stimuli were approximately two seconds in duration.
4. Study 2—Developmental Modality Preferences
The objective of Study 2 was to examine how children of various ages and adults were able to identify four categories of emotion expressions when the facial and vocal cues matched (i.e., cues were congruent) and when these cues conflicted with one another (i.e., cues were incongruent). We were most interested in results of the incongruent task since they would provide information regarding whether modality preferences change across the lifespan. Utilizing the stimuli created in Study 1, we examined modality dominance in emotional stimuli identification across the childhood to adulthood developmental course. We presented children at a number of ages and adults with both congruent and incongruent bimodal emotion stimuli, and asked them to identify the emotion portrayed. It was expected that both children and adults would be able to accurately identify the emotion portrayed when the visual and auditory cues were congruent with one another. When faced with incongruent visual and auditory cues of emotion, we hypothesized that older children and adults would place more weight on the information available through the visual channel. We also predicted that the youngest children in the study would be more greatly influenced by information in the auditory channel, but that a shift towards a visual dominance would be evident with increased age.
4.1. Method
4.1.1. Participants
Forty native speakers of North American English, divided into four age groups, participated in the current study: ten preschool children (6 females) ranging in age from 4 years, 5 months to 5 years 10 months (mean = 5.62, sd = 0.83); ten school aged children (6 females) ranging in age from 8 years to 10 years, 4 months (mean = 9.14, sd = 0.71); ten early adolescents (9 females) between the ages of 11 years, 11 months to 12 years, 11 months (mean = 12.41, sd = 0.39) and ten adults (7 females) between 21 and 50 years of age (mean = 33.98, sd = 10.39).
4.1.2. Measures
Vision and hearing. To participate in the study, all participants had to have adequate hearing and visual abilities. Potential participants had to pass a hearing screening at 20dB HL for the octave frequencies 250 and 8000 Hz and pass a vision screening using the Lea Eye Chart at a distance of ten feet.
Speech and language. Children had to show age-appropriate speech and language skills on standardized measures to participate in the experimental task. The Goldman Fristoe Test of Articulation-2 (GFTA-2; Goldman & Fristoe, 2000) was administered to assess spontaneous articulation at the word level. The GFTA-2 has excellent test-retest, inter-rater, and internal reliability (Goldman & Fristoe, 2000). Receptive and expressive language were assessed using the Oral Expression Scale (OES) and Listening Comprehension Scale (LCS) of the Oral and Written Language Skills test (Carrow-Woolfolk, 1995). Both the OES and LCS have correlated well with other measures of receptive and expressive language and have been reported to have good inter-rater and test-retest reliability (Carrow-Woolfolk, 1995). All children demonstrated age-appropriate skills on all speech and language measures.
Affect recognition. The Adult–Faces and Adult–Paralanguage subtests of the Diagnostic Analysis of Nonverbal Accuracy Scale – Second Edition (DANVA-2; Nowicki, 2008) were also administered to all participants to obtain a baseline measurement of facial and vocal affect recognition abilities. Both subtests include 24 emotion expressions, six for each of the following categories: happy, sad, angry, and fearful. This test was chosen as the baseline measurement because it has available normative information for children as young as three and adults upwards of 65 years of age and tests the same four emotion categories included in the task stimuli. The DANVA-2 has been widely used with young children and is reported to have good reliability and validity (Nowicki Jr. & Carton, 1997; Nowicki Jr. & Duke, 1994; S. J. Nowicki & Mitchell, 1998). Because of the normative information and the test’s reported reliability and validity, we opted to assess unimodal emotion perception using this measure instead of isolating unimodal exemplars from our created stimuli.
4.1.3. Procedure
Children who participated in this study attended a total of two sessions. The initial session for all child participants took place in a quiet room either in a university laboratory setting at the first author’s university or at the participant’s home, at their preference. The purpose of the initial session was to complete consent documents and a participant demographic questionnaire, hearing and vision screening, speech and language testing, as well as to collect baseline data using the DANVA-2. Adults attended only one session and completed the consent document, participant questionnaire, vision and hearing screening, and the DANVA-2 prior to completing the experimental task.
The experimental task took place in a university laboratory setting at the first author’s university for all participants. Participants were seated comfortably in front of a desktop computer with a 17-inch monitor at eye level and BOSE noise cancelling headphones. Stimuli were presented and responses were recorded using Cedrus SuperLab software (SuperLab, 2012).
Participants were told that they were going to view video clips and asked to identify what the person was feeling in each clip. They were instructed to make a choice based on the person’s facial expression and tone of voice, rather than the words included in the sentence. They were told that the linguistic content contained in the sentences was neutral and not meant to provide cues about the emotion being portrayed. Instructions were adjusted to be age-appropriate but remained consistent across participants within each age group. Participants were not told, nor were they cued, that the facial and vocal cues portrayed by the speaker did not always match.
Prior to beginning the experimental task, training was completed to familiarize participants with the task. Each participant completed ten training stimuli, five of which were produced by the female speaker. None of these stimuli were included in the experimental task. Of the ten training stimuli, four were congruent and six were incongruent. Participants were not provided feedback during training. The same procedure was used for both the training and experimental tasks.
Following viewing each video clip, participants indicated their response by pressing one of five buttons on an Ergodex DX-1 system input keyboard. There was a 1" space between each of the response buttons. The five possible response choices were happy, sad, angry, fearful and I don’t know. There was a picture icon of the corresponding emotion on each key and a 2" ´ 2" clipart picture (i.e., standard emoticons) that included the emotion word above each key (e.g., a smiling cartoon face for happy with the word "Happy"). These emoticons were included because the youngest children in the study were unable to read. Thus, a visual cue was necessary to remind them which button was associated with which emotion. Emoticons were selected in place of photographs to limit potential bias towards selecting facial cues when presented with incongruent stimuli.
The experimental task consisted of two repetitions as a block of all of the female speaker stimuli and likewise two repetitions as a block of the male stimuli, for a total of 80 stimulus observations of sentences produced by the female speaker (28 congruent, 52 incongruent) and 104 stimulus observations of sentences produced by the male speaker (32 congruent, 72 incongruent). The two blocks of stimuli for each speaker were presented consecutively but the order of presentation (female vs. male) was randomized across participants. Stimuli within each block were also automatically randomized by SuperLab for each participant. Since there were no fearful examples for the female speaker, this choice was removed from the Ergodex DX-1 system during the female blocks, meaning participants were selecting between only four choices for those stimuli.
4.2. Data Analysis
Descriptive statistics were calculated for all demographics and outcome measures. Analyses for the DANVA-2 were completed using z-scores. Mixed model analyses of variance (ANOVA) were conducted to examine affect recognition performance for the congruent stimuli. For the incongruent stimuli, participant responses were first categorized as visual, auditory, or other and the proportion of each type of responses was used within mixed model analyses of variance (ANOVA) to determine group differences in the type of response given.
4.3. Results
4.3.1. Unimodal Facial Affect Recognition
Responses to the Adult Faces and Adult Paralanguage subtests of the DANVA-2 indicated children and adults in the current study were able to process unimodal cues of emotion as expected (see Table 1). No participant scored more than 1.5 standard deviations below their age group normative mean on either DANVA-2 Faces or Paralanguage tasks. Only one participant scored more than 2.0 standard deviations above their age group normative mean—a 12 year old who correctly answered 23/24 paralanguage items, z = 2.55. In short, participant performances indicated typical affect recognition abilities.
Table 1. DANVA–2 subtest performance by group.
| Subtest | Group | Mean | SD | z-score range |
| Adult Faces | Preschool | 15.0 | 2.40 | -0.74 to 1.15 |
| School-aged | 18.0 | 2.00 | -0.90 to 1.38 | |
| Early Adolescence | 18.0 | 2.55 | -1.48 to 1.11 | |
| Adult | 18.6 | 2.54 | -1.48 to 1.08 | |
| Adult Paralanguage | Preschool | 13.4 | 3.10 | -0.46 to 1.53 |
| School-aged | 14.0 | 2.11 | -1.37 to 0.68 | |
| Early Adolescence | 17.1 | 2.51 | -0.55 to 2.55 | |
| Adult | 18.1 | 2.88 | -1.21 to 1.90 |
Note: DANVA2 = Diagnostic Analysis of Nonverbal Accuracy Scale–Second Edition.
Highest possible raw score for both Adult-Faces and Adult-Paralanguage is 24.
z-score ranges reported relative to age-related norms from the standardization study.
4.3.2. Responses to Congruent Stimuli
Congruent stimuli included stimuli portrayed by both the male and female speaker for angry, happy and sad emotion categories, and stimuli portrayed by the male speaker for the fearful emotion category. Prior to conducting analyses of group responses to the congruent stimuli, a 2 × 4 analysis of variance was conducted to determine whether speaker gender impacted responses across the four age groups. No main effect of speaker gender was found, F(1, 36) = 0.008, p = .93, hp2 = .00. Thus, the gender of speaker was not used in subsequent analyses.
A 4 × 4 analysis of variance, with emotion category as a within-subjects factor and age group as a between-subjects factor was conducted to evaluate group differences in the ability to correctly identify the emotion category when given matching visual and auditory cues. Mauchly’s test indicated that the assumption of sphericity had been violated for the main effect of emotion category, c2(5) = 35.57, p < .001. Therefore degrees of freedom were corrected using Greeenhouse-Geisser estimates of sphericity, e=.59. All effects are reported as significant at p < .05 unless otherwise stated. There was a significant main effect of group, F(1,36) = 7.06, p = .001, hp2 = .37, indicating that response accuracy to congruent emotional stimuli differed by age group, regardless of the emotion category. Bonferroni corrected post hoc tests revealed that preschool children provided significantly fewer correct responses to congruent stimuli than early adolescents, p = .01, and adults, p = .001. A significant main effect of emotion category was also found, F(1.78, 63.95) = 24.73, p < .001, hp2 = .41. Bonferroni corrected post hoc tests revealed that participants provided significantly fewer correct responses to fearful stimuli, than to stimuli in the remaining three emotion categories (all p values £ .001). In addition, sad was less well identified than happy, p = .001. Figure 1 depicts the mean proportion of correct responses to each emotion category by age group.
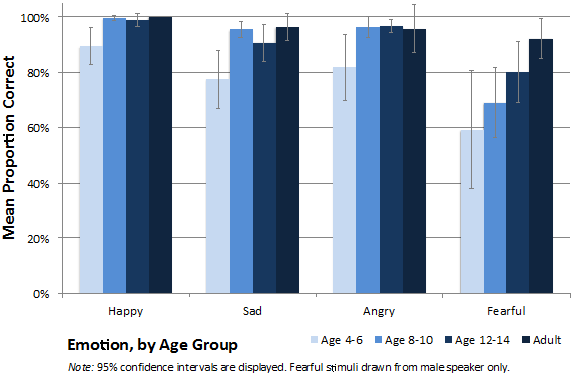
Figure 1. Mean proportion of correct responses for congruent stimuli to each emotion category, by age group.
4.3.3. Responses to Incongruent Stimuli
Participant responses to the incongruent stimuli were categorized as visual, auditory, or other. A visual response included any response consistent with the visual portion of the stimulus. A response was determined to be an auditory response if the participant’s emotion identification was consistent with the auditory portion of the incongruent stimulus. ‘Other’ responses included any responses that were not congruent with either the visual or auditory portion of the stimulus (e.g., fearful in response to the visual-auditory stimulus of angry-happy), excepting the response option of I don’t know. Proportions of auditory, visual and other response types by age group are displayed in Figure 2.
A 4 × 3 × 4 analysis of variance was conducted with emotion category (happy, sad, angry, or fearful in the visual portion of the stimulus) and response type (auditory, visual, other) as within-subjects factors. Age group was the between-subjects factor. Mauchly’s test indicated that the assumption of sphericity had been violated for the main effect of visual emotion category, c2 (5) = 267.14, p < .001, the main effect of response type, c2 (2) = 33.94, p < .001 and for the visual emotion category × response type interaction, c2 (20) = 118.33, p < .001. Therefore degrees of freedom were corrected using Greenhouse-Geisser estimates of sphericity, e=.34 for visual emotion category, .62 for response type and .55 for the interaction. All effects are reported as significant at p < .05.
The ANOVA revealed a significant interaction between response type and group, F(3.70, 44.42) = 6.17, p = .001, hp2 = .34. There was also a significant main effect of response type, F(1.23, 44.42) = 421.88, p < .001, hp2 = .92 but no main effect of emotion, F(1.03, 36.98) = .22, p = .88, hp2 = .006. As seen in Figure 3, these results reflect the tendency for children in the youngest age group to provide fewer visual responses than the remaining three age groups, regardless of the emotion portrayed in the visual portion of the stimulus.
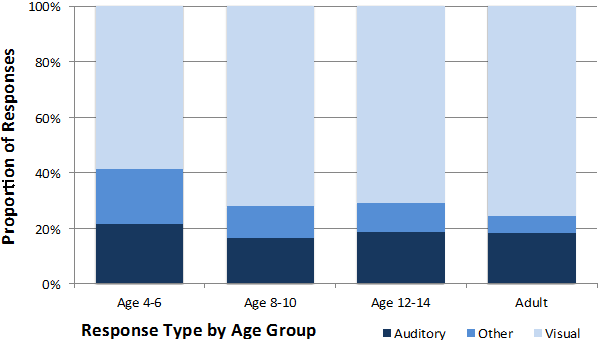
Figure 2. Proportions of auditory, visual and other response types by age group.
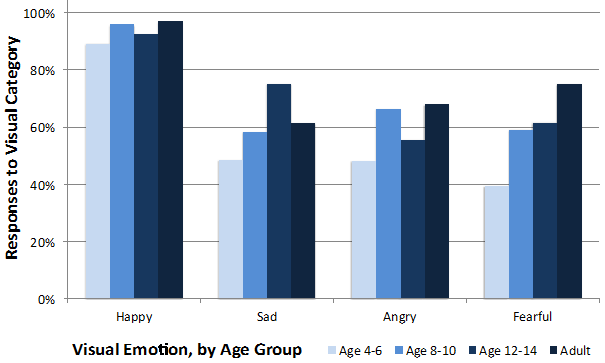
Figure 3. Visual responses by age group for emotions portrayed in the visual portion of the stimulus.
5. Discussion
The current study aimed to extend previous research in bimodal emotion perception by comparing responses to congruent and incongruent expressions by children and adults. Specifically, we wanted to explore whether the modality dominance reported in the literature for non-emotional stimuli would also be present for incongruent emotion expressions. As predicted, a developmental increase in response accuracy for stimuli that portrayed congruent visual and auditory expressions of emotion (e.g., happy face paired with happy voice) was found. However, our hypothesis regarding the influence of modality dominance on the perception of incongruent emotion expressions (e.g., happy face paired with angry voice) was only partially supported. We had predicted that preschool and school aged children would provide responses that were consistent with the auditory portion of the stimulus, while early adolescents and adults were expected to rely on the visual portion. Although an increase in visual-based responses was found with increasing age, a clear auditory dominance was not evident.
5.1. Responses to Congruent Stimuli
Accurate perception and interpretation of facial and vocal cues of emotion have been shown to continue to develop as children mature (Batty & Taylor, 2006; Boyatzis, Chazan, & Ting, 1993; Herba, Landau, Russell, Ecker, & Phillips, 2006; Vicari, Reilly, Pasqualetti, Vizzotto, & Caltagirone, 2000). The children who participated in the current study were no exception, with preschool children showing the greatest error in identification of all four emotion categories, and adults showing the least amount of error overall.
To our knowledge, this is the first study to compare performance across distinct age groups in response to bimodal stimuli that include dynamic facial expressions, rather than static ones. A pattern of emotion recognition emerged in the results for identification of congruent stimuli, with happy being most easily recognized by all age groups, followed by angry, sad, and fearful. The high recognition of happy by all age groups was not surprising given the literature in decoding of facial expressions, which reports this emotion to be the first emotion consistently identified by children (Boyatzis et al., 1993; Vicari et al., 2000; Widen & Russell, 2008). In addition, happy has been reported as the most universally recognized emotion in the face (Keltner & Ekman, 2000). Finally, happy was the only positive emotion included in the current study. Not only has positive emotion classification been shown to lead to faster processing and more accurate identification than negative emotions (Batty & Taylor, 2006; Leppänen & Hietanen, 2004), response accuracy was also likely influenced by the inclusion of only a single positive emotion category in fixed choice options. Participants in the current study found bimodal congruent emotion expressions portraying angry easier to identify than sad ones. Since studies investigating identification of unimodal facial expressions typically report sad as more accurately recognized than angry, this finding suggests that the auditory portion of the stimulus was indeed influencing perception, particularly by children (Vicari et al., 2000). Fearful was the emotion that seemed to be the most difficult to identify for all participants. This is likely because of the four emotions included in the current study, fearful is reportedly the most difficult to identify in both the face (Boyatzis et al., 1993; Herba et al., 2006; Widen & Russell, 2008) and voice (Johnstone & Scherer, 2000; K. R. Scherer, Banse, Wallbott, & Goldbeck, 1991). Fearful also tends to be less common in everyday experiences than the other emotions included in the current study (Batty & Taylor, 2006)and thus, all participants experience that emotion less frequently.
5.2. Responses to Incongruent Visual–Auditory Combinations of Emotion
As previously noted, our primary hypothesis regarding the influence of modality dominance on the identification of incongruent visual-auditory combinations of emotion was not fully supported. However, results did show that preschool children provided significantly fewer visual responses than participants in the remaining three age groups. Thus, preschool children in the current study appeared to be less influenced than older participants by the visual cues provided in the facial expressions of emotion. The first explanation for this result may not be one of auditory dominance, but rather one of developmental differences in the processing of unimodal cues. In general, both children and adults are more accurate at identifying emotional cues expressed in the face than in the voice (Nelson & Russell, 2011; Nowicki Jr. & Duke, 1994) and the participants in the current study were no different. This is evident in their scores on the DANVA-2 Adult Faces and Adult Paralanguage subtests (see Table 1). From this perspective, we might describe responses provided by preschool children as being driven by developmental differences in emotion perception rather than differences in modality dominance in processing per se. Unlike preschool children, the remaining three age groups were able to identify the face in unimodal conditions at least 75% of the time—thus, they may have relied more on the visual portion of the stimulus simply because it was easier to identify—whereas preschool children alternated between visual, auditory and other responses depending on the combination of emotions presented in the visual-auditory stimulus. Arguing against this interpretation, however, is the response pattern of school aged children. If we consider only unimodal accuracy, we would have expected school aged children to have the greatest number of visual responses overall given the discrepancy between their scores on the DANVA-2 Adult Faces and Adult Paralanguage subtests. Since this did not occur, modality dominance also needs to be considered in interpreting the response patterns we observed.
If young children do in fact prefer auditory information in processing, they would certainly be less likely to provide visually-based responses to incongruent visual-auditory stimuli, as was observed. Although the modality dominance perspective for young children has been clearly supported in studies employing speech and non-speech tasks with children (Nava & Pavani, 2012; Robinson & Sloutsky, 2007; Sloutsky & Napolitano, 2003; Zupan & Sussman, 2009), it has not yet been considered with affective stimuli. An auditory dominance in processing in the form of auditory-based responses may be less explicit in response to emotional visual-auditory stimuli due to the complexity and reduced cue validity of the acoustic parameters that differentiate emotional tones of voice (Quam & Swingley, 2012). Although general patterns of acoustic cues have been suggested, a specified pattern for each of the emotion categories used in the current study does not yet exist (Banse & Scherer, 1996; Russell, Bachorowski, & Fernandez-Dols, 2003; K. R. Scherer et al., 1991; K. Scherer, 2003; Sobin & Alpert, 1999; Zupan, Neumann, Babbage, & Willer, 2009). Quam and Swingley (2012)report that young children are unable to consistently differentiate happy and sad on the basis of acoustic cues, even though these two emotions significantly differ from one another (Russell et al., 2003). Furthermore, research investigating children’s use of acoustic versus linguistic information within a conflicting auditory message have consistently reported that children place greater weight on the linguistic content of the message (Friend & Bryant, 2000; Friend, 2000; Morton, Trehub, & Zelazo, 2003; Morton & Trehub, 2001; Waxer & Morton, 2011). Given this, it is possible that children in the present study were focusing on the linguistic content of the message, even though they were instructed not to, resulting in the lack of a clear modality dominance. Alternatively, our youngest participants may have been more influenced by the visual modality than in studies of speech perception because facial emotion expressions have more distinct and universal configurations (Ekman & Friesen, 1978; Ekman et al., 1987; Ekman, Friesen, & Ancoli, 1980; Friesen & Ekman, 1983), making these cues more easily recognizable.
In our participants response type differed significantly by group, but this difference was not dependent on which emotion appeared in the visual portion of the visual-auditory stimulus. This result was surprising given that previous studies in modality dominance employing non-speech tasks have shown flexible modality dominance in young children, depending on the complexity of the stimulus in the visual portion of the visual-auditory combination (Napolitano & Sloutsky, 2004; Robinson & Sloutsky, 2007; Sloutsky & Napolitano, 2003). For instance, in the Sloutsky et al. studies (Napolitano & Sloutsky, 2004; Robinson & Sloutsky, 2007; Sloutsky & Napolitano, 2003) preschool children showed a clear auditory dominance in processing. They seemed unaware of the visual stimulus in visual-auditory combinations when the visual stimuli included either a landscape picture or a sequence of three geometric shapes. However, when the visual stimulus in the visual-auditory combination was simplified to include a single geometric shape, preschool children not only became aware of the visual stimulus, but showed a visual dominance in processing (Napolitano & Sloutsky, 2004). In the current study, happy could be considered the least complex of the four emotions for a variety of reasons. First, happy was the emotion most easily identified in congruent stimuli by all participants. In addition to its early occurrence in development, happy also commonly occurs in daily environments, making it more familiar. Given this, we assumed that when happy appeared in the visual portion of the stimulus, the expected auditory dominance in young children would not occur, and instead a visual dominance would emerge. Additionally, we expected to see a greater number of auditory responses by preschool children when fearful appeared in the visual portion of the visual-auditory stimulus, since this emotion would be considered the most complex of the four, using the same criteria used for happy. Although not significant, examination of responses across age groups did in fact show this trend (see Figure 3). The extent to which the modality a specific emotion is presented influences the perception of an incongruent emotion expression awaits further study with more extensive stimuli and larger participant groups.
5.3. Limitations and Future Directions
To our knowledge, this study is the first to investigate the role of modality dominance in the processing of affective stimuli for preschool children and the first to show a developmental shift in the number of visual responses provided. Although these findings are novel, they are restricted by the small number of participants included in each age group, a primary limitation of the current study. Additionally, the use of just one female and one male speaker is also restrictive in terms of generalization of these results. Future studies of this nature should include emotions portrayed by a greater number of speakers and perhaps speakers of similar ages to participants, since the social settings in which everyday processing of emotions occur would likely include peers. Indeed, children have been reported to provide more accurate responses when emotion representations are presented by other children (Wocadlo & Rieger, 2006). Gender of the speaker and gender of the viewer have also been reported to interact (Boyatzis et al., 1993; Hess, Adams, & Kleck, 2004). Thus, larger participant groups more equal in gender should also be considered for future studies of this nature. Investigating how verbal content interacts with visual and auditory cues of emotion would also be of value.
The current study investigated only four of the basic emotions. Of the emotions included, sad is the only emotion typically associated with decreases in the vocal and facial cues (e.g., reduced loudness in voice, reduced tension in face) and happy is the only emotion classified as positive in valence. Participants may have been using these dimensions to assist them identifying the emotion portrayed. In order to eliminate this potentially confounding factor in the perception of incongruent emotion expressions, future studies could include a wider range of emotion categories. Similarly, in hind sight, the fear icon should have remained on the key pad for the blocks of trials including the female speaker since eliminating this icon made the task simpler due to the decreased number of competing negatively valenced emotions.
The stimuli used in Study 2 also lacked unimodal exemplars, a substantial limitation to the generalization of our results. Unimodal exemplars were not included in the experimental task due to the already large number of stimuli needed to capture all visual–auditory combinations by the male and female speakers. We were conscious of balancing experimental design with potential participant fatigue and attention, particularly for the preschool children. To ensure attention was maintained throughout the already lengthy task, congruent stimuli were interspersed among incongruent stimuli. Results were as expected for these trials, indicating that children were not randomly responding. However, future studies of this nature could include unimodal, congruent, and incongruent trials from the same speakers to further investigate the relationship between developmental emotion perception and modality preferences in bimodal processing of emotion.
6. Conclusion
The research outlined in this paper did not demonstrate an explicit auditory dominance in preschool children in the form of auditory-based responses to incongruent visual-auditory stimuli. However, the preschool children in the current study did have significantly fewer visually-based responses than older children and adults, lending some support to an auditory dominance in processing for this age group in response to affective stimuli. Although results support the developmental increase in the influence of the visual modality reported in the literature (Colavita, 1974; McGurk & MacDonald, 1976; Nava & Pavani, 2012; Robinson & Sloutsky, 2007; Thompson & Massaro, 1994; Zupan & Sussman, 2009), the influence seems less marked in response to visual and auditory cues of emotion. Differences in the salience of visual versus auditory cues of emotion expressions may partially account for the lack of a clear auditory dominance in the preschool children in the current research. Developmental differences in emotion perception, as seen in response accuracy to congruent emotion stimuli, may also have contributed to our findings. Thus, preschool children were perhaps not only influenced by modality dominance when processing incongruent visual-auditory affective stimuli, but also by their understanding of the cues associated with visual and auditory representations of happy, sad, angry and fearful.
References
- Ambady, N., & Gray, H.M. (2002). On being sad and mistaken: Mood effects on the accuracy of thin-sliced judgments. Journal of Personality and Social Psychology, 83(4), 947-961.
- Banse, R., & Scherer, K. R. (1996). Acoustic profiles in vocal emotion expression. Journal of Personality and Social Psychology, 70(3), 614–36. Retrieved from http://www.ncbi.nlm.nih.gov/pubmed/8851745
- Bastian, V.A., Burns, N.R., & Nettlebeck, T. (2005). Emotional intelligence predicts life skills, but not as well as personality and cognitive abilities. Personality and Individual Differences, 39, 1135-1145.
- Batty, M., & Taylor, M. J. (2006). The development of emotional face processing during childhood. Developmental Science, 9(2), 207–20. doi:10.1111/j.1467-7687.2006.00480.x
- Boyatzis, C. J., Chazan, E., & Ting, C. Z. (1993). Preschool children’s decodign of facial emotions. The Journal of Genetic Psychology: Research and Theory on Human Development, 154, 375–382.
- Brackett, M.A., Mayer, J.D., & Warner, R.M. (2004). Emotional intelligence and its relation to everyday behavior. Personality and Individual Differences. 36, 1387-1402.
- Byron, K., Terranova, S., & Nowicki, Jr., S. (2007). Nonverbal emotion recognition and salespersons: Linking ability to perceived and actual success. Journal of Applied Social Psychology, 37(11), 2600-2619.
- Carrow-Woolfolk, E. (1995). OWLS: Oral and Written Language Scales. Minneapolis, MN: Pearson Assessments.
- Collignon, O., Girard, S., Gosselin, F., Roy, S., Saint-Amour, D., Lassonde, M., & Lepore, F. (2008). Audio-visual integration of emotion expression. Brain Research, 1242, 126–35. doi:10.1016/j.brainres.2008.04.023
- Copeland, W.E., Woke, D., Angold, A., & Costello, E.J. (2013). Adult psychiatric outcomes of bullying and being bullied by peers in chidlhood and adolesence. JAMA Psychiatry, 70(4), 419-426.
- De Gelder, B., & Vroomen, J. (2000). The perception of emotions by ear and by eye. Cognition & Emotion, 14(3), 289–311. doi:10.1080/026999300378824
- Dolan, R. J., Morris, J. S., & de Gelder, B. (2001). Crossmodal binding of fear in voice and face. Proceedings of the National Academy of Sciences of the United States of America, 98(17), 10006–10. doi:10.1073/pnas.171288598
- Ekman, P., & Friesen, W. V. (1978). Facial affect coding system: A technique for the measurement of facial movment. Palo Alto, CA: Consulting Psychologists Press.
- Ekman, P., Friesen, W. V, & Ancoli, S. (1980). Facial signs of emotional experience. Journal of Personality and Social Psychology, 39(6), 1125–1134.
- Ekman, P., Friesen, W. V, Sullivan, M. O., Diacoyanni-tarlatzis, I., Scherer, K., Chan, A., … Krause, R. (1987). Universals and Cultural Differences in the Judgments of Facial Expressions of Emotion. Personality Processes and Individual Differences, 5(4), 712–717.
- Elfenbein, H.A., Marsh, A.A., & Ambady, N. (2002). Emotional intelligence and the recognition of emotion from facial expressions. In L.F. Barrett & P. Salovey (Eds.), The Wisdom in Feeling: Psychological Processes in Emotional Intelligence (pp. 37-59). New York: Guilford Press.
- Friend, M. (2000). Developmental changes in sensitivity to vocal paralanguage. Developmental Science, 3(2), 148–162. doi:10.1111/1467-7687.00108
- Friend, M., & Bryant, J. B. (2000). A development lexical bias in the interpretation of discrepant messages. Merrill-Palmer Quarterly, 46, 342–369.
- Friesen, W. V, & Ekman, P. (1983). EMFACS-7: Emotional Facial Affect Coding System (Unpublishe.). University of California, CA.
- Ganesalingam, K., Sanson, A., Aderson, V., & Yeates, K.O. (2007). Self-regulation as a mediator of the effects of childhood traumatic brain injury on social and behavioral functioning. Journal of the International Neuropsychological Society, 13(2), 298-311.
- Goldman, R., & Fristoe, M. (2000). Goldman Fristoe Test of Articulation-2. Circle Pines, MN: American Guidance Service (AGS).
- Goldwave Digital Audio Editor. (2008). St. John’s, NFLD: Goldwave, Inc.
- Herba, C. M., Landau, S., Russell, T., Ecker, C., & Phillips, M. L. (2006). The development of emotion-processing in children: effects of age, emotion, and intensity. Journal of Child Psychology and Psychiatry, and Allied Disciplines, 47(11), 1098–106. doi:10.1111/j.1469-7610.2006.01652.x
- Hess, U., Adams, R. B., & Kleck, R. E. (2004). Facial appearance, gender, and emotion expression. Emotion (Washington, D.C.), 4(4), 378–88. doi:10.1037/1528-3542.4.4.378
- Johnstone, T., & Scherer, K. R. (2000). Vocal communication of emotion. In The Handbook of Emotion (pp. 22–235).
- Keltner, D., & Ekman, P. (2000). Facial expression of emotion. In M. Lewis & J. M. Haviland-Jones (Eds.), Handbook of Emotions. New York: Guilford Press.
- Laukka, P., Juslin, P., & Bresin, R. (2005). A dimensional approach to vocal expressions of emotion. Cognition & Emotion, 19(5), 633-653.
- Leppänen, J. M., & Hietanen, J. K. (2004). Positive facial expressions are recognized faster than negative facial expressions, but why? Psychological Research, 69(1-2), 22–9. doi:10.1007/s00426-003-0157-2
- Lopes, P.N., Grewa, D., Kadis, J., Gall, M., & Salovey, P. (2006). Evidence that emotional intelligence is related to job performance and effect and attitudes at work. Psichotherma, 18, 132-138.
- Magix Entertainer. (2007). Movie Edit Pro 12.
- Massaro, D. W., & Cohen, M. M. (1996). Perceiving speech from inverted faces. Perception and Psychophysics, 58(7), 1047–1065.
- Massaro, D. W., & Egan, P. B. (1996). Perceiving affect from the voice and the face. Psychonomic Bulletin & Review, 3(2), 215–221.
- McGurk, H., & MacDonald, J. (1976). Hearing Lips and Seeing Voices. Nature, 264.
- Morton, J. B., & Trehub, S. E. (2001). Children’s Understanding of Emotion in Speech. Child Development, 72(3), 834–843. doi:10.1111/1467-8624.00318
- Morton, J. B., Trehub, S. E., & Zelazo, P. D. (2003). Sources of inflexibility in 6-year-olds’ understanding of emotion in speech. Child Development, 74(6), 1857–68. Retrieved from http://www.ncbi.nlm.nih.gov/pubmed/14669900
- Napolitano, A. C., & Sloutsky, V. M. (2004). Is a picture worth a thousand words? The flexible nature of modality dominance in young children. Child Development, 75(6), 1850–1870.
- Nava, E., & Pavani, F. (2012). Changes in Sensory Dominance During Childhood: Converging Evidence From the Colavita Effect and the Sound-Induced Flash Illusion. Child Development, 00(0), 1–13. doi:10.1111/j.1467-8624.2012.01856.x
- Nelson, N. L., & Russell, J. a. (2011). Preschoolers’ use of dynamic facial, bodily, and vocal cues to emotion. Journal of Experimental Child Psychology, 110(1), 52–61. doi:10.1016/j.jecp.2011.03.014
- Nowicki Jr., S., & Carton, E. (1997). The relation of nonverbal processing ability of faces and voices and children’s feelings of depression and competence. The Journal of Genetic Psychology, 158(3), 357–363.
- Nowicki Jr., S., & Duke, M. P. (1994). Individual Differences in the Nonverbal Communication of Affect: The Diagnostic Analysis of Nonverbal Accuracy Scale. Journal of Nonverbal Behavior, 18(I), 9–35.
- Nowicki, S. (2008). The Manual for the Receptive Tests of the Diagnostic Analysis of Nonverbal Accuracy 2 (DANVA2). Atlanta, GA: Department of Psychology, Emory University.
- Nowicki, S. J., & Mitchell, J. (1998). Accuracy in Identifying Affect in Child and Adult Faces and Voices and Social Competence in Preschool Children. Genetic, Social & General Psychology, 124(1).
- Pell, M. D. (2005). Nonverbal Emotion Priming: Evidence from the Facial Affect Decision Task. Journal of Nonverbal Behavior, 29(1), 45–73. doi:10.1007/s10919-004-0889-8
- Pickett, C.L, Gardner, W.L., & Knowles, M. (2004). Getting a cue: The need to belong and enhanced sensitivity to social cues. Personality and Social Psychology Bulletin, 30, 1095-1107.
- Quam, C., & Swingley, D. (2012). Development in children’s interpretation of pitch cues to emotion. Child Development, 83(1), 236–250.
- Riggio, R.E. (2006). Nonverbal skills and abilities. In V. Manusov & M. Patterson (Eds.). Handbook of Nonverbal Communication. Thousand Oaks, CA: Sage Press.
- Robinson, C. W., & Sloutsky, V. M. (2004). Auditory Dominance and Its Change in the Course of Development. Child Development, 75(5), 1387–1401.
- Robinson, C. W., & Sloutsky, V. M. (2007). Visual processing speed: effects of auditory input on visual processing. Developmental Science, 10(6), 734–40. doi:10.1111/j.1467-7687.2007.00627.x
- Russell, J. a, Bachorowski, J.-A., & Fernandez-Dols, J.-M. (2003). Facial and vocal expressions of emotion. Annual Review of Psychology, 54, 329–49. doi:10.1146/annurev.psych.54.101601.145102
- Saldana, H. M., & Rosenblum, L. D. (1993). Visual influences on auditory pluck and bow judgment. Perception & Psychophysics, 54, 406–416.
- Scherer, K. (2003). Vocal communication of emotion: A review of research paradigms. Speech Communication, 40(1-2), 227–256. doi:10.1016/S0167-6393(02)00084-5
- Scherer, K. R., Banse, R., Wallbott, H. G., & Goldbeck, T. (1991). Vocal cues in emotion encoding and decoding. Motivation and Emotion, 15(2), 123–148. doi:10.1007/BF00995674
- Sloutsky, V. M., & Napolitano, A. C. (2003). Is a Picture Worth a Thousand Words? Preference for Auditory Modality in Young Children, 74(3), 822–833.
- Sobin, C., & Alpert, M. (1999). Emotion in Speech : The Acoustic Attributes of Fear, Anger, Sadness, and Joy. Journal of Psycholinguistic Research, 28(4), 347–365.
- SuperLab. (2012). SuperLab Version 5. San Pedro, CA: Cedrus Corporation.
- Thompson, L. A., & Massaro, D. W. (1994). Children’s integration of speech and pointing gestures in comprehension. Journal of Experimental Child Psychology, 57(327-354).
- Vicari, S., Reilly, J. S., Pasqualetti, P., Vizzotto, a, & Caltagirone, C. (2000). Recognition of facial expressions of emotions in school-age children: the intersection of perceptual and semantic categories. Acta Paediatrica (Oslo, Norway : 1992), 89(7), 836–45. Retrieved from http://www.ncbi.nlm.nih.gov/pubmed/10943968
- Warnes, E.D., Sheridan, S.M., Geske, J., & Warnes, W.A. (2005). A contextual approach to the assessment of social skills: Identifying meaningful behaviors for social competence. Psychology in the Schools, 42(2), 173-187.
- Waxer, M., & Morton, J. B. (2011). Children’s judgments of emotion from conflicting cues in speech: Why 6-year-olds are so inflexible. Child Development, 82(5), 1648–1660.
- Widen, S. C., & Russell, J. a. (2008). Children acquire emotion categories gradually. Cognitive Development, 23(2), 291–312. doi:10.1016/j.cogdev.2008.01.002
- Wocadlo, C., & Rieger, I. (2006). Social skills and nonverbal decoding of emotions in very preterm children at early school age. European Journal of Developmental Psychology, 3(1), 48–70.
- Woods, S., Woke, D., Nowicki, S., & Hall, L. (2009). Emotion recognition abilities and empathy of victims of bullying. Child Abuse & Neglect, 33, 307-311.
- Zupan, B., Neumann, D., Babbage, D. R., & Willer, B. (2009). The importance of vocal affect to bimodal processing of emotion: implications for individuals with traumatic brain injury. Journal of Communication Disorders, 42(1), 1–17. doi:10.1016/j.jcomdis.2008.06.001
- Zupan, B., & Sussman, J. E. (2009). Auditory preferences of young children with and without hearing loss for meaningful auditory-visual compound stimuli. Journal of Communication Disorders, 42(6), 381–96. doi:10.1016/j.jcomdis.2009.04.002


