
American Journal of Social Science Research, Vol. 2, No. 3, June 2016 Publish Date: Oct. 19, 2016 Pages: 29-33
The Adaptation of MEFOSEP Intervention on Improving Food Production Among Farmers in Bar "A" Sub Location, Kisumu County
Samuel Jerry Odindo1, *, Aaron Mwayi2, Dan Odindo1, Winnie Otieno3, Caro Akinyi4, Jeremy Nzanzu4, Noah Adera5
1Department of Health System Management, Faculty of Community Health and Development, Great Lakes University of Kisumu, Kisumu, Kenya
2Department of Health Promotion, Faculty of Community Health and Development, Great Lakes University of Kisumu, Kisumu, Kenya
3Department of Environmental Health, Faculty of Community Health and Development, Great Lakes University of Kisumu, Kisumu, Kenya
4Department of Research and Measurement, Faculty of Community Health and Development, Great Lakes University of Kisumu, Kisumu, Kenya
5Programming, Data Management and Analysis, Monitoring and Evaluation Food Security Programme, Kisumu, Kenya
Abstract
This is a Monitoring and Evaluation research that monitored the same households for the second seasons and displayed the information to the farmers on a noticeboard as a way of sensitizing them on good farm management practices. Key findings were analyzed and used to determine the quarterly Adoption-Trend’s depicted from the harvest quantities, the impact of the noticeboard intervention on the harvest, to compare the Seasonality on Adoption (CAN quantities used) - Dry verse Wet seasons, to evaluate Storage and usage of the harvest in relation to the food security and to compare the effects of intervention in relation to the Kisumu regional harvest. Census was done for the 570 households. Frequency was run using SAS and STATA and Chi square test to determine the associations of farmindicators, such as quantity of fertilizer and seeds application on the production of maize, beans, groundnuts and vegetables. Descriptive analysis was conducted to determine and compare the harvest in the intervention sites to the rest of the place in Kisumu where the intervention was not affected. Logistic regression analysis was used to determine the significant influence of the variables on the production of monitored food crops. Comparative analysis was used to test the null hypothesis on the statistic significant between first season and second season.
Keywords
Monitoring Food Security, Information Asymmetry, Food Production, Target Plan
Received: June 22, 2016
Accepted: July 29, 2016
Published online: October 19, 2016
@ 2016 The Authors. Published by American Institute of Science. This Open Access article is under the CC BY license. http://creativecommons.org/licenses/by/4.0/
Contents
1. Introduction
MEFOSEP program strives toboostagriculture (farming) in its areas of operation. Adoption is defined as the proportion of farmers using the information on the noticeboard installed next to their area to sensitize them on good farm management practices. As part of adoption boosting, the program has recently conducted a farm to farm campaign with the purpose of increasing awareness and ultimately usage of good farming practices for maximum harvest. The intervention was implemented in the Bar "A"sublocation, Kisumu district in October 2015 through a combination of radio shows and noticeboard display. The intervention was focused on maize, beans, groundnuts and kales production with keen interest taken on maize farming since it was carried out by ALL the farmers who were participating in the study.
Indeed, a qualitative research project conducted in July 2015 (post-harvest) aimed at investigating the gap between awareness of the good farming practices and usage of the same indicated that the noticeboard displays and radio talk shows would likely be effective in accessing farmers in the region.
1.1. Study Design and Sampling Plan
This was a longitudinal study that monitored households for a long period of time. It was treated as a census type study and therefore all the farmers in Bar "A"sublocation, Kisumu District were enrolled to participate in the study.
1.2. Objectives
1. To determine the quarterly Adoption-Trend (as depicted from the harvest quantities)
2. To assess the impact of the noticeboard intervention on the harvest
3. To compare the Seasonality on Adoption (CAN quantities used) - Dry vs Wet seasons
4. To evaluate Storage and usage of the harvest in relation to the food security
5. To compare the effects of intervention in relation to the Kisumu regional harvest
1.3. Key Findings
• The proportion of farmers benefiting from the noticeboard display as a major source of information on good farm management practicesand foodsecurityis high as it is depicted from the harvest results
• A majority of farmers report to have received majority of information fromradio talk shows
• Most residents (90.35%) reported the radio campaign to have improved their farming habits
• After the campaign, maize harvestaverages in Bar "A"rose by 19.35%
• The increase should be treated cautiously as it cannot be entirely attributed to the noticeboard displays and the radio talk show interventions
• Average harvest figures for entire Bar "A"sublocation, Kisumu also improved by 7% over the same duration (according to national figures on Agricultural production).
1.4. Narrative Findings
Quarterly Adoption in terms of the farm inputs (DAP)
The 2015 adoption (DAP fertilizer) was 15.69% in Bar "A". All across 2015 adoption rates seem to be increasing.
Table 1. Adoption of CAN quantity for both wet and dry season.
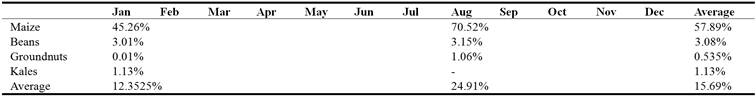
Seasonality on Adoption in terms of farm inputs (CAN) - Dry vs Wet seasons.
Table 2. Adoption does not differ depending on the seasons.
2. Results
2.1. Household Food Security Surveys
Acreage ploughed Information for the cash crops
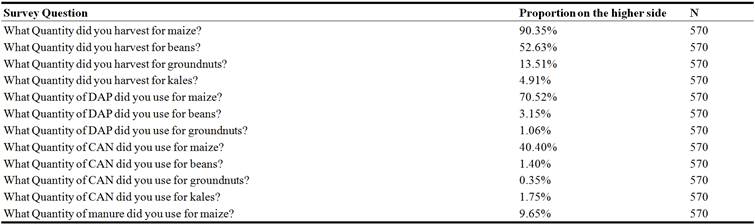
Farmersin Bar "A" were asked their acreage ploughed for maize, beans, groundnuts and vegetables. Maize was the most reported as having the highest acreage (81.75%) followed by beans at (38.60) and vegetables at approximately 8.25%. Groundnuts came fourthat 4.21%. However, in this area, where the intervention was implemented, the proportion reporting high acreage was higher than the average in entire Kisumu Districtthus pointing to an increase of access to information and awareness as a result of the MEFOSEP intervention. Almost all respondents that hadhigh acreages and good farming practices such as the application of manure, CAN, DAP and enough weeding as good farming practices could do so at first attempt without assistance from the interviewer (CHW’s).
Both radio intervention and noticeboard information proved equally effective means of reaching farmers with almost half of the population reporting to have gotten an increased harvest. However, asked how they stored the products they had harvested, a majority of the respondents, 77% of farmers in Bar"A" mentioned storage of less than 1 month.
2.2. Influence on the Harvest
The study sought to determine the influence of the campaign on farming habits on the farmers. At baseline, 71% percent of households reported to have been getting good maize harvest, with 52.1% getting a comparatively low harvest. However, with the high proportion of farmers using the information on the noticeboard, an increase (90.35%) of them who reported the good harvest is attributed to the influence of the intervention. The influence is shown below:
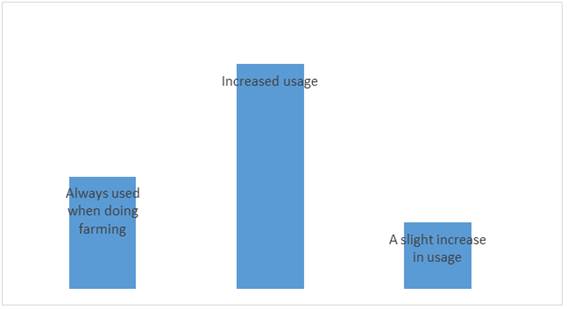
Fig. 1. How MEFOSEP interventionchanged farmers farming habits i.e. maize production.
Adoption trends before and after the intervention do not indicate an appreciable increase in adoption in Bar "A" relative to average trends in Kisumu as shown below.
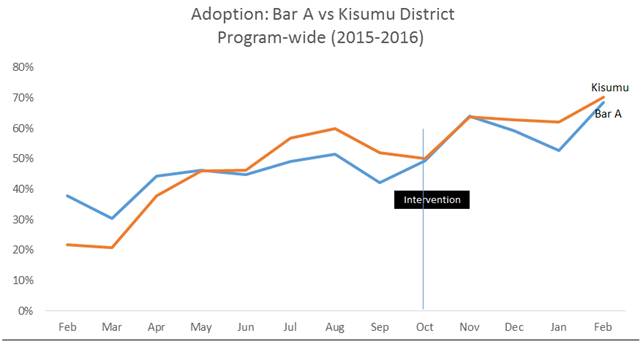
Fig. 2. Adoption: Bar "A"sublocationvs Kisumu District Program-wide (2015-2016).
Despite post-adoption figures in Bar "A" being relatively at par with Kisumu District averages, it must be noted that pre-intervention figures in Bar "A" were 8% lower. After the intervention, 3-month adoption averages in Bar "A" harvest rose by 19.35% while the regional average rose by 7%. At the end of February 2016 (4 months after the campaign), adoption in Bar "A" is almost at par with the national average.
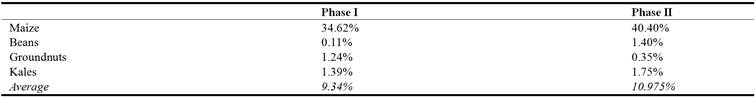
Table 3. 3-Month adoption before and after intervention.

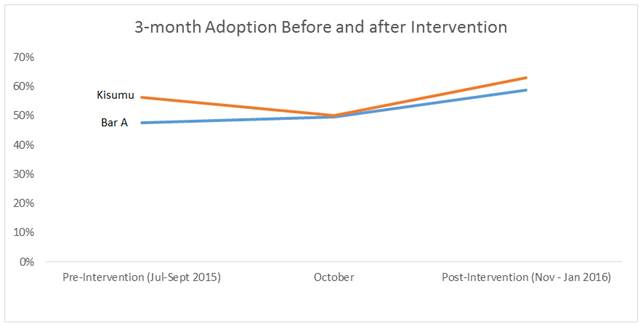
Fig. 3. 3-month Adoption Before and after Intervention.
A test of hypothesis between the proportions of farmers getting high harvest for maize before and after the intervention shows the increase in adoption to be statistically significant1. This increase in adoption in Bar "A" cannot be entirely attributed to the MEFOSEP intervention as other agricultural programs in Kisumu experienced comparableincreases in adoption towards the last quarter of 2015 as seen in Fig. 2. Besides, there could have been a spillover of the intervention resulting from the noticeboard used in the campaign reaching farmers who are not residents of Bar "A".
3. Radio Talk Show
As part of the intervention process, MEFOSEPleadersturned tolocal radio stations such as Lolwe and Victoria stations to be involved in the campaign to spread the information and content to the farmers during the scheduled talk shows. Information indicates thatarea coordinators and field officersfully explained who MEFOSEP are, and specifically the intervention program, the role of the noticeboard in enhancing good farming practices, and proper use of the farm inputs. In addition, in all talk shows monitored, the MEFOSEP leaderaddressed rumors associated with the intervention and safety concerns over farm inputs to the soil fertility. However, vandalism of noticeboard was not adequately covered.
The talk show hosts also afforded listeners time to call in and ask questions of interest about the noticeboard and soil fertility. One question of interest was whether the noticeboard would be installed at every farm/farmers door step. Both male and females participated in the call-in sessions.
4. Conclusion
Results from the intervention campaign conducted in Bar"A" while this is a significant increase, it must be noted that the intervention was implemented while harvest figures in Kisumu region were on an upward trend (resulting from a previous regional boost on farm inputs) and hence the increase cannot be entirely attributed to the intervention point to an 19.35% increase in harvest. This resulted into interference/confounding. However, even with the combined effects of the MEFOSEP campaign and an earlier campaign to boost farming in entire Kisumu, adoption was still lower in Bar "A" relative to the regional average 4 months after the campaign ended.
Acknowledgement
First and foremost, is abundant appreciation to almighty God for so far he has brought us. We are grateful to Mr. MaxwelOyoo our treasurer who has remained committed in facilitating activities in the ground. Not to forget appreciating MEFOSEP partners, that are ministry of agriculture and the Community Health Workers and MEFOSEP members, that is David Odero, Sam, Mojes, Jenifer, Rachael, Monica, Dickens, Pastor Veronica and Pastor Ken Odeny for their overwhelming contribution in MEFOSEP project. Appreciation to our web designer, Mr. Vincent Ochieng for the good work in designing and maintaining our web. Thank you all and May God bless you abundantly.
Appendix 1
Tracking Number of People per Household
As we continue to collect more household level data during the quarterly evaluations, we will get a more accurate estimation of the number of people per household. This number will be updated quarterly and the number reported in each quarter tracked in a table similar to table 4 below.
Table 4. Number of people per household in a quarterly basis.

All tables will be saved in the same excel file with the date of update. Where calculations are involved, formulas will be used and notes used to explain any deviations from the norm, e.g. when using median instead of mean or where approximations have been used.
From a reporting standpoint, calculations will be saved from the date of last reporting. Thus, we will report numbers using program averages that were current at the date of reporting NOT historic numbers updated with current program averages.
References
- Agritourism: Potential Socio-Economic Impacts in Kisumu County.
- Data from Agricultural Sector Development Support Programme (ASDSP)-Kisumu County.
- Data from Kenya Agricultural Value Chains Enterprises Project-Kisumu West.
- ITU-T Technology watch report July 2009, ICTs and Food Security.
- Kenya National Bureaus of statistics (2008), Food Insecurity Assessment in Kenya based on Kenya Integrated householdbudget surveys (2005/2006).
- Kisumu County, Kenya. Universal journal of medical Science.
- National figures on food production.
- NzanzuJeremie., Dan Kaseje, Rose Olayo and Caro Akinyi (2014). Utilization of Community- based Health Information System in Decision making and Health Action in Nyalenda.
- African farm radio research initiative 2011, Participatory Radio Campains and Food Security, African farm.
- Odindo, S, J., Odindo, D, O and Mwayi, A., (2014). The role of information asymmetry in monitoring food security programme in Bar A sub location Kisumu county.
- Odindo, S, J., Mwayi, A., Odindo, D, O, Otieno, W., Akinyi, C and Nzanzu J. (2014). The role of information asymmetry in monitoring food security programme in Bar A sub location Kisumu county, second season harvest 2014.
Footnotes
[1] P-value=0.0063


