
American Journal of Social Science Research, Vol. 1, No. 3, August 2015 Publish Date: Jun. 30, 2015 Pages: 158-162
Age Reporting Error and Effect of Education: A Village Study
Jadab Kumar Pal1, Barun Kumar Mukhopadhyay2, *, H. R. Tewari3
1Indian Statistical Institute, Kolkata, India
2Retired, Population Studies Unit, Indian Statistical Institute, Kolkata, India
3Department of Humanities and Social Sciences, IIT Kharagpur, West Bengal, India
Abstract
The present paper investigates the quality of age data and the effects of education on it in a small village, Ramna Etbar Nagar in the district of Murshidabad, West Bengal, India. To find out the quality of age data, we critically analyzed single year data on age from the figures particularly ending in preferred digits and disliking of ages ending in odd digits, but age selective migration is assumed to be ineffective in this context. The corresponding graph is drawn in order to see the huge peaks and troughs at the preferred and disliking digits. The study reveals from the values and graph that the quality is not at par with the quality to be deemed necessary for any kind of work related to research and planning. Further, Myers’ index (1940) gives a value (71) which is conducive to the quality is unexpected in the area under study. Moreover, the Spearman rank difference correlation coefficient (ρ) method is applied on the ranking of ten digits, ‘0’ to ‘9’ and adopted in Turner’s method (1958) is also applied here and found (0.99) consistence with the Myers’ value. Finally, we find that the educational level of the population has an effect on the quality of age data.
Keywords
Myers’ Index, Turner’s Method, and Spearman Rank Difference Correlation Coefficient (ρ)
Received:April 9, 2015
Accepted: May 21, 2015
Published online: June 28, 2015
@ 2015 The Authors. Published by American Institute of Science. This Open Access article is under the CC BY-NC license. http://creativecommons.org/licenses/by-nc/4.0/
1. Introduction
Age reporting error has been a perennial cause of concern for many social scientists including demographers in particular and actuaries, sociologist, economist etc. in general, especially in developing countries. India’s position is even worse than some of the neighboring countries. The importance of age is well known in the social science researches. The studies on age reporting error need special attention since the errors in the age distribution particularly in censuses are examined more intensively than any other information (Shryock et al., 1973). Since the social and economic characteristics vary so much with the age and also vary in time and place, the population cannot be meaningfully compared unless age has been controlled. Accordingly, age is considered to be the highest priority variable in demographic analysis (Srinivasan, 1998). The importance of age is further quoted (Kerr, 2003) as "it is advisable to adjust the age data before its use in many fields of research". Keeping in view of the above facts, there is always a need to evaluate the quality of age data. In evaluating the data, it is important to investigate the direction and magnitude of error, so that necessary adjustment could be made. Nevertheless, it is also important to know the reasons for the deficiencies in the quality of the data. However, it is more desirable to get accurate data rectifying the deficiencies than to make adjustment on defective data. It is pointed out (Ambannavar and Visaria, 1975) that the improvement in the quality of age data, especially the age heaping can be explained in favor of rise of education. Due to its significance, the present paper tries to study the quality of age data vis-à-vis the education. This kind of study usually is done in bigger geographical areas like districts, states, countries or even internationally in developing countries where errors are still persisting. However, developed countries have improved a lot in this respect as pointed out in many literatures (Mukhopadhyay, 2009). This relationship in a very small area like a village may also be important for the study. But to know whether the same relationship is also persisting among people in smaller community as well, a very small sample area has been chosen to study from the same angle.
2. Sample Design and Methodology
The study is based on primary data collected by using Simple Random Sampling without Replacement (SRSWOR) technique through the field visits to the handloom units in each household as well as interviews and discussions with parents and children working with handloom units at Ramna Etbar Nagar, in the district of Murshidabad, West Bengal, India. Among 1345 households we visited a total numbers of 327 households mostly inhabited by minority community, during the period of March 2008 to August 2008.
Demographic evaluation of the data from raw single year age distribution using Myers’ and Turner’s methods is done. Further, statistical analysis is made to find out the effects of education on the quality of the age reporting of the population.
3. Analysis of the Data
Since the aim of this paper is to investigate the quality of the age reporting of the population of the area under study and effects of education on the quality of reporting of ages, initially single year data were critically analyzed to see whether there is any error in the ages, secondly, by plotting the graph of the same data. Next, using summary measures like Myers’ Blended Method (1940) and Turner’s Method (1958), we calculated and analyzed simultaneously to strengthen the objectivity of this paper. The single year data are given below in Table 1.
It is clear from the figures that ages ending in digits ‘0’ are much higher as compared to surrounding ages ending in odd digits like ‘1’ and ‘9’. Similarly the ages ending in even digits such as ‘2’, ‘4’ and ‘8’. As far as odd digits are concerned, ‘1’, ‘3’ and ‘9’ show disliking of ages ending in those digits. The following graph (Fig. 1) on single years of ages from 23 up to 70 shows the huge peaks and troughs indicating thereby digit preference error in the single year age distribution among the sample population. Fig.1 shows the saw teeth pattern (UN, 1955) of graph showing the huge peaks particularly at digit ‘0’, next at ‘5’. Further, even digits like ‘2’, ‘4’ and ‘8’ also show concentrations to a lesser extent. Finally the odd digits depict disliking as far as people’s attitude not to report their ages ending in those digits.
Table 1. Single year age data of population Ramna Etbar Nagar, Murshidabad, West Bengal, India.
| Single year age | Population | Single year age | Population |
| 23 | 1 | 43 | 2 |
| 24 | 3 | 44 | 7 |
| 25 | 5 | 45 | 24 |
| 26 | 10 | 46 | 1 |
| 27 | 8 | 47 | 1 |
| 28 | 14 | 48 | 20 |
| 29 | 6 | 49 | 5 |
| 30 | 19 | 50 | 14 |
| 32 | 14 | 52 | 6 |
| 33 | 6 | 53 | 3 |
| 34 | 13 | 54 | 3 |
| 35 | 18 | 55 | 13 |
| 36 | 9 | 56 | 2 |
| 37 | 11 | 58 | 4 |
| 38 | 17 | 60 | 4 |
| 39 | 3 | 62 | 2 |
| 40 | 39 | 63 | 1 |
| 41 | 2 | 65 | 1 |
| 42 | 13 | 70 | 3 |
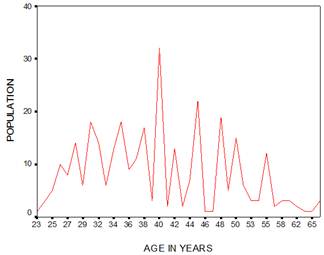
Fig. 1. Population by single year age.
4. Myers’ Blended Method
Myers’ index has been calculated as a summary measure to know the extent of digit preference error in the present population at the particular place of residence. This index reflects preferences and dislikings-on an average for each digit of age from ‘0’ to ‘9’ and also gives overall value of the same. The following Table 2 has been prepared as explained above. As there is less scope to take other higher ages, the two groups 30-49 and 40-59 are required for the calculation of Myers’ index. It is also true that in case of people of advanced ages, there are other errors apart from digit preference error. Older people, particularly in rural areas are more prone to exaggerate their ages in order to pose themselves more senior and wise before the general masses in villages so that they may be more respected. This is a kind of village taboos or prejudices still prevailing among the rural population. That is why United Nation (1955) provides methodology for moving averages and age ratios together in order that something may be said about them (older people) in terms of their extent of over reporting of ages, nick name as exaggeration of ages. Moreover, there is no ‘hard and fast’ rule to consider a particular age range. It depends on the availability of data. In different UN’s manual for appraisal of population data different age range is taken for granted. For example, in Manual X (UN, 1983) age up to 69 has been considered while calculating the Myers’ Blended Method for Sri Lankan data. Similarly, in the older Manual (UN, 1955) the age up to 99 has also been considered for calculation of the same index.
Table 2. Analysis of Myers’ Index for the population.
| Digit | Broad age-groups of population | Weights for | Blended Sum = Col ‘2’xCol ‘4’+ Col ‘3’xCol ‘5’ | Percentage | 10% Deviation | ||
| 30-49 | 40-59 | Col‘2’ | Col‘3’ | ||||
| (1) | (2) | (3) | (4) | (5) | (6) | (7) | (8) |
| 0 | 56 | 53 | 1 | 9 | 533 | 26.74 | 16.74 |
| 1 | 2 | 2 | 2 | 8 | 20 | 1.00 | -9.00 |
| 2 | 27 | 19 | 3 | 7 | 214 | 10.74 | 0.74 |
| 3 | 8 | 5 | 4 | 6 | 62 | 3.11 | -6.89 |
| 4 | 20 | 10 | 5 | 5 | 150 | 7.53 | -2.47 |
| 5 | 42 | 37 | 6 | 4 | 400 | 20.07 | 10.07 |
| 6 | 10 | 3 | 7 | 3 | 79 | 3.96 | -6.04 |
| 7 | 12 | 1 | 8 | 2 | 98 | 4.92 | -5.08 |
| 8 | 37 | 24 | 9 | 1 | 357 | 17.91 | 7.91 |
| 9 | 8 | 5 | 10 | 0 | 80 | 4.01 | -5.99 |
MI=70.93
Perusal of the above table clearly shows the extent of digit preference error for different ten digits of ages. From the last column, ‘8’, corresponding to digit ‘0’ the ten per cent deviation vale is observed to be 16.74 which is the maximum value as compare to other digits. It clearly indicates highest preferences for digit ‘0’. The next highest value of 10.07 has been for digit ‘5’ indicating thereby this digit is the second most attracted digit. The two even digits ‘2’ and ‘8’ particularly the latter one possesses a value of the order of 7.91 which is higher as compared to a value of 0.74 for the former. This shows these two digits are also preferred but digit ‘8’ is more preferred than ‘2’ with 10 per cent deviation value of the order of only 0.74. The figures with negative signs are all showing disliking at odd digits except the even digits ‘4’ and ‘6’ which may indicate sampling fluctuation due to small sample size. However, the overall value of Myers’Index (70.93) shows a high value for significant digit preference error.
5. Turner’s Method
The study conducted by Turner (1958) used rank difference correlation method comparing the observed ranks of populations of the age distribution according to the ten digits 0, 1, 2, … 9 with his hypothetical ranking. According to his hypothetical ranking the most heaping should occur at ages ending in multiples of ten, the next largest at multiples of five, and the next largest at multiples of two and next for odd digits. The entire ranking is given the section below. The degree of correspondence between the actual and the hypothetical ranks is determined by calculating the Spearman rank-difference correlation coefficient (r). Turner’s methodology has been cited in many literatures and also computed in various articles (e.g., Stockwell, 1966; Stockwell and Wicks, 1974; Ewbank, 1981; Mukhopadhyay and Mukherjee, 1988 and Jowett and Li, 2004). Turner’s approach is most suitable for developing countries where the hypothetical ranking is very commonly found. But, this method of comparison may be done according to different classification of population such as sex, residence and many others due to the constraint of small sample, the method is done here only for the entire population.
6. Application of Turner’s Method
In the present context the actual ranking vis-a-vis the Turner’s one of the data is given below. There is almost a one-to-one correspondence between the two meaning thereby the present data on age is highly erroneous in terms of digit preferences which was also clear from the Myers’ method done above. The Spearman rank -difference correlation coefficient (r) is found 0.99, which is highly significant (p<0.00).
Table 3. Comparison of actual and Turner’s ranking.
| Digit | Population | Actual ranking | Turner’s hypothetical ranking |
| 0 | 79 | 1 | 1 |
| 1 | 2 | 10 | 6.5 |
| 2 | 35 | 4 | 3.5 |
| 3 | 13 | 8 | 5.5 |
| 4 | 26 | 5 | 4.5 |
| 5 | 61 | 2 | 2 |
| 6 | 22 | 6 | 4.5 |
| 7 | 12 | 9 | 5.5 |
| 8 | 55 | 3 | 3.5 |
| 9 | 14 | 7 | 6.5 |
7. Education and Digit Preference Error
This section is an attempt to know why this error occurred in the population when the sample size is very small. As a result there is less scope to study the different socio- economic aspect of the population (constraint of small sample population) in relation to the present context. Nevertheless, the data were classified by only education restricting to two broad categories, i.e., primary and above primary. Hence, the population (Age group 23-70) on ten digits of ages from ‘0’, ‘1’, ‘2’ …’8’ and ‘9’ at one side and education (primary/above primary) on the other side has been considered for the present study. In this connection, Mukhopadhyay (2006) made the following comments on literacy standard at one side and quality of age data on different angles as in the following sentences:
Generally speaking the quality of age reporting in a country is a function of the overall level of to educational attainment and the cultural importance that is attached to age in the given country in addition to the questioning technique and the care with which the age question is asked recorded. It has been found, for example, that Turkish quality of age reporting male and female populations went on improving over time with the rise in literacy status. Knowledge of exact age seems to be more wide spread among the literates. In addition to education, there may be other factors which might influence the quality of census age data in India. As a matter of fact, the information of age as required for admission to school, incidences of marriages, conscription sometimes for some situation, introduce motivation for evasive or erroneous reports on age. In the middle age range the most significant effect due to digital error hampers age distribution to a great extent. Apart from this, there are some other errors. In case of misreporting of ages there is tendency in some error to offset one another by transferring from one age to another or from one cycle to another. But while talking about the errors at specified age we have to consider all kinds of errors whether coverage or content error simultaneously.
The following Table 4, population by digits and education with percentages has, therefore, been prepared in order to see the effects of education on the quality of age reporting
Table 4. Population by digits and education with percentages.
| Digit Age (23-70) | Educational level | |||
| Primary | Above primary | |||
| Number | Per cent | Number | Per cent | |
| 0 | 58 | 73.42 | 21 | 26.58 |
| 1 | * | * | * | * |
| 2 | 25 | 71.43 | 10 | 28.57 |
| 3 | 11 | 84.62 | 2 | 15.38 |
| 4 | 18 | 69.23 | 8 | 30.77 |
| 5 | 38 | 62.30 | 23 | 37.70 |
| 6 | 17 | 77.27 | 5 | 22.73 |
| 7 | 15 | 75.00 | 5 | 25.00 |
| 8 | 40 | 72.73 | 15 | 27.27 |
| 9 | 11 | 78.57 | 3 | 21.43 |
*Very few sample number
The analysis (Table 4) clearly reveals that though the sample population is small still there is the usual pattern of heaping at the preferred digits ‘0’ (73 per cent) for primary level of education similarly at ‘5’ (62 per cent), and even digits ‘2’ (71 per cent), ‘8’ (72 per cent), ‘4’ (69 per cent), and ‘6’ (77 per cent) at the same level of education. On the other hand corresponding figures for above primary level of education at digits ‘0’ (27 per cent) which is much less than that of primary education, ‘5’ (38 per cent) also very less as compared to its primary counterpart, ‘2’ (29 per cent) again the same condition, ‘8’ (27 per cent) no exception, ‘4’ (31 per cent) and ‘6’ (23 per cent) the parallel situation. However, when the pattern for odd digits compare themselves with the figures for ‘0’, ‘5’ and even digits for primary level not at all matching with the pattern which should be for them, the same for above primary level of education almost matching with the usual pattern except to, some extent, for the digit ‘7’.
8. Statistical Test
It is observed from the above section that there were differences between the two education levels primary and above primary as far as digit preferences are concerned. As the pattern of odd digits does not show the usual pattern in primary level of education per se, a statistical test (t-test) between the two groups of sample for only digits ‘0’, ‘5’, ‘2’,’8’,’4’ and ‘6’ is done to test whether the differences are statistically significant between primary and above primary. The Table 5 is given for calculation of Student-t test.
Table 5. The distribution of sample population by digits and education.
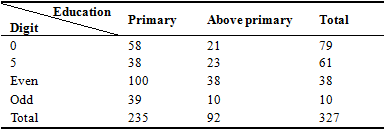
The test shows the mean difference between the two groups is statistically significant (p<0.00). Hence it may be said that if education level is increased the quality of age reporting may also be improved.
9. Conclusion
The scope of study on digit preference error vis-à-vis level of education in a small village within a certain community in the district of Murshidabad, West Bengal, India is very limited because of availability of insufficient frequencies of data in different cell of a binary table. Nevertheless, the present attempt dares to uphold the present situation of some important social variable like age which has multifaceted implication in our society. Without valid data no planning on the part of government or any agency or NGOs can be drawn to increase the social or economic growth of a country. This is a small venture in order that the present situation of bad quality of age reporting in the village of Ramna Etbar Nagar of the above district to be highlighted in the sphere of either in scientific world or in any humanitarian organization or government or state or district administrations. The study has been done from various angles to test the quality of age reporting starting right from the analysis of single year data and corresponding graph, to find out numerical values from compact indices like Myers’ (1940) to Turner’s (1958). From both of these, as the high value of around 71 for the former and Spearman rank-difference correlation coefficient (r) of 0.99 of the latter, it may be concluded that there are huge digit preferences among the people of that community in West Bengal. One of the most powerful social indicators like education, no other indicators may be taken for multivariate type of analysis due to dearth of sufficient data, has been used in a very limited way to its effects on the quality of age data. Using t-test the analysis reveals a significant effect (p<0.00) of education on the pattern of digit preferences of ‘0’, ‘5’, ‘2’, ‘8’, ‘4’ and ‘6 without considering the odd digits of ‘1’, ‘3’, ‘7’ and ‘9’ due to irregular values found particularly among population having primary level of education. Finally, we can say that without proper education of the population no improvement in the quality of age reporting data of the area under study is possible.
References
- Ambannavar, J.P and Visaria, P. (1975). "Influence of Literacy and Education on the Quality of Age Returns." Demography India, 4: 11-15, New Delhi.
- Ewbank, D.C. (1981). Age Misreporting and Age-selective Underenumeration: Sources, Patterns and Consequences for Demographic Analysis, Report 4, Committee on Population and Demography, United States National Academy of Sciences, Washington.
- Garrett, H.E. and Woodworth, R.S. (1961). Statistics in Psychology and Education, Longmans and Co. Inc., New York.
- Gupta, S.K., Mukhopadhyay, B.K. and Pal, Jadab Kumar (2014). Myers’ Blended Method: An Alternative Approach, Journal of Scientific Research and Reports, Sciencedomain International, 3 (18), pp 2459-2465.
- Jowett, A. John and Li, Yuan-Qing (1992). Age – Heaping: Contrasting Patterns from China, Geojournal, 28 ( 4), pp 427-442.
- Kerr, D. (2003). "An Alternative Strategy for Evaluating and Generating Censal Estimates." Genus, 59 (.3-4) pp 71-89. via Nomentana, 41,00161-Roma, Italy.
- Mukhopadhyay, B.K. (2009). Digit Accuracies in Age Data for Developed Regions with Old Pattern of Digit Preference Error in Developing World, presented at the IUSSP conference at Marrakesh, Morocco.
- Mukhopadhyay, B.K. (2006). Statistical Analysis in Evaluating The Demographic Data With Reference To Certain Special Characteristics, Ph.D Thesis, University Department of Statistics & Computer, T.M. Bhagalpur University, Bhagalpur-812 108, pp (i-xii) (1-126) (i-vii).
- Mukhopadhyay, B.K. and Mukherjee, B.N. (1988). A study of Digit Preference and Quality of Age Data in Turkish Censuses, Genus, 40 (1-2), Italy.
- Stockwell, E.G. and Wicks, J.W. (1974). Age heaping in Recent National Censuses, Social Biology, 21(2), pp163-167.
- Stockwell, E.G. (1966). Patterns of Digit Preference and Avoidance in the Age Statistics of Some Recent National Censuses: a Test of the Turner Hypothesis, Eugenics Quarterly, 13(3), pp 205-208.
- Srinivasan, K. (1998). Basic Demographic Techniques and Applications, Sage Publications, New Delhi.
- United Nations. (1983). Indirect techniques for demographic estimation, Manual X, UN Publication, New York, USA.
- United Nations. (1955). Methods of Appraisal of Quality of Basic Data for Population Estimates, Manual-II, Population Studies No. 3.


