
Journal of Social Sciences and Humanities, Vol. 1, No. 4, September 2015 Publish Date: Jul. 23, 2015 Pages: 400-414
Flash Flood Hazard in Dire Dawa, Ethiopia
Yonas Tadesse Alemu*
Dire Dawa University, Department of Geography & Environmental Studies, Dire Dawa, Ethiopia
Abstract
Dire Dawa, the second largest city of Ethiopia, has been suffering from disastrous floods in its history. The 2006 flooding was unprecedented aftermath caused severe impacts on human lives and property. This study aimed in identifying flood causative factors and the resulting socio-economic impacts. The results of the daily rainfall data analysis shows that, during the last decades, the highest values of rainfall intensity (Ip) have been increasing in the Dechatu catchment. The increase in rainfall intensity in the Dechatu catchment is constant since 1970. The mean peak rainfall intensity, Ipm (mm/24h), calculated from averaging the annual highest values (Ip) recorded in the study meteo-stations shows a marked increase in the Dechatu catchment. This result explains rainfall intensity is one of the factors for increased generation of flash floods in the city of Dire Dawa. One of the major causes for the high magnitude flood that hit the city in August 6, 2006 was the high intensity of rain that fell in the upland areas in the previous day. Similarly land-use change in the catchment particularly shrinking of natural forest in the upland has aggravated flood incidences. The results of land use change between 1985 and 2006 showed expansion of urbanized area from 39% to 56.33% and farmlands from 11.04% to 12.77%. On the contrary shrub lands decreased from 17.77% to 3.96% and woodland from 0.37% to 0.23%. Such Expansions of urbanized area and farmlands on the expenses of woodland and shrub land areas has a direct correlation with the potential for surface runoff generation. In the 2006 flood impacts in Dire Dawa, the socio-economic sector was severely affected and caused deaths of 256 people, 244 missing and more than 9956 people displaced and damage of properties for 882 small scale traders and 123 licensed traders was estimated to be 17146493 ET. Birr. It had also an enormous impact on the economic foundation of the city due to the expenditure for rehabilitation and reconstruction. The recurrent expenditure of the city increased by 43% for reconstruction and rehabilitation whereas the capital expenditure was kept static or even decreased. Overall direct and indirect damages of floods on agricultural; trade and infrastructural sectors of the city was estimated to be about 97,368,634.36 ET Birr. Therefore, enactment of land-use policy is important for future disaster mitigation. Moreover, promoting early warning system in the city is important to evacuate people before flood disaster occur.
Keywords
Dire Dawa, Flash Floods, Dechatu River, Flood Impacts, Rainfall Intensity, Land-Use Change
Received: May 4, 2015
Accepted: June 3, 2015
Published online: July 23, 2015
@ 2015 The Authors. Published by American Institute of Science. This Open Access article is under the CC BY-NC license. http://creativecommons.org/licenses/by-nc/4.0/
Contents
1. Introduction 2. Materials and Methods 2.1. General Description of the Study Area 2.2. Data Source and Methods of Analysis 3. Result and Discussion 3.1. Rainfall Trend in the Dechatu Catchment 3.2. Land Use/Cover Change Analysis 3.3. Inundation Analysis 3.4. Socio-Economic Impact of Flooding in Dire Dawa 4. Conclusions Recommendations Acknowledgments
1. Introduction
During recent years, records of loss of life and damage caused by floods worldwide show a steady rising trend. While being beneficial to the flood plains and their productivity, floods do have great damage potential and affect ever-increasing number of people. On a global scale, there is evidence that the number of people affected and economic damages resulting from flooding are on the rise. All water related disaster events increased between 1980 and the end of the twentieth century. The estimated water-related economic losses globally show an increasing trend. The trend had a trough during the period 2001 to 2003, and then increased sharply until 2006 (WMO &GWP, 2005; Adikari and Yoshitani, 2009).
Large-scale disasters have significant humanitarian, social, security, political, and economic implications. Disasters leave large numbers of people ill, disabled, widowed, orphaned, displaced, or suffering from post-traumatic stress disorder (ADB, 2004).
In Africa floods are among the most devastating natural hazards, whereas flash floods are among the greatest hazards arising from tropical cyclones and severe storms. Floods and flash floods cause loss of life, damage to property, and promote the spread of diseases such as malaria, dengue fever, and cholera. From 1900 to 2006, floods in Africa killed nearly 20 000 people and affected nearly 40 million more, and caused damage estimated at about US$4 billion (ICSU-Africa, 2007). Water related disasters increased more than four folds in Africa ( Adikari et al.,2008). According to World Bank (2003), in most developing countries flood disasters still claim tens of thousands of lives each year and destroy livelihoods in an instant.
Ethiopia’s topographic characteristics has made the country pretty vulnerable to floods and resulting destruction and loss to life, economic, livelihoods, infrastructure, services and health system (DPPC, 2007).
Several factors could be mention as causes of flooding by different writers. Deforestation can impact hydrological processes, leading to localized declines in rainfall, and more rapid runoff of precipitation, causing flooding and soil erosion, a common phenomenon in most parts of Ethiopia (Dagnachew et al., 2003). On the other hand, the high infiltration rates under natural forests serve to reduce surface runoff and flood response. Certain types of plantation forests may also serve to increase infiltration rates through providing preferential flow pathways down both live and dead root channels. From the theoretical considerations it would be expected that interception of rainfall by forests would reduce floods by removing the proportion of the storm rainfall and by allowing the build-up of the soil moisture deficits (Calder, 1999).
According to Dagnachewet al. (2003), Land-use change due to the expansion of urban areas also affects the ground infiltration rate which in turn gives the way flooding to occur. Land-cover change has one of the causes of flooding phenomenon of the Awash basin, which resulted in millions worth of resources lost nearly every main rainy season. Low level vegetative cover could also affect infiltration and could lead to reduced groundwater levels and the base flow of streams. It is obvious that land-cover can affect both the degree of infiltration and increases runoff following rainfall events (Dagnachewet al., 2003).
Sometimes as a result of the extended and widespread heavy rainfall since the beginning of the rainy season, many areas in the country have experienced devastating damages of floods. For instance in the year 2006 altogether, the floods have killed 620 people and affected more than 128,000 people. Thousands have lost their property and means of livelihood in the same flooding disaster (UNCEF, 2006). In Ethiopia flood disasters and the damage it cause on properties and human lives have an increasing trend (see Fig. 1.1).

Fig. 1.1. Flood disaster events in Ethiopia (adapted from EM-DAT).
The increasing flood damages in many parts of Ethiopia over years in general and the serious damages occurred recently in Dire Dawa in particular should remind us the urgent need in change of paradigm in order to reduce the human vulnerability and to guarantee sustainable development.
Dire Dawa, which was established in 1910 and located at the foot hills of eastern Harerge highlands, has been repeatedly hit by powerful flood disasters. Flooding at different time destroyed homes, public institutions, market places with their properties, infrastructures, crops in the field, livestock, etc. In Dire Dawa, flood in August 1981 which killed about 80 people was previously considered the worst in the town’s history. However, the unprecedented August 6, 2006 flooding was worst of all cases; it surpassed all flood disasters that occurred in the past in loss of human life, and property damages.
Owing to the recently witnessed unprecedented damage caused on one hand and the lesser amount of concrete actions to mitigate the flood hazards on the other, things continued unchanged, we can say, other developmental efforts would bear no fruits, this is because, floods could destroy them all, as we have experienced.
In such a situation it is important to consider major factors that contributed most in the past flood hazard calamities. It has of paramount importance to take notice of these factors to arrive at a wise and comprehensive solution towards mitigating the challenge (that is flooding) which is unpredictable.
In Dire Dawa, recently the city administration has given due attention to mitigate the challenges of flooding and the disaster it causes. However, still more has to be done because the recently occurred (2010) flooding witnessed that flood disaster is still so severe and requires rigorous research to identify the root causes of the problem and generate policy relevant recommendations. Studies in this regard are not sufficient to give adequate information of the impacts of flood disasters in the economic, social and infrastructural aspects of the city. Therefore, the objectives of this study were to:
1. Identify and assess the major flood-triggering factors and vulnerability of the community to flood hazards;
2. Generate maps of urban flood inundation by using data from peak runoff events;
3. Carry out a socio – economic impact survey and examine the extent of the disaster in individual and public property.
2. Materials and Methods
2.1. General Description of the Study Area
2.1.1. Location
Dire Dawa city is located between 9027’N and 9049’N latitude and 41038`Eand 42019`E longitude, and in the eastern marginal catchment of Awash basin (Fig.2. 1). East Hararge Administrative zone of Oromiya Regional State borders it in the south and southeast and Shinelezone of Somalia Regional State in the north, east and west. Dire Dawa has a total area of about 66,017ha of which the south and south-eastern part of the city which is characterized by a chain of mountains and upland covering 45%; low lying flat land accounting for 40% of the land area; and the remaining 15% is covered by gorges, valley and River terraces (MoWR Ethiopia, 2006).
2.1.2. Population
The total population of Dire Dawa city is estimated to be 400,000 people (IDP, 2006). According to the 1994 Central Statistical Agency census result, Dire Dawa city had a total population of 252,000 during the census period and in the year 2005; the population of the city has reached 389,851 which exceeded the census period population by 137,851. More than half of this increase is due to migrants from nearby rural areas and other part of Ethiopia. Since Dire Dawa is one of the industrial and business cities in Ethiopia, people from rural areas perceived that job can easily be secured in the city. The increment within a decade accounts for more than half of the size of the 1994 population, which is tremendous in magnitude. On the other hand, the average annual growth rate of the population was 4% for the region during the years 1995-2000. The growth rate declined to 3.8% for the years between 2000 and 2005 and expected to further go down to 3.5% for the years between 2005 and 2010 (IDP, 2006).

Fig. 2.1. Location map of Dire Dawa Administration.
2.1.3. Climate
Because of its tropical location Dire Dawa is experiencing high temperature throughout the year with minor seasonal variations. Temperature progressively increases northward from somewhat temperate type along the mountain side of the city in its southern most point.
The seasonal rainfall has a bimodal distribution with peak in April and August. The two rainy seasons are spring and summer locally called 'Belg' and ‘Kiremt’ respectively, separated by a short dry spell in June. The mean annual rainfall is about 730mm. The mean annual average air temperature is 29c0 and June is the warmest month of the year while December and January are the coldest. Dire Dawa enjoy a sunny climate with mean annual daily value of bright sunshine equal to 8hours (IDP 2006).
2.1.4. Soil
The major soil types of Dire Dawa exhibit a general relationship with altitude, climate and vegetation. Shallow and infertile soil is being the characteristics of the mountains. This is due to the fact that the mountains experienced serious forest degradation and resulting soil erosion. While fertile soils are the major properties of river terraces and flat plains of the study area. Generally, the soils of the valley are developed on recent alluvial sediments derived from the adjacent mountain ranges. Lithosols and Vertisols are generally dominating soil types in the area. Texturally these soils are characterized as clay loam sandy clay soils (MoWR Ethiopia, 2006).
Soil erosion in the Dechatu catchment is a major problem that the top soil is experienced severe degradation. There is severe degradation of forestland mainly due to expansion of farmlands in the upland area of Dechatu catchment; the magnitude of soil erosion is very serious in the area. According to MoWR, 2006, the Soil Conservation Research Project that has been carried out at national level estimated an average soil loss of 42t/ha/yr in cultivated fields and the maximum of 300-400 t/ha/yr in highly erodible and intensively cultivated fields like eastern harargehighlands, where the study area is located.
2.2. Data Source and Methods of Analysis
2.2.1. Data and Sources
Based on the nature and type of data, the data required for this study are categorized as physical and socio-economic data. Physical data includes climatic and land use related data. Data about social, economic and infrastructural sectors are categorized as socio-economic data.
The main data sources for this data encompass a topo map with scale 1:50,000, land sat multispectral scanner satellite image (MSS image) from 1975, Land sat TM of 30m × 30m resolution satellite image form 1985 and Spot 5m x 5m satellite image from 2006 (Yonas et al., 2013).
Climatic data, rainfall on a daily basis for the study area was obtained from National meteorological Agency by taking in to account the following four metrological stations which all are located within and around the catchment. These include Dire Dawa, Haramaya, Dengego, kersa and Kulubi stations.
(ii) Socio-Economic Data
In order to analyze the socio-economic impacts of flooding, flood damages on social, economic and infrastructure sector has been collected from Disaster Prevention & Preparedness Bureau (DPPB), Dire Dawa Agriculture and Rural Development Office.In addition population data of affected Kebeles1 collected from kebele administration. This study has also employed primary data sources. Focus group discussion, interview with key informants and direct observation in the field, are the most intensively used methods for primary data collection.
2.2.2. Data Analysis
(i) Meteorological data analysis
Extreme rainfall data for the meteorological stations in the study area have been systematically arranged for the main and minor rainy seasons (KiremtandBelg). According to World Meteorological Organization (2009), extreme rainfall is greater than or equals to one (1) mm of rainfall. Then trend analysis of the daily rainfall data has been carried out for theMeteorological stations in the study area.
(ii) Land use analysis
Land use/cover change of Dechatu catchment was analyzed using multi-temporal satelliteimages: 1975 MSS image, 1985 Land sat TM image and 2006 spot image. Satelliteimages were geometrically corrected by using ground-truth point’s andenhanced using linear stretch technique. The classification of land use/cover was done first by unsupervised classification and after fieldwork supervised image classification which is a widely used classification technique was applied. From six major land use/cover types (Open Wood land, Shrub land, cultivated land, Bareland, Sand deposit and Built up area), 180 ground truth points were collected from the field. Each point was marked with GPS which was later integrated with the image. Half of this data was used as input for supervised image classification and the remaining for accuracy assessment.Finally the extent of land use/cover change was computed by using change detection statistics technique inENVI.4.2 software (Yonas et al., 2013).
(iii) Inundation analysis:
As no runoff data are available for Dechatu River, The Curve Number (CN) Method has been used to derive flood discharges from the rainfall excess. The SCS-CN method was selected as it is adapted for daily rainfall data and related to catchment characteristics such as soil and land-use.
The runoff curve Number (also called a curve Number or simply CN) is an empirical parameter used in hydrology for predicting direct runoff or infiltration from rainfall excess. The runoff curve number was developed from an empirical analysis of runoff from small catchments and hill slope plots, like Dechatu Catchment. It is an efficient method of determining the approximate amount of direct runoff from a rainfall event in a particular area.
To analyze the inundation area of Dechatu River, this study has been utilized Arc GIS 9.2 software package and Hydrologic Engineering Center-River Analysis System (HEC-RAS). Then accurate topographic survey of the river cross-section was conducted at selected representative points across the Detchatu River using Total station. In addition, a survey of river bed roughness to calculate Manning's n value have been conducted which finally exported to HEC-RAS so as to make inundation analysis. Then the TIN of the catchment was produced from DEM of the catchment by using the 3D Analyst extension of Arc GIS.
Arc GIS data was imported to HEC-RAS on GIS format and cross section filtering was performed by taking a number of points to trim on cross sections. Flow data for boundary condition and initial condition such as flow hydrograph and slope has been defined. Finally, flow simulation was performed and the result is exported to GIS to process the inundation map.
(iv) Socio-economic Impact Analysis
Flood impact on the socio-economic and infrastructure sector has been analyzed by using both the ECLAC result and descriptive method of analysis. In addition, tables, Figures that show the disaster impact has been employed in the analysis.
3. Result and Discussion
3.1. Rainfall Trend in the Dechatu Catchment
The daily rainfall data analysis shows that, during the last decades, the highest values of rainfall intensity (Ip) have been increasing in the Dechatu catchment. The increase in rainfall intensity in the Dechatu catchment is constant since 1970(Fig. 3.5).
An increase in rainfall intensity, in association with other factors such as land-use change, increased population settlement along the river bank in the downstream area have contributed to raise the risk level of flash floods in the town of Dire Dawa to the point that floods caused severe socio-economic impacts in the town and rural kebeles. In the very recent years of course the local administrations have constructed gabion and high flood retaining walls that have contained the last floods occurred in 2010 with discharges around 1000 m3s-1 preventing the town from further inundation.However, the boulders drawn by the runoff from the upland area have collided with the wall and damaged its part in 2010 flooding. This tells us more structural measures have to be taken in the upland areas where flood water sourced in order to reduce the velocity and volume of the water draining downstream.
On the basis of the rainfall data of the meteo-stations located within or close to the Dechatu River catchment, recoded the day before the devastating flood of 6 August 2006, that ranged from 100 to 150 mm in 24 hours, a rainfall intensity of 100 mm/24h was taken as a reference value capable to set conditions for a flash flood (Table 3.1).The mean peak rainfall intensity, Ipm (mm/24h), calculated from averaging the annual highest values (Ip) recorded in the study meteo-stations shows a marked increase in the Dechatu catchment. This result is considered as one main factor responsible for the increase in the frequency of high flash floods in the town of Dire Dawa.
The results of climate data analysis have been similarly expressed by focus group discussants. The focus group discussion revealed that rainy season’s duration is shortened and rain falls with its highest intensity for short duration. According to the discussants, as the result of change in the duration of rainy season they are forced to abandoned crops that require water for longer time during their growing period.
As it has been indicated in Fig.3.1; 3.2; 3.3; and 3.4, summer rainfall intensity in all upland meteo-stations has showed an increasing trend, and this is the season when most devastating floods occurred in Dire Dawa.
Table 3.1. Rainfall intensity measured in the Dechatu Catchment.
| Date | Dire Dawa | Kersa | Alemaya | Kulubi |
| Aug 1, 2006 | 0 | 0 | 0 | 0 |
| Aug 2, 2006 | 0 | 0 | 0 | 0 |
| Aug 3, 2006 | 4.3 | 7.9 | 18.9 | 26.7 |
| Aug 4, 2006 | 10.2 | 0 | 24.5 | 4.7 |
| Aug 5, 2006 | 36.9 | 159 | 118 | 100.5 |
| Aug 6,2006 | 1 | 0 | 7.3 | 0 |
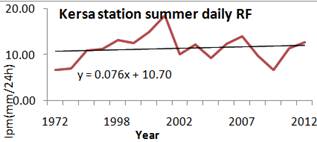
Fig. 3.1. Summer daily average rainfall, Kersa station.

Fig. 3.2. Summer daily average rainfall, Haramaya station.

Fig. 3.3. Summer daily average rainfall, Dengego station.
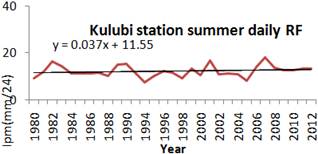
Fig. 3.4. Summer daily average rainfall, Kulubi station.
3.2. Land Use/Cover Change Analysis
Land use/cover change as one of the most prominent component in the hydrological processes of a given area it is important to evaluate the changes that undergone in a given catchment so as to understand the hydrological behaviour of the catchment. Accordingly, the major land use/cover changes that observed in Dechatu catchment between the year 1975 and 2006 was studied based on the thematic land use/cover map that produced from 1975 Land Sat Mss and 2006 Spot satellite images. In doing so the change detection statistics method was implemented.
The change detection statistics of the area coverage of the six land use/cover classes of Dechatu catchment was cross-tabulated using ENVI 4.2 software package.ENVI 4.2 display change detection statistics result in three Ways (Number of Pixel, percentage and in area terms). For the sake of easy and better explanation this study implements the percentage option.
The change detection statistics of the catchment was done by considering the 1975 Land use map as initial state map and 2006 land use/cover map as final state map (See Fig.3.6, 3.7& 3.8) and the change observed in each land use/cover class is summarized in Table 3.2.
Table 3.2 clearly states that, the most positive change 117.18 %, 98.32%, 59.68 and 67.87% is observed in the expansion of built-up areas, bare land, sand deposit and cultivated land respectively in the catchment. A number of factors have been identified as major causes for the highest change in the above two land use classes. Among these factors rapid urbanization, expansion of agricultural lands and deforestation are the major one.

Fig. 3.5. Daily average rainfall for all stations.
In contrary to built up area (urban area) and cultivated land, the most negative change is observed in shrub land cover (-64.84%) and open wood land coverage (-72.96%). This left some of the mountainous part of the catchment devoid of vegetation (Fig. 3.9) which in turn reduce the infiltration capacity of the catchment and increase the volume of runoff produced by the catchment. Furthermore, sand deposit area has also expanded by 59.68% with these ten years and this in turn has been responsible for rising of the river bed causing Dechatu River to burst its bank.
3.3. Inundation Analysis
Since no runoff data are available for Dechatu River, The Curve Number (CN) Method has been used to derive flood discharges from the rainfall excess. Therefore, before the inundation analysis have been performed peak discharge, main input for the analysis, has to be derived by using curve Number (CN) method. Accordingly, peak discharge was calculated and 1400m3/s was found from the rainfall excess. With this discharge amount areas of inundated was analyzed.
Based on the result of the inundation map (Fig. 3.10), the analysis shows that about 55% of the total inundation area is covered by 1m inundation depth; 30% of the total inundated area is covered by 2m inundation depth. Generally, about 86% of the total inundated area is covered by 2m or less than 2m inundation depth. Since all of the houses in the inundated area are one storey houses, this depth of inundation is very big to damage houses; damage property and cause human casualty.

Fig. 3.6. Land use/cover map of Dechatu catchment for the year 1975.

Fig. 3.7. Land use/cover map of Dechatu catchment for the year1985.

Fig. 3.8. Land use/cover map of Dechatu catchment for the year 2006.
Table 3.2. Land use/cover of Dechatu catchment change detection statistical summary.
| Percentage (%) | 1975 Land Use/cover | Row Total | Class total | |||||||
| 2006 and Use/cover | Percentage (%) | Built-up area | Shrub land | Bare land | Open wood land | Sand deposit | Cultivated land | |||
| Unclassified | 0.562 | 0.875 | 1.059 | 1.716 | 0.000 | 1.027 | 0.757 | 100.0 | ||
| Cultivated land | 15.97 | 43.281 | 41.083 | 55.000 | 29.726 | 63.214 | 99.22 | 100.0 | ||
| Built-up area | 44.61 | 9.993 | 4.880 | 2.306 | 22.877 | 2.579 | 99.11 | 100.0 | ||
| Shrub land | 28.44 | 24.245 | 13.921 | 5.443 | 32.466 | 9.811 | 99.21 | 100.0 | ||
| Bare land | 4.452 | 18.456 | 37.043 | 7.085 | 12.192 | 17.722 | 99.12 | 100.0 | ||
| Open wood land | 0.234 | 1.833 | 1.407 | 28.303 | 0.822 | 5.247 | 99.78 | 100.0 | ||
| Sand deposit | 5.717 | 1.318 | 0.605 | 0.148 | 1.918 | 0.401 | 99.35 | 100.0 | ||
| Class total | 100.0 | 100.00 | 100.00 | 100.00 | 100.00 | 100.000 | 0.000 | 0.00 | ||
| Class change | 55.38 | 75.755 | 62.957 | 71.697 | 98.082 | 36.786 | 0.000 | 0.00 | ||
| Image difference | 117.18 | -64.84 | 98.32 | -72.96 | 59.68 | 67.87 | 0.00 | 0.00 | ||
The inundation depth of 4 to 6m is about 4.6% of the total inundation area which is less significant in terms of its area coverage. As it is shown in Fig. 3.10; large residential areas are inundated by about 1 to 2meter inundation depth which implies that flood inflicted severe damages on property and human life on this inundated areas. Though the total inundated area is about 1km2 of the total area of the city, due to dense settlements within the flooding zone human vulnerability and property damage to the disaster was high. More than 3m inundation depth is located within the river channel where the River passes through narrow hill before it reaches the city. The details of inundation results are shown in Table 3.3.
The inundation of residential areas; business centre by the river has inflicted considerable damages on the economy; infrastructure; and left with large number of human casualty.
Table 3.3. Inundation area of Dechatu River.
| Inundation Depth | Inundated Area(m2) | Percentage of total Inundated Area |
| 1m | 544400 | 55.9% |
| 2m | 291600 | 30% |
| 3m | 92800 | 9.52% |
| 4m | 25600 | 2.63% |
| 5m to 6m | 20400 | 2.1% |
3.4. Socio-Economic Impact of Flooding in Dire Dawa
Introduction: In the analysis data of affected population, damaged houses, Infrastructural damages, damages on agricultural sector, trading sector and data on environmental damages were considered. In addition, the study tried to focus the socio-economic damages on the 2006 floods. This is due to the fact that the 2006 flood is the most disastrous flood damages on the socio-economic sectors in the flooding history of the city. Moreover, flood damages in the socio-economic sector are separated as direct and indirect damages.

Fig. 3.9. Pictures around Harla and Ijaneni area, Dire Dawa Adiminstration(Source: Own picture during field survey).

Fig. 3.10. Inundation map of Dechatu River.
The amounts of damages caused directly by flood related factors are categorized under direct damages. Direct damages during the 2006 flooding in Dire Dawa includes human casualty; property damages (both private and public property); damages on infrastructure which restricts communication, and damage on power sector which prevents use of electricity for production and light. Moreover, direct damages on the economic sector such as, agricultural and trade and industry were also so severe during the 2006 flooding year. The results of all the direct and indirect damages caused by the 2006 flooding are summarized in the following tables.
A. Flood affected population
Flood disaster damaged portions of the city located along either sides of the Dechaturiver channel. Of the total nine kebeles, the most severely affected kebeles were four (Kebele09, 06,05and 03) with the total population of 117,315 (Table 3.4).
Most of the flood affected people were poor people who used to live in flood prone areas. There are at least15 000 dwellers living in high-risk flooding areas in the city of Dire Dawa (UN-HABITAT, 2008). Poor people build houses made from inappropriate materials in flood-prone areas. Poor living condition makes this people most vulnerable to flood disaster.
Table 3.4. Flood affected population and affected kebeles in 2006 in Dire Dawa.
| Affected Kebeles | Dead | missing | population of Affected Kebeles |
| 03 | 134 | 176 | 26363 |
| 05 | 39 | - | 30662 |
| 06 | 83 | 68 | 29492 |
| 09 | 30798 | ||
| Total | 256 | 244 | 117315 |
Moreover, as shown on Table 3.4, the 2006 flood also affected all age groups in the affected areas of the city. This is mainly due to the fact that the flood occurred in the middle of the night while people were in deep sleep. The residential areas which were hit by the ravaged flood in the middle of the night in August, 2006 had experienced the disastrous flood that left many fatalities and missing people. This shows us the city has no flood early warning system that alert the people to evacuate before floods occurred and cause disastrous damage like the 2006 flooding. Due to poor early warning systems, limited preparedness and weak rescue capacity in the city, the impact of flood hazards can be very big that it kills large number of people and causes severe damages on property in every flooding year.
B. Flood damages on market places
Unemployment in the city of Dire Dawa is estimated to be 16.7% (MWUD of Ethiopia, 2008). In order to alleviate this serious problem of the city of Dire Dawa, the government widely introduced micro-enterprise aimed to establish a sustainable saving and credit scheme to the poor and build the capacity of the poor by giving necessary credit and technical support. Micro-enterprises have created job opportunity for large number of people especially for young groups (most of which are women) and helped them to live better life. However, flood disaster like the 2006 flooding ravaged the properties of these small scale traders and affected about 882 people.
Floods which devastate properties with a total amount 6,697,992 Birr of these small scale traders resulted in loss of own business or job, and income and forced them to seek others support. The 882 people once running their own business and supporting themselves and their families’ now lost everything. Flood has taken all their properties and exposed them for suffering. This disaster impact on one hand has impoverished individuals whose vision was for better prospects.
Similarly, flood disaster in 2006 has inflicted severe damages on licensed traders’ property (Table; 3.5). 123 individuals in three flood affected kebeles have lost an estimated amount of 10,448,501Ethiopian birr saleable commodities. If we roughly calculate the loss to the affected 123 people, each trader by an average has lost about 85,525 Ethiopian Birr. This is very big loss from the point of view of the contribution of these people to the growth of the city’s business sector. A striking fact is that the number of people in each family (5 people for each household in Dire Dawa) supported by each trader is large. These numbers of people are therefore indirectly victims of the flood disaster.
Table 3.5. Estimated Economic losses of individuals who are licensed traders in the city of Dire Dawa (Source: Federal Multi-Agency Assessment Mission, 2006).
| No. | Kebeles | Affected traders | Estimated Loss (Birr) |
| 1 | Kebele 05 | 93 | 8,742,100 |
| 2 | Kebele 09 | 15 | 1,527,342 |
| 3 | Kebele 03 | 7 | 74,000 |
| 4 | Kebele 02 | 1 | 14,360 |
| 4 | House Cart Association | 7 | 90,700 |
| Total | 123 | 10,448,501 |
The destructive flood that ravaged business centres of both small scale micro-enterprise and licensed traders have left about 1005 people without business and wait for handouts and rehabilitation from government and/or non-governmental organizations. The flood damages in different economic sectors of the city have also its own contribution in increasing the poverty rate of the city. Because of their poverty they were rendered more vulnerable to the flood, which in turn deepened their impoverishment.
The 2006 flood also appears to be having a long term indirect impact in the economy of Dire Dawa Administration due to the divergence of the government budget to reconstruction and rehabilitation. Due to flood disaster the city’s recurrent expenditure for relief and reconstruction purpose was rose up. The capital budget which is used for developmental activity such as infrastructural development was partly diverted to recurrent expenditure. This implies floods have negatively impacted on the city’s economic development.
In 2005/06 budget year due to sharp rose up of recurrent expenditure for flood affected people rehabilitation and reconstruction of damaged infrastructure, capital expenditure for the city was static. Due to flood disaster the city recurrent expenditure increased by 43%, if there was not flood it was only increased by 16%. The public sectors loss a total of 53.88 million Birr, 29.55 million Birr in emergency relief and the remaining 24.33 million Birr was estimated increase in recurrent expenditure for reconstruction (DPPB, 2006). If there was no flood this amount of capital used for development of the public sectors.
C. Flood affected Housing and Infrastructure in Dire Dawa
Floods at different time have inflicted severe impacts on the housing and infrastructure sectors. For instance flooding in 2006 has impacted severe damages in infrastructure (see Fig. 3.11, 3.12, 3.13, 3.14) and housing. In the housing section, a total of 2685 houses were totally or partially damaged and as a result total population of 9,956 has been displaced. Most of these damaged houses were found within the flooding plain. To further worsen the disaster in the area, more than 55% of the damaged houses were made of poor materials such as mud and wood, which were not in a position to resist the force of the flood.
In the infrastructure sector the total direct damages inflicted on energy; water and sanitation; and transport and communication sector in the 2006 flood is estimated about 7,703,198.36 (Table 3.6). As a result of major damages on power and telecommunication transmission lines and water sector, affected areas of the city were suffered from shortage of potable water; absences of electricity and telecommunication services until the structures were maintained.
Moreover, due to the damage of main road that connects the city with other regions including the capital city and some roads within the city, transportation to the city and from the city was interrupted until the damaged roads maintained. Since Dire Dawa is located in a strategic position connecting Djibouti and central parts of Ethiopia, the road damage created considerable indirect impact by delaying goods that should be transported to the neighbouring Djibouti and to the centre of the country.
Table 3.6. Summary of flood affected infrastructure sector in Dire Dawa in 2006.
| No. | Infrastructure | Cost of damage |
| 1 | The rehabilitation of partially damaged Dechatu main bridge, | 3,000,000.00 |
| 2 | Taiwan Irish crossingthat joins Taiwan with Number-one area. | 900,000.00 |
| 3 | Halfkat Irish crossing which connects Halfkat and Vera pasta areas | 500,000.00 |
| 4 | Dechatu retaining wall in two parts (60m) | 400,000.00 |
| 5 | Kefira guide wall about 120m has been destroyed | 950,000.00 |
| 6 | About 100m retaining wall along Goro River in GTZ settlement area | 930,000.00 |
| 7 | Road damaged and covered by silt | 517,100.00 |
| 8 | Electric poles and lines | 500,000.00 |
| 9 | Telephone poles and lines | 6,098.36 |
| Total | 7,703,198.36 |
Source: Federal Multi-Agency Assessment Mission, 2006.
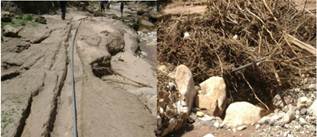
Fig. 3.11. Flood damage on potable water pipe lines.
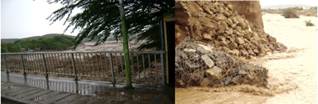
Fig. 3.12. Water level around Kezira main Bridge & Damages on gabion.
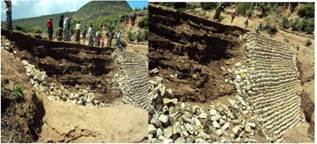
Fig. 3.13. Damages on Sediment Storage Dams(SSDs).
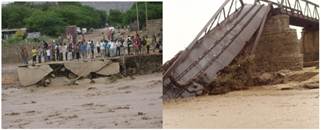
Fig. 3.14. Flood Damage on Hafkat ford and Damage on Railway Bridge.
Source: All the pictures source is DDAC, Rural Development Office, Flood Impact Assessment Report, May 3, 2010.
D. Flood disaster on Agriculture; Trade and Industry
Floods in 2006 affected the agriculture sector seriously that it damaged standing crops, drowned domestic animals and damaged irrigation facilities. Floods in Dire Dawa usually occur at the vegetative growth stage of major food crops (mostly in August). Crop fields in the low-lying areas of the watershed can be washed away by the flash flood that descends down from the upland. In rural places more than 1,827 households (10,809 persons) were affected by the same flood in 17 kebeles. The flood in rural areas left 21 livestock dead, 6 houses washed away, 257.6 hectares of farm lands with crops, and rural infrastructures were damaged. The total damages in the rural infrastructure sector were estimated 1,738,630.00 Eth. Birr. The rural infrastructural damages in the 2006 flooding have been summarized in table 3.7 below.
Table 3.7. Rural infrastructure damage.
| No | Description | Unit | Total Damage |
| 1. | Infrastructure damaged | ||
| Soil bund | Km | 224.2 | |
| Stone bund | Km | 62.3 | |
| Stone check dam | M3 | 8600 | |
| Water harvesting ponds | No | 2 | |
| Cut off drain | Km | 43.85 | |
| 2 | Damage on farms | Ha | 230.64 |
| Sorghum | Ha | 203.36 | |
| Maize | Ha | 25.9 | |
| Haricot bean | Ha | 0.75 | |
| Sesame | Ha | 0.63 | |
| 3 | Fruits and Vegetables | Ha | 17.21 |
| Fruit | Ha | 15 | |
| Vegetables | Ha | 2.21 | |
| 4 | Cash crops | Ha | 9.72 |
| 5 | Different farm tools | Ha | 399 |
| 6 | Livestock killed | No | 21 |
| 7 | Water Schemes | No | 10 |
| 8 | Small scale irrigation schemes | No | 5 |
| 9 | Houses | No | 6 |
Source: Federal Multi-Agency Assessment Mission, 2006
In the trade sector in addition to traders lost their properties shown in table 3.5, investors involved in coffee processing, dairy product processing industries also lost huge sum of money. As per Dire Dawa Investment Office Assessment Report in Federal Multi-Agency Assessment Mission (2006), 10 investors have lost 13,162,981 Birr due to property damage by flood.
This has a negative implication on the city’s future development in the investment sector on one hand and also it affects the investor’s interest to invest their capital in the city on the other hand. Moreover, the shopping centre which was constructed within the flood plain with a cost of 1,998,700.00 Birr is totally damaged by the 2006 flood. This was the big mistake committed by the city administration at the then period investing such huge sum of money for construction of building in a vulnerable place without considering protection.
Indirect damage from floods includes the long term effects on the economy of disrupted businesses, interrupted savings and expenditure patterns and psychological damage to households and the work force. These effects were clearly demonstrated by the Survey, which showed the unbearable impact of being displaced, resulted in waiting handouts and/or remittances from family elsewhere. For instance, in 2006 flood, 9,956 people were displaced, of which 40% of households lost their business or jobs (as suggested by the Survey) resulting in the family having to survive on remittances from elsewhere or from handouts of the Dire Dawa Administration or other aiding organizations.
In agricultural sector the indirect loss include the amount of income foregone which farmers expect from the sale of by-product production of their animals (cows) and also the amount of money they expend until the next cropping season for the purchase of food crops. Farmers usually consume at home part of their product which they produce on their plots of land; the amount farmers expend for the purchase of farm tools which was damaged by floods; and government subsidies for the purchase of seeds are included in the indirect impact, which accounts the loss of 1738632 Birr (Federal Multi-Agency Assessment Mission, 2006). This is the amount incurred for reconstruction of SWC structures, purchase of seeds and farm tools. The field survey reveals that the amount incurred for indirect damage is beyond the cost mentioned above however; due to poor recordings of data it is difficult to portray the exact Figures of damages. Cost of demolition and the removal of debris brought by the flood is also another indirect cost incurred by the city administration.
Generally, due to shortage of data availability and poor data recording practices the indirect impact assessment is not deep as expected, however, the overall socio-economic impact in the 2006 flooding compared to other flooding periods is exceptional high and severely affected both the rural and urban socio-economic sectors. From the records the last four flood events occurred during 1981, 1994, 2004 and in 2005 (Fig. 3.15), are the major flood disasters that caused significant human casualty. Moreover, the casualties the flood caused have shown an increasing trend. The flood in the year 2006 was exceptionally high in its magnitude and the damage it caused as compared to the flooding event in the preceding years. Therefore, the most devastating flood in the history of Dire Dawa occurred on the 6th of August, 2006. This flood is the worst of its kind which resulted in the loss of more than 250 human lives; and property damages is also more than ever before. High magnitude flood also occurred in the year 2010 and inflicted an amount of 28,321,436.00 ET. Birrdamages on property and standing crops (Dire Dawa Rural Development Bureau, 2010).This time there was no fatality due to flood was occurred at day time and people were able to evacuate to a safer place.

Fig. 3.15. Trends of flood affected people and fatalities in Dire Dawa city from 1981-2006 flooding periods (source: adapted from DPPC, 2006).
4. Conclusions
The increasing intensity of rainfall mainly due to climate change accompanied by land use change, particularly the expansion of urbanized areas and cultivation land at the expense of wood and shrub lands are the causes of potential generation of flash floods in the catchment. The increased trend of sand deposition in the impact area and the conversion of marginal wood land areas to farmlands witnessed the increased rate of sediment transportation to downstream and this in turn has been responsible for rising of the river bed and also causing Dechatu River to burst its bank and flooded the residential areas.
Increasing population growth in the city especially as a result of high rate of migration; and lack of settlement space for the migrants has pushed them to occupy flood plain areas where increasing vulnerability to flood disaster is imminent. The migrants residing within the flooding zone accompanied by mushrooming of informal settlements are increased flood disaster vulnerability in the city.
Ethiopia lacks a comprehensive land use policy other than the water laws proclaimed in 1994. There is lack of land use policy in Ethiopia that prohibits farmers from using marginal land that are not suited for farming. Sustainable land use must be planned according to the land capability classification in order to realize the full productive potential of agricultural land. The current land use system results in deforestation, cultivation of steep slopes and intensification into flood plains which exacerbate flooding with its serious impacts.
The 2006 flood impact on the socio-economic sector of Dire Dawa was so severe that the extent of its impact is incomparable with other flood disasters occurred in the flooding history of Dire Dawa city. In the infrastructural sector floods caused severe damages on roads power and telephone transmission lines, and blocked the city’s communication to other regions in the country. In the economic sector flooding impact was so severe that it damaged business centres; small market places with their properties which left property owners impoverish; damaged standing crops; drowned cattle.
The overall impact of the 2006 flood on the socio-economic sector of the city was exceptionally high compared to other periods of flood impact. Loss of more than 100 million Eth. Birr worth of property, of which individuals’ property is also significantly high and will take many years to recover. Moreover, the flood also appears to be having a long term impact on the Dire Dawa Administration economy due to the divergence of the government budget to reconstruction and rehabilitation.
Very poor and/or absence of flood early warning system is one of the major constraint of flood disaster mitigating effort in the city of Dire Dawa. The 2006 severe disaster is partly caused due to lack of warning alert that could awaken the community to evacuate to safer places.
The increasing trend of flooding impact on one hand particularly what has happened in the year 2006 and the lesser attention given particularly for non-structural measures indicates that floods and its massive disasters will continue to occur in the future and will cause even higher damages.
Generally, the 2006 flooding impact was so severe that it caused unprecedented damages on the socio-economic and infrastructural sectors of the city. The severity of the destruction is mainly due to
• High intensity of rain that fell in the upland areas of the catchment in the 5th of August, 2006 - the flood hit the city in the middle of the night while people were in deep sleep
• Absence of early warning system in the city has hardly affected flood information transfer to the community, which is one of the major causes of increased death toll and property damages in the 2006 flooding.
Flood is a serious obstacle of the socio-economic development of the city of Dire Dawa. Every year large amount of property has been damaged by floods. One of the major causes of flooding in the city is related to land-use change. Therefore, Policy makers should give due consideration to the issue and ratify land-use policy. Land-use policy that regulates the allocation of land for appropriate activities is needed to minimize and avert abusive use of land and land based resources. Moreover, the land-use policy protects flood plains from being occupied by illegal settlers which affects the morphology of the river and resulted in the occurrence of floods. Therefore, enactment of land-use policy will help to delineate the flooding zone and enables to create normal relationship between the River and the community.
A modality would need to be established to ensure communication linkages between woreda2officials in highland areas receiving heavy rainfall and those downstream that are at risk of flooding. When intense flood-bearing rains fall in highland areas, concerned woreda officials would alert their downstream counterparts who in turn would alert the communities at risk. This method has proven successful in the case of limited number of people in the upland who used to alert their relatives in Dire Dawa during heavy rainfall in the upland (Kersa, Dengego, Kulubi and Haramaya) and able to save lives.
So as to apply this approach more effectively and widely, the MoWR should be involved and instruct and ensure that its river gauge observers or workers assigned especially in flood prone areas generate and provide high risk real time information on river levels and possible flooding threats to the local administrative authorities. Information to the people could be disseminated through electronic media. Moreover, the early warning information should also be equipped with placement of siren at essential corner of the city so as to alert the people in order to take necessary precaution when there is instance of flooding risk. To coordinate this activity and other issues related to flood disaster mitigation, there should be specifically setup body responsible for coordination of flood disaster mitigation task in Dire Dawa city.
Promote the implementation of community-based integrated watershed management between the upland part of neighbouring regional states and Dire Dawa city administration. The Integrated Watershed Management minimizes soil loss through run-off and increases the ground water potential through increased infiltration and rehabilitates the degraded environment through reforestation program. This in turn protects the potential risk of flooding in the downstream area.
Acknowledgments
The author is indebted to the referees who posed key points, stimulated discussion, and greatly improved the general quality of the manuscript; and to the publisher, Public science framework and Journal of Social Sciences and Humanities (JSSH) who is willing to publish this manuscript. The author is also indebted to the staff of the Geography Department of Dire Dawa University for their assistance during the field work. The National Meteorological Agency of Ethiopia is acknowledged for providing the rainfall data of the stations in Dechatu catchment.
References
- Adikari Y., Yoshitani J., Takemoto N., and Chavoshian A., 2008, Technical Report on the Trends of Global Water-related Disasters, A revised and updated version of 2005 report. Public Work Research Institute. Tsukuba, Japan.
- Adikari Y. and Yoshitani J., 2009, Global Trends in Water-Related Disasters: an insight for policy makers.UNESCO, 7place de Fontenoy, 75352 Paris, France.
- Asian Development Bank, 2004, Disaster and Emergency Assistance Policy.http://www.adb.org/Documents/Policies/Disaster_Emergency/default.asp
- Calder, Ian R., 1999, The Blue Revolution, Land Use and Integrated Water Resources Management. London: Earthscan publications Ltd.)
- DagnachewLegesse, Vallet-Coulomb, C. and Gasse, F., 2003, Hydrological response of a catchment and land use change in tropical Africa: Case study south central Ethiopia. Journal of Hydrology 275: 67-85.
- Dire Dawa Administration Rural Development Bureau, 2010. April 2010 Flood Impact assessment Report(un publisheddocument).
- Disaster Prevention and Preparedness Commission, 2006, Dire Dawa flood Crisis, Consolidated appeal process.
- Federal Disaster Prevention and Preparedness Agency, 2007, Regional summary of Multi-Agency Flood Impact assessment of 2006. Addis Ababa, Ethiopia
- ICSU-Africa, 2007, Natural and human –induced hazard and disasters in Sub-Saharan Africa.http://www.icsu-africa.org/docs/DocSP03.1.pdf
- Integrated Development Plan(IDP), 2006, Integrated development plan of Dire Dawa Administration, 2006/7- 2010/ 2011. BerhanenaSelam Printing Press, Addis Ababa,Ethiopia.
- Ministry of Water Resources, Ethiopia, 2006, Oda-Gunufeta-Cherecha-Dechatu Watershed in Dire Dawa administration and East Harergezone-Oromiya, Integrated Watershed management. Term of Reference Draft.
- UN-HABITAT, 2008, Dire Dawa Urban Profile, UNON, Publishing Services Section, Nirobi, Kenya.
- UNCEF, 2006, UNICEF Humanitarian action ETHIOPIA DonersUpdate.http://www.unicef.org/videoaudio/PDFs/Ethiopia_DU_22_Dec_06_-rev.pdf
- WMO and GWP, 2005, Associated program on Flood Management: Overview situation paper on flood management practices, edited by Technical Support Unit.
- World Bank, 2003, Building Safer Cities, the future of disaster risk.Alcira, Margaret Arnold,and Anne Carlin (ed.). World Bank, 1818 H street NW, Washington, DC 20433, USA.
- World Meteorological Organization, 2009, Guidelines on Analysis of Extremes in a changing climate insupport of informed decisions for adaptation. Chairperson publications Board, Switherland.
- YonasTadesse; DereseKumsa; W A Khan, 2013, Causes and Socio-Economic Impacts of Ephemeral Rivers Flooding, the Case of Dechatu River Flooding in Dire Dawa, Ethiopia (Un published document).


