
Journal of Social Sciences and Humanities, Vol. 1, No. 2, May 2015 Publish Date: Apr. 22, 2015 Pages: 59-66
Consumers Consider University-Licensed Merchandise: Doll Prototypes as Gifts, Collectibles, and Decorative Accessories
Paulette Hebert1, *, Hyun-Joo Lee2, Celia Stall-Meadows3
1Design, Housing and Merchandising, Oklahoma State University, Stillwater, OK, USA
2Retail, Merchandising and Product Development, Florida State University, Tallahassee, FL, USA
3Curriculum and Instruction, Community Care College, Tulsa, OK, USA
Abstract
The purpose of this study was to identify consumer characteristics and preferences toward university-licensed collectible merchandise, which may influence the final design of the merchandise prior to mass production and aid the university in marketing the products to consumers. Specifically, this exploratory research investigated consumers’ opinions about university-licensed prototype dolls created in the likeness of the iconic university mascot and a cheerleader. After viewing laminated pictorial representations of the six doll prototypes at the University’s creativity bazaar, participants were surveyed on preferred doll characteristics, likelihood of purchasing, and anticipated end use, such as self-purchasing for collections or to give as gifts. A 12-question paper survey was completed by 84 adults, including university faculty, students, staffs, and bazaar attendees. Findings revealed the mostly female (76.2%) respondents expressed a willingness to pay more per doll than did male respondents, further validating a recommendation to market primarily to women. Also, most respondents preferred to purchase dolls as gifts or for a doll collection on display. Results were communicated to the doll manufacturer for potential revisions to the prototypes prior to production in order to increase popularity and potential sales. The study limitations included a small sample size and the large percent of female participants, and university faculty and staff members so the results may not be generalizable to the general population.
Keywords
University-Licensed Merchandise, Doll Collecting, Gift Giving, Displaying Collections, Consumers, Prototype
Received: April 3, 2015
Accepted: April 12, 2015
Published online: April 20, 2015
@ 2015 The Authors. Published by American Institute of Science. This Open Access article is under the CC BY-NC license. http://creativecommons.org/licenses/by-nc/4.0/
1. Introduction
Appropriate market research may reduce the failure rate of new product launches. Firms should identify unique points of difference in new products and test the market to determine if these points of difference actually satisfy the unmet needs of consumers. Consumers can help to identify preferred product options and features of prototypes prior to mass production.
Market research is usually considered a necessary component of the preproduction stage, even for the most basic or staple products. It is a logical assumption, then, to investigate consumer preferences toward fashion and accessory products, collectibles, or gift items. These items often pose a greater failure risk for manufacturers and marketers, since consumers’ purchases are based on wants, rather than needs. Collectible dolls are an example of consumer products that would be purchased primarily on the basis of appearance, so marketers need to know that consumers find them attractive prior to investing in production and inventory.
1.1. Doll Collecting and Gift Giving
Contrary to the notion that dolls are toys for children, collectible dolls are usually too fragile, elaborate, or expensive for children’s toys (Ayoub, 2003). Most collectibles are removed from ordinary use and are no longer utilitarian items; and in the case of collectible dolls, they are not intended for play (Slater, 2001). Collecting is defined as "the process of actively, selectively and passionately acquiring and possessing things removed from ordinary use and perceived as part of a set of non-identical objects or experiences" (Belk, 1995, p. 67). Other researchers define a collectible or collectible asset as "an object that an individual gathers according to a set of procedures that guide its search, acquisition, and maintenance...and that belongs to an ordered and limited group of assets" (Blanco-González, Martín-Armario, & Mercado-Idoeta, 2012, p. 165).
Doll collectors are usually adult females, particularly baby boomers. Danziger (1995) found that the average doll collector is female, married, affluent, well educated, mature, employed, with no young children at home, and an existing collector of other objects. Other researchers found that collectors generally are predisposed to collecting and enjoy opportunities to demonstrate their status and uniqueness (Blanco-González et al., 2012). Kleine, Kleine, and Kernan (1993) reported that consumer’ self-identity may be linked to types of purchases; that is, consumers buy products that fit or are congruent with their social roles or identities, such as going to college, participating in athletic activities, or enjoying recreation.
Collectible dolls also are given as gifts. Gift giving and receiving has increased in recent decades, so companies are capitalizing on the gift market (Cruz-Cardenas, 2014). Often, gifts have associated cultural meanings (McCracken, 1986) and they develop private and emotional meanings over time (Cruz-Cárdenas, 2012; Richins, 1994).
In a 1995 survey, Danziger determined that doll collectors wanted manufacturers to pay careful attention to details. Collectors may be sensitive to the nuanced qualities that differentiate one doll from another, such as the quality of the wig, eyes, hands, and feet; and the realistic, lifelike, and well-sculpted appearances of the dolls. Danziger (1995) noted that the majority of respondents looked for dolls to purchase that matched their interior décor.
1.2. Displaying Collections
Collectors express their values in a living or working space by displaying collectibles (Kaye, 2002; Martin & Guerin, 2006). Worker satisfaction and productivity are linked to the ability to display personal items in the workplace. According to Martin and Guerin (2006), a person’s satisfaction and productivity may be increased if that person is permitted to showcase items that reflect his or her values and culture. As the typical doll collector ages and moves toward retirement, she will need areas in her home to display her collection. Hanson (2003) suggested that interior designers plan for display areas in housing so that the older adults may showcase meaningful belongings.
1.3. New Concept Testing
Because of the high failure rate of new products, companies typically test a new concept prior to investing resources in new product development. New concept testing allows for early strategic planning based on feedback from potential consumers. Iuso (1975) defined concept testing as "a research strategy which attempts to obtain consumers’ reactions to the value-laden meanings which comprise a concept in advance of major development expenditures" (p. 228). He recommended that researchers prepare appropriate idea stimuli and then collect multiple evaluation criteria through consumer feedback until the researchers have a complete picture of the product through the target consumers’ eyes. This includes how the consumers perceive the new concept, how well it addresses their wants or needs; their planned uses for the product; and how well the new concept captures consumers’ attention—in other words, a synthesis of consumer information made by skilled researchers (Iuso, 1975).
Whisman (2009) suggested that colleges and universities obtain buy-in from stakeholders when expanding the institution’s brand. This would include new concept testing, which has long been a corporate strategy during product development.
1.4. Collectible Marketing
Marketing collectibles is a way to add value to a brand. When an organization extends its iconic brand into collectible merchandise, the result is reinforced brand loyalty, greater exposure of the brand message, and profit maximization (Aaker, 1991; Slater, 2001).
There are several ways that the consumers in the collectible market may be served by. These include offering limited editions of collectibles; creating clubs for collecting members; marketing moderate or attractively-priced products; identifying and differentiating the objects in greatest demand for collectibles; and fostering the creation of social activities involving the collectors in order to perpetuate collecting (Blanco-González et al., 2012).
Businesses may offer collectible university-licensed products via multi-channel retailing. This allows companies to reach remote alumni and collegiate sports fans. Yang, Park, and Park (2007) reported that local retail stores are the main channel for selling university-licensed products, although online retailing is useful for reaching remote markets.
1.5. University Licensing
A university may enhance the school’s overall higher education reputation through strategic branding (Bunzel, 2007). Collegiate licensing is part of strategic corporate branding for colleges and universities. The benefits are twofold: The school’s reputation is enhanced and revenue is increased. In addition to the growth in university-licensed apparel, other product areas have realized increased sales. The Collegiate Licensing Company (CLC) ranks the top 25 licensing companies for non-apparel products (CLC, 2012). Females, alumni, and future students are key customers of these products and unique product offerings are seen as an anticipated growth sectors (Bhonslay, 2003; Hoover, 2004).
The purpose of this study was to identify consumer characteristics and preferences that: 1) may influence the final design of the merchandise prior to mass production and 2) aid the university in marketing the products to consumers. This study investigated potential consumers’ perceptions of custom doll prototypes proposed as new University-licensed merchandise. The study also explored consumer demographics, adoption intentions, willingness-to-pay, and anticipated end-use of the merchandise.
2. Methods
2.1. Background and Process
The university administration expressed interest in the development of a custom line of quality merchandise which could be used to promote the university, to increase university spirit, and to give as donor gifts. Not long before, an alumna of the university had assumed an executive position with a well-known and highly respected doll company. The current researchers, in collaboration with the university president’s office, contacted the alumna and began a dialogue regarding increasing the university community’s awareness of dolls as gifts, collectibles, and decorative accessories and regarding the creation of new university-licensed merchandise, collectible dolls.
Based on a review of literature and the new concept testing recommendations by Iuso (1975), the researchers began developing new product concepts for a university-theme doll. The university’s public relations and legal department provided the doll company with photographs of the university’s mascot, Pantone color numbers, doll concept ideas, and licensing contracts. The doll company sent preliminary images of doll concepts in costumes inspired by the university’s mascot. The concepts were refined based on stakeholder recommendations and the doll company modified the early prototypes into advanced prototypes of four female dolls and two male dolls. Dialogue continued regarding target market, minimum runs, retail channels, packaging, royalties, and price points for varying level of dolls’ costume materials and details, such as style and materials of accessories.
The advanced doll prototypes were displayed in an on-campus exhibit, along with a display of some of the doll company’s standard lines. Print and video media representatives were in attendance (Habib, 2009). The campus exhibit ran for three weeks and numerous university stakeholders and outside groups, such as Girl Scout troops and doll collector clubs, toured the exhibit. A sign-in book was provided for guest comments that were forwarded to the doll company. Based on the interest generated by the exhibit and the written comments, the researchers decided to move forward with a formal survey.
2.2. Survey
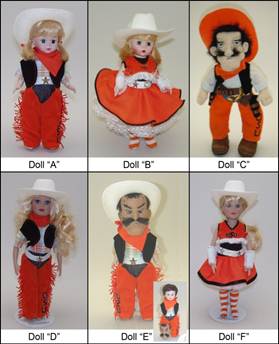
Figure 1. Six Doll Prototypes
The survey gathered information from consumers to make a final decision on mass production. The survey was accepted by the University’s Institutional Review Board. It was administered at the University’s first annual creativity bazaar; a fair-like venue. The survey contained three demographic questions (gender, age, and university affiliation) and nine questions about consumer preferences. The survey was accompanied by laminated pictorial representations of the six doll prototypes labeled A-F (See Figure 1). These were displayed on a table, available for inspection by the participants before and during survey administration. The pictorial representations consisted of male and female dolls, dressed in attire that reflected the university’s colors, mascot, and themes.
Participants reviewed the doll pictures and gave feedback on their perceptions, purchase intentions, willingness-to-pay, and anticipated end use of the merchandise. Table 1 shows the relevant survey questions that measured consumer attitudes toward the dolls.
Table 1. Survey Questions that Measured Consumer Attitudes
| Survey measurements | Actual questions |
| Willingness-to-pay | What is the most that you would be willing to pay per doll for the doll model(s) you selected in the previous question? |
| Anticipated end use | If you would display the doll, where would you display it? Have you previously used dolls as display items? Where have you previously displayed dolls? For whom would you purchase one of the dolls? |
| Purchase intentions | Which of the dolls shown in the images would you consider purchasing? Where would you prefer to purchase a doll? For what purpose would you purchase one or more of the dolls? |
| Consumer perceptions | What, if anything, would you like to change about the look of the doll prototypes? (Please explain). |
3. Results
The convenience sample was composed of people in attendance at the creativity bazaar. The creativity bazaar venue served two purposes: It was located in a high traffic area to collect the maximum data on consumer preferences toward a creative licensing venture; and it served as an opportunity to increase the University community’s awareness of the soon-to-be-available merchandise. The survey was completed by 84 adults (76.2% female), including university faculty, students, staff, and bazaar attendees. The sample represented potential consumers between 18 and 70 years old. When asked about their affiliation with the University, about a third (34.5%) of the respondents indicated they were staff members, while about one quarter each said they were faculty members (26.2%) and undergraduate students (25.0%). The respondent profile is presented in Table 2.
Table 2. Respondent Profile
| Demographics | n | % |
| Gender | ||
| Male | 20 | 23.8 |
| Female | 64 | 76.2 |
| 84 | 100 | |
| Age | ||
| 20 years old or less | 6 | 7.1 |
| 21-25 | 17 | 20.2 |
| 26-30 | 7 | 8.3 |
| 31-40 | 15 | 17.9 |
| 41-50 | 15 | 17.9 |
| 51-60 | 19 | 22.6 |
| 61+ | 3 | 2.4 |
| 82 | 97.6 | |
| University affiliation | ||
| Undergraduate students | 21 | 25.0 |
| Graduate students | 11 | 13.1 |
| Faculty | 22 | 26.2 |
| Staff member | 29 | 34.5 |
| Other | 1 | 1.2 |
| 84 | 100 |
Respondents were asked, "What is the most that you would be willing to pay per doll for the doll model(s) you selected in the previous question?" This question was measured on 10 categories, including $9.99 or less; $10.00-15.00; $15.01-20.00; $20.01-25.00; $25.01-30.00; $30.01-35.00; $35.01-40.00 $40.01-45.00; $45.01-50.00; and 50.01 or more. The category most selected was $20.01-25.00 (20.2%, n = 17), followed by $10.00-15.00 (19.0%, n = 16). Sixty six percent of the respondents were willing to pay $30 or less.
The results of the current study were examined to determine if the means of willingness-to-pay dollars would differ by gender, age, and university affiliation. Thus, an independent t-test was utilized. Respondents were divided into two groups by gender (male vs. female), age (aged 40 years old or less vs. over 40 years old), and university affiliation (students vs. faculty and staff), respectively. The results of the analysis are shown in Table 3. There was a significant difference in the maximum dollar amount of willingness-to-pay between male and female (t = -2.078, p < 0.05). In other words, female consumers were willing to pay more dollars per doll than male consumers. No significant differences were found according to age and university affiliation.
Table 3. Independent T-Test Results
| n | Mean | SD | df | t | p | |
| Gender | 79 | -2.078 | 0.041 | |||
| Male | 19 | 3.16 | 1.68 | |||
| Female | 62 | 4.11 | 1.78 | |||
| Age | 75 | -0.416 | 0.679 | |||
| 40 or less | 44 | 3.80 | 1.95 | |||
| 41+ | 33 | 3.97 | 1.63 | |||
| University affiliation | 78 | -0.810 | 0.421 | |||
| Student | 32 | 3.69 | 1.80 | |||
| Faculty and staff | 38 | 4.02 | 1.80 |
Note. Dependent variable is willingness-to-pay dollars.
The survey also collected data on consumers’ anticipated end use of a purchased doll. Respondents were allowed to select more than one choice for the question, "For what purpose would you purchase one or more of the dolls?" Of the purposes selected (n = 141), the most frequently occurring responses were "as a gift" (37.6%, n = 53); "for display" (27.7%, n = 39); and "in a collection" (24.8%, n = 25). Display locations were subdivided into "display at the office" (19.1%, n = 27), "display at home" (7.1%, n = 10), and "display in another location" (1.4%, n = 2). Further examination of mean differences of willingness-to-pay amounts was conducted across groups that were classified on the basis of the anticipated end use. A one-way analysis of variance (ANOVA) was conducted among three groups (collectibles vs. gifts vs. display). Significant differences were found in the maximum dollar amount of willingness-to-pay by the anticipated end use (F = 3.399, p < 0.05), indicating that consumers who purchase dolls as collectibles were willing to pay more dollars than those who purchase dolls as gifts and for display. However, there was no significant difference in willingness-to-pay dollars between respondents who purchase dolls as gifts and those who purchase dolls for display (See Table 4).
Table 4. One-Way ANOVA Results
| n | Mean | SD | df | Mean square | F | p | |
| End use | 2 | 10.261 | 3.399 | 0.038 | |||
| Collectibles | 25 | 4.60a | 1.87 | ||||
| Gifts | 46 | 3.48b | 1.64 | ||||
| Display | 10 | 4.00b | 1.83 |
Note. Dependent variable is willingness-to-pay dollars. Means with different superscripts differ significantly at p < 0.05 in the Bonferroni pairwise comparison.
The current study further examined whether consumers’ anticipated end use was related to gender, age, and university affiliation. As presented in Table 5, age and university affiliation were found to be associated with the anticipated end use given that chi-square significances were achieved for age (χ2= 8.385, p < 0.05) and university affiliation (χ2= 13.027, p < 0.01). Among respondents who were aged 40 or younger, almost half of the respondents (49.8%) indicated they would purchase a doll "as a gift" (n = 22), followed by "in a collection" (31.1%, n = 14) and "for display" (20.0%, n = 9). On the other hand, among respondents who aged 41 or older, 70.6% of the respondents claimed they would purchase a doll "as a gift" (n = 24), followed by "in a collection" (29.4%, n = 10). There was no response among respondents, aged 41 or older, indicating that they would purchase a doll "for display."
With regard to university affiliation, 43.8% of the student respondents reported that they would purchase a doll "as a gift" (n = 14); 28.1% "in a collection" (n = 9); and 28.1% "for display" (n = 9). Among faculty and staff, 66.7% of the respondents claimed that they would purchase a doll "as a gift" (n = 34), followed by "in a collection" (31.4%, n = 16). Only 2.0% of the respondents indicated that they would purchase a doll "for display" (n = 1).
Table 5. Anticipated End Use Cross Tabulated with Age and University Affiliation
| Age | Total | Chi-square test | ||
| 40 or less | 41+ | |||
| End use | χ2 = 8.385 | |||
| Collectibles | 14 (31.1%) | 10 (29.4%) | 24 (30.4%) | df = 1 |
| Gifts | 22 (48.9%) | 24 (70.6%) | 46 (58.2%) | p = 0.015 |
| Display | 9 (20.0%) | 0 (0.0%) | 9 (11.4%) | |
| Total | 45 (100.0%) | 34 (100.0%) | 79 (100.0%) | |
| University affiliation | ||||
| Student | Faculty & Staff | Total | Chi-square test | |
| End use | χ2 = 13.027 | |||
| Collectibles | 9 (28.1%) | 16 (31.4%) | 25 (30.1%) | df = 1 |
| Gifts | 14 (43.8%) | 34 (66.7%) | 48 (57.8%) | p = 0.001 |
| Display | 9 (28.1%) | 1 (2.0%) | 12 (12.0%) | |
| Total | 32 (100.0%) | 51 (100.0%) | 83 (100.0%) | |
Note. () is the percentage within the same age and university affiliation.
The survey collected data on consumers’ preferences for retail channels to purchase a doll. Respondents were allowed to select more than one place for purchasing a doll. Four places were investigated: a student union, an alumni center, online, and in an off-campus store. The place most selected was "student union" (63.1%, n = 53), followed by "online" (47.6%, n = 40). A small number of responses indicated they would purchase a doll at an "alumni center" (2.4%, n = 2). The current study also examined whether consumers’ preferences for purchase locations was related to gender, age, and university affiliation. There was a significant difference by gender in selecting a "student union" as a preferred place for purchasing a doll. Only 42.1% of males (n = 8) indicated that they would prefer to purchase a doll at a student union while 71.4% of females (n = 45) preferred a student union. The chi-square test was significant (χ2= 5.491, p < 0.05). Thus, it seems that female consumers showed greater preference for purchasing a doll at a student union than male consumers. Another gender difference of where to purchase a doll was noticed, although it was marginal. Over two-thirds (68.4%) of males (n = 13) indicated that they would prefer to purchase a doll via online while 42.9% of females (n = 27) did. Although the chi-square difference was significant at 0.1 level (χ2= 3.818), it was probable that male consumers showed a greater preference for purchasing a doll via "online" channels than female consumers. On the other hand, no significant relations were detected by age and university affiliation (See Table 6).
Table 6. Places for Purchasing a Doll Cross Tabulated with Gender
| Gender | Total | Chi-square test | ||
| Male | Female | |||
| Student union | χ2 = 5.491 | |||
| No | 11 (57.9%) | 18 (28.6%) | 29 (7.4%) | df = 1 |
| Yes | 8 (42.1%) | 45 (71.4%) | 53 (64.6%) | p = 0.019 |
| Total | 19 (100.0%) | 63 (100.0%) | 82 (100.0%) | |
| Online | χ2 = 3.818 | |||
| No | 6 (31.6%) | 36 (57.1%) | 42 (51.2%) | df = 1 |
| Yes | 13 (68.4%) | 27 (42.9%) | 2 (48.8%) | p = 0.051 |
| Total | 19 (100.0%) | 63 (100.0%) | 82 (100.0%) | |
Note. () is the percentage within the same gender
The current study also asked respondents, "Which of the dolls shown in the images would you consider purchasing?" and respondents were allowed to select more than one doll. Of six dolls offered to respondents, the doll most selected was doll "E" (51.2%, n = 43). The next most frequently selected doll was doll "A". Over one quarter of respondents (26.2%, n = 22) indicated that they would consider purchasing doll "A". The least frequently selected doll was doll "C" and only 15.5% of the respondents indicated that they would consider purchasing doll "C". Further examination investigated if respondent preferences for certain doll types were related to gender, age, and university affiliation. As shown in Table 7, gender was significantly related to doll "A" (χ2= 3.560, p < 0.1) and doll "D" (χ2= 2.958, p < 0.1); age related to doll "C" (χ2= 4.355, p < 0.05) and doll "F" (χ2= 2.854, p < 0.1); and university affiliation related to doll "E" (χ2= 4.270, p < 0.05).
More specifically, there was a significant gender difference in purchase intentions of doll "A" and doll "D". Only 10.0 % of male respondents (n = 2) indicated that they would consider purchasing doll "A" while 31.3% of female respondents (n = 20) did. Similarly, only 5.0% of male respondents (n = 1) claimed that he would consider purchasing doll "D" compared to 21.9% of female respondents (n = 14). Thus, it is likely that females had greater intentions to purchase doll "A" and doll "D" compared to males. In terms of age differences, among respondents who were aged 40 or younger, a small number of respondents (8.9%, n = 4) indicated that they would consider purchasing doll "C". On the other hand, over one quarter (26.5%, n = 9) of respondents aged 41 or older reported that they would consider doll "C". Somewhat differently, among the group of younger respondents, about one third (31.1%, n = 14) indicated that they would consider purchasing doll "F" compared to 14.7% of the respondents (n = 5) in the older group. Based on the results, we conclude that younger respondents had greater intentions to purchase doll "C" and fewer intentions to purchase doll "F". For the older respondents, the reverse was true. With regard to university affiliation, 37.5% of the students (n = 12) indicated that they would consider purchasing doll "E" compared to 60.8% of faculty and staff. Thus, it appears that faculty and staff had greater intentions to purchase doll "E" compared to students.
Table 7. Purchase Intentions of Dolls Cross Tabulated with Gender, Age, and University Affiliation
| Gender | Total | Chi-square test | ||
| Male | Female | |||
| Doll A | χ2 = 3.560 | |||
| No | 18 (90.0%) | 44 (68.8%) | 62 (73.8%) | df = 1 |
| Yes | 2 (10.0%) | 20 (31.3%) | 22 (26.2%) | p = 0.059 |
| Total | 20 (100.0%) | 64 (100.0%) | 84 (100.0%) | |
| Doll D | χ2 = 2.958 | |||
| No | 19 (95.0%) | 50 (78.1%) | 69 (82.1%) | df = 1 |
| Yes | 1 (5.0%) | 14 (21.9%) | 15 (48.8%) | p = 0.085 |
| Total | 20 (100.0%) | 64 (100.0%) | 84 (100.0%) | |
| Age | ||||
| 40 or less | 41+ | Total | Chi-square test | |
| Doll C | χ2 = 4.355 | |||
| No | 41 (91.1%) | 25 (73.5%) | 66 (83.5%) | df = 1 |
| Yes | 4 (8.9%) | 9 (26.5%) | 13 (16.5%) | p = 0.037 |
| Total | 45 (100.0%) | 34 (100.0%) | 79 (100.0%) | |
| Doll F | χ2 = 2.854 | |||
| No | 31 (68.9%) | 50 (78.1%) | 69 (82.1%) | df = 1 |
| Yes | 14 (31.1%) | 5 (14.7%) | 19 (24.1%) | p = 0.091 |
| Total | 45 (100.0%) | 34 (100.0%) | 79 (100.0%) | |
| University affiliation | ||||
| Student | Faculty & Staff | Total | Chi-square test | |
| Doll E | χ2 = 4.270 | |||
| No | 20 (62.5%) | 20 (39.2%) | 40 (48.2%) | df = 1 |
| Yes | 12 (37.5%) | 31 (60.8%) | 43 (51.8%) | p = 0.039 |
| Total | 32 (100.0%) | 51 (100.0%) | 83 (100.0%) | |
Note. () is the percentage within the same gender, age, and university affiliation.
The study asked, "If you would display the doll, where would you display it?" Respondents were allowed to select more than one method of display. The method most selected was "on a shelf." Out of all the method selections made (n = 96), over half (55.21%, n = 53) indicated that the respondent would display a doll "on a shelf." Furthermore, of all the respondents who answered this question (n = 71), 74.65 percent (n = 53) would display the dolls on a shelf. Out of all the method selections made (n = 96), almost one quarter (23.96%, n = 23) indicated display "in a glass front cabinet," 12.5% (n = 12) indicated display "on a desk," and 6.25% (n = 6) indicated display "on a table top." A small number of responses (2.08%) indicated "other display method." Respondents’ written comments indicated these additional "other" display methods included: "on a cabinet top with other dolls" and on a "bookshelf."
4. Discussion and Conclusions
This study is valuable because unique university merchandise represents a potential source of sales revenue for a school. Universities receive royalties from sales of university-licensed merchandise and the monies often support scholarships. This study provides an outline of the market research process for collectible dolls, identifies key variables for marketers to consider, and offers marketing recommendations to schools that desire to increase merchandise sales through unique product sales.
The researchers’ field notes revealed that males were reluctant to complete a survey about dolls. The western cultural norms discourage male interactions with dolls, so men are not recommended as a primary target customer group. Women were willing to pay higher prices for the dolls, further validating a recommendation to market primarily to women. A doll priced less than $30 may have the greatest chance of being purchased, because the findings showed that 66 percent of the respondents preferred dolls under this price point.
The purpose of a doll purchase was most often cited as a gift, but if sold as a collectible, the doll may command higher prices. Therefore, it is suggested that a school market the dolls as a limited-edition collectible, possibly with finite release dates, and encourage purchasers to consider giving the dolls as gifts. The university may want to offer the dolls via multichannel retailing venues, particularly in the campus student union or bookstore, as well as online. These two venues were shown to reach the vast majority of female customers. For males who might be interested in purchasing dolls as gifts, the online channel was the preferred venue. While males may not comprise a significant number of purchasers, it would be an opportunity to increase sales.
Before selecting a doll for mass production, it is recommended that a university test market several prototypes to determine the preferred characteristics. Since each university mascot has unique features, no standards for designs will be discussed. However, based on the findings, marketers should consider shelf appeal, clothing, accessories, hair, facial expressions, and realism.
The study limitations included the limited number of participants and the large percent of female participants. In addition, the lower-than-average socio-economic status of the city or University population may have decreased the reported dollar amount that respondents were willing to pay for this product. Many of the participants were students who lived in temporary housing, such as dormitories or small apartments, with plans to move upon graduation. These circumstances may have reduced their interest in displaying dolls or starting a collection. In addition, the study participants viewed two-dimensional graphic pictorials rather than the three-dimensional prototypes.
References
- Aaker, D. A. (1991). Managing Brand Equity. New York, N.Y.: The Free Press.
- Ayoub, N. (2003). Life like dolls: the collector doll phenomenon and the lives of the women who love them. The Chronicle of Higher Education, 50, A17.
- Belk, R. W. (1995). Colleting as luxury consumption: effects on individuals and households. Journal of Economic Psychology, 16(3), 477-490.
- Bhonslay, M. (2003). Higher education. Sporting Goods Business, 36(1), 24.
- Blanco-González, A., Martín-Armario, E., & Mercado-Idoeta, C. (2012). Collectors' buying behavior: a model based on attitudes and market heterogeneity. American International Journal of Contemporary Research, 2, 164-175.
- Bunzel, D. L. (2007). Universities sell their brands. Journal of Product and Brand Management, 16(2), 152-153. doi: http://dx.doi.org/10.1108/10610420710740034
- CLC. (2012). The collegiate licensing company names top sellers for fiscal year 2011-12. http://www.clc.com/News/Archived-Rankings/Rankings-Annual2012.aspx
- Cruz-Cardenas, J. (2014). The status of gifts in the receiver's life: reasons for the transformation of commercial products into special, common or hated objects. International Journal of Consumer Studies, 38(2), 139-145. doi: http://dx.doi.org/10.1111/ijcs.12075
- Cruz-Cárdenas, J. (2012). Use and disposition of a gift and the recipient's feedback in a collectivist environment. Journal of Consumer Satisfaction, Dissatisfaction and Complaining Behavior, 25, 130-148.
- Danziger, P. (1995). Doll collecting is poised for growth. Gifts & Decorative Accessories, 96(2), 99.
- Habib, N. (2009). All dolled up: OSU alum to introduce commemorative dolls. The Daily O’Collegian, 1.
- Hanson, J. (2003). Space in the home: morphology and meaning in the home life of older people. In J. W. Robinson, K. A. Harder, H. L. Pick & V. Singh (Eds.), Proceedings of the Environmental Design Research Association (EDRA) 34th Annual Conference: People Shaping Places Shaping People (pp. 7-15).
- Hoover, E. (2004). In logo parentis. Chronicle of Higher Education, 50(36), A56-A56.
- Iuso, B. (1975). Concept testing: an appropriate approach. Journal of Marketing Research, 12(2), 228-231.
- Kaye, H. J. (2002). It's not just an office, it's a vessel of self-expression. Chronicle of Higher Education, 48(22), B16.
- Kleine, I., Robert E., Kleine, S. S., & Kernan, J. B. (1993). Mundane consumption and the self: a social-identity perspective. Journal of Consumer Psychology, 2(3), 209-235.
- Martin, C. S., & Guerin, D. A. (2006). The interior design profession’s body of knowledge: 2005 edition. http://www.idbok.org/PDFs/IDBOK_2005.pdf
- McCracken, G. (1986). Culture and consumption: a theoretical account of the structure and movement of the cultural meaning of consumer goods. Journal of Consumer Research, 13(1), 71-84.
- Richins, M. L. (1994). Valuing things: the public and private meanings of possession. Journal of Consumer Research, 21(3), 504-521.
- Slater, J. S. (2001). Collecting brand loyalty: a comparative analysis of how Coca-Cola and Hallmark use collecting behavior to enhance brand loyalty. Advances in Consumer Research, 28(1), 362-369.
- Whisman, R. (2009). Internal branding: a university's most valuable intangible asset. Journal of Product and Brand Management, 18(5), 367-370. doi: http://dx.doi.org/10.1108/10610420910981846
- Yang, S., Park, J., & Park, J. (2007). Consumers’ channel choice for university-licensed products: exploring factors of consumer acceptance with social identification. Journal of Retailing & Consumer Services, 14(3), 165-174. doi: 10.1016/j.jretconser.2006.04.004.


