
Physics Journal, Vol. 1, No. 3, November 2015 Publish Date: Sep. 18, 2015 Pages: 200-203
Chemical Shift Studies of 3d Elements Mn, Cr and Cu K-edges by X-ray Absorption Spectroscopy (XAS) with INDUS-2 Synchrotron Radiation at RRCAT, Indore, India
Daisy Joseph*
Nuclear Physics Division, Bhabha Atomic Research Centre, Mumbai, India
Abstract
Mn, Cr and Cu K X-ray absorption edges were measured in various compounds containing Mn in Mn2+, Mn3+ and Mn4+ oxidation states, Cr in Cr3+ and Cr6+ oxidation state and Cu in 2+ states in different compounds. Few compounds are having tetrahedral coordination in the 1st shell surrounding the cation while others are having octahedral coordination. The measurements have been carried out at the energy dispersive EXAFS beamline at INDUS-2 Synchrotron radiation source at RRCAT, Indore. Energy shifts of ~ 8-16 eV were observed for Mn K edge in the Mn-compounds while a shift of 13-20 eV were observed for Cr K edge in Cr-compounds compared to their values in elemental Mn and Cr respectively. Cu showed an energy shift of 4-7 ev compared to the elemental Cu. The different chemical shifts observed for the compounds having the same oxidation state of the cation but different anions or ligands show the effect of different chemical environments surrounding the cations in determining their X-ray absorption edges in the above compounds. The above chemical effect has been quantitatively described by determining the effective charges on Mn, Cr and Cu cations in the above compounds.
Keywords
INDUS, XAS, X-ray Absorption Edges, Oxidation State, Cation, Energy Shift
Received: August 6, 2015
Accepted: September 5, 2015
Published online: September 17, 2015
@ 2015 The Authors. Published by American Institute of Science. This Open Access article is under the CC BY-NC license. http://creativecommons.org/licenses/by-nc/4.0/
1. Introduction
The change in a particular X-ray absorption edge position of a metal in a compound, from the edge position in the pure elemental state, is known as the chemical shift DE. It is well known that when a metal takes part in chemical bonding during formation of a compound, the core electron binding energy changes since the metal atom generally transforms to a positive ion and thus the electrostatic potential felt by a core electron increases. Although the core electrons do not directly participate in the formation of a chemical bond, their energies are changed slightly due to the changes in the chemical or crystallographic surroundings of the absorbing atom, which alter the interaction with electrons in the valence orbital. Thus as the valence or oxidation state of the metal increases the absorption edge ideally should increase towards higher value. However, as many workers have observed [1–8] the absorption edge shift is governed by many other factors also viz., nature of the ligands to the metal ion, coordination numbers, covalent character of the bond, electronegativity of the anion, etc. or in other words the chemical environment of the metal ion. The change in absorption edge could be attributed to different chemical environments of a metal ion having same oxidation state which is generally known as chemical effects.
In the present study, we have investigated the chemical effects in different compounds of Mn viz., MnCl2, MnCO3, MnSO4.H2O, Mn2O3, CaMnO3 and MnO2, where Mn is present in different oxidation states (2+, 3+ and 4+ states) and in different compounds of Cr viz., CrCl3.6H2O, Cr2O3, Cr(SO4)3, Cr2(NO3)3.3H2O, K2Cr2O7 and K2CrO4 in which Cr is present in 3+ and 6+ oxidation states. And Cu viz., CuO, Cu(CH3CO2)2, Cu(CO3)2, and CuSO4 where Cu is present in the same oxidation state (2+) by measuring the K X-ray absorption edges of Mn, Cr and Cu in these compounds by X-ray absorption spectroscopy measurement using the indigenous INDUS-2 Synchrotron radiation source. It should be noted that, most of the works particularly on copper compounds [5–8] reported in the literature are based on the data obtained by laboratory EXAFS measurements using weak conventional X-ray sources and hence lack reliability.
2. Experimental
The Mn, Cr and Cu K-edge XAFS spectra of the samples have been recorded at the newly established BL-8 dispersive EXAFS beamline at 2 GeV INDUS-2 Synchrotron source at Raja Ramanna Center for Advanced Technology (RRCAT), Indore, India [Fig 1]. [9–12]. The beamline has a 460-mm long Si (111) crystal having 2d value equal to 6.2709 Å mounted on an elliptical bender, which can bend the crystal to take shape of an ellipse [9]. The elliptical optics offers minimum aberra-tion. The radiation transmitted through the sample is detected by a position-sensitive CCD detector having 2048 pixels. The plot of absorption versus photon energy is obtained by recording the intensities I0 and IT, as the CCD outputs, without and with the sample, respectively, and the absorption coefficient l is obtained using the relation: I T = I 0 e-µx
Where, x is the thickness of the absorber. For recording the EXAFS spectrum on the dispersive EXAFS beamline, the crystal bender and the goniometer have been set to cover the energy range of the Cu K-edge absorption spectra. For energy calibration of that par-ticular setting, absorption spectra at Cu K-edge of Cu metal foil and at Lu L3-edge of Lu2O3 powder have been recorded under the same setting of crystal bender and the goniometer.An energy resolution of approx 1 eV at 9 keV (E/DE=104), where a spatially resolved full band of 1 keV falls on the 2000 pixels of the CCD detector. However, in this case since we are only concerned with the XANES part (portion close to the absorption edge), the goniometer is positioned in such a way that a band of 150 eV is selected and spreaded over the 2000 pixels of the CCD yielding a much better energy resolution in this case (_0.1 eV). It should also be noted that the present measurement has been carried out with the Synchrotron radiation as source unlike the other results reported in the reference list where much weaker laboratory sources have been used. This, along with the very fast read out time of the CCD (300 ms) enables us to collect a large number of spectra within a reasonable time frame for each sample. Typically in this experiment, 200 spectra are recorded for each sample and the average was taken which results in high accuracy of the data obtained.

Fig. 1. INDUS-2 Synchrotron Source at RRCAT, Indore.
3. Results and Discussion
Fig. 4 shows experimental EXAFS (µ(E) versus E) spectra of elemental Cu foil and different compounds of Cu viz., CuO, Cu(CH3-CO2)2, Cu(CO3)2, and CuSO4. It can be seen that the ‘‘kink’’ observed in the absorption edge of Cu foil due to transition from the s-orbital to s–p hybrid orbital prior to the predominant s–p transition responsible for the ‘‘white line’’ [13] is absent in the Cu compounds. The ATHENA code available within the IFEFFIT soft-ware package [14] have been used for finding out the exact edge position (half edge step position) of Cu for all the samples which have also been shown in the Fig. 4. It is seen that though all the copper compounds studied here are having +2 oxidation state, the Cu K-edge shifts by different amount w.r.t. the Cu metal foil in the compounds, which can be attributed to the different chemical environment of Cu in these compounds or the so called ‘‘chemical effect’’. The edge shifts have been shown in Table 1 for the above four compounds along with the estimated experimental uncertainties and the edge shift in CuO is found to agree well with that reported by Agarwal et al. [13]. The shifts for the M n and Cr compounds are as follows
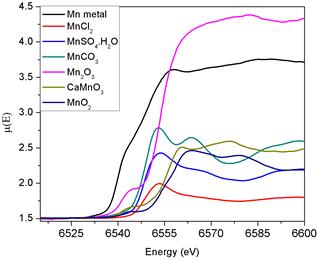
Fig. 2. XANES spectra of different Mn compounds around Mn K edge.

Fig. 3. XANES spectra of different Cr compounds around Cr K edge.
Table 1. Chemical shift and effective charge for four Cu compounds.
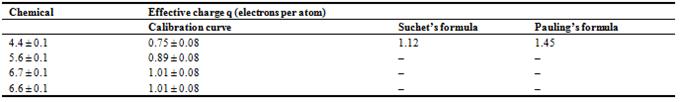

Fig. 4. Experimental EXAFS (µ versus E) spectra of elemental Cu foil and different compounds of Cu viz., CuO, Cu(CH3CO2)2, Cu(CO3)2, and CuSO4.
It should be noted here that estimation of the edge step from the µ versus E spectrum by the half edge step method does not involve any fitting or iteration process and hence there is no uncertainty involved in this method. Thus the uncertainty involved in estimation of the edge position and hence in the chemical shift, comes only from the experimental uncertainty in measurement of the spectrum. As has been discussed in the Section 1, the shift in absorption edges is highly modified depending upon the chemical environment around the central absorbing atom such as effective charge on the atom, electronegativity, oxidation state, etc. Various studies [1–8] have shown that all these effects can be quantitatively presented by ‘‘effective charge’’ (q). Formation of chemical bond in a compound involves redistribution of valence electrons of the constituent atoms and effective charge is a hypothetical parameter which gives a measure of the charge residing over the cation when it forms a bond with a ligand. Apart from the valence, it takes care of the electronegativity of the pair of atoms forming the bond, covalent nature of the bond, coordination number, etc. and thus quantitatively takes care of the chemical environment around the absorbing metal ions. For the Mn and Cr all procedures and calculations are identical. It may be seen in Ref 15
4. Conclusions
X-ray absorption spectroscopy measurements have been carried out at the Cu K edge around 8979 eV on elemental Cu foil and four Cu compounds viz., CuO, Cu(CH3CO2)2, Cu(CO3)2, and CuSO4 where Cu is present in oxidation state of 2+. The measurements have been carried out using the energy dispersive EXAFS Beamline at INDUS-2 Synchrotron radiation source at RRCAT, Indore. It has been observed that the Cu K edges in the compounds are shifted by different amount in the range of 4–7 eV compared to its value in elemental copper. Energy shifts of ~ 8-16 eV were observed for Mn K edge in the Mn-compounds while a shift of 13-20 eV were observed for Cr K edge in Cr-compounds compared to their values in elemental Mn and Cr respectively. It is concluded that as oxidation states increase the shifts tend to increase. Shifts may be small when oxidation states are of the same order. A sample of unknown oxidation state can be verified finding the order of shifts using Synchrotron EXAFS beamline at INDUS-II at RRCAT, Indore, India.
Acknowledgements
I wish to acknowledge the contribution from, S. Basu, A.K. Yadav, S.N. Jha and D. Bhattacharyya, Applied Spectroscopy Division, BARC for their contributions in the experimental work and also Dr A. Saxena Head, Nuclear Physics Division, BARC and Dr S. Kailas Ex-Director, Physics Group. BARC for their continuous support and guidance.
References
- M.N. Ghatikar, B.D. Padali, R.M. Nayak, J. Phys. C: Solid State Phys. 10 (1977) 4173.
- A.R. Chetal, P. Mahto, P.R. Sarode, J. Phys. Chem. Sol. 49 (1988) 279.
- V.K. Kondawar, C. Mande, J. Phys. C: Solid State Phys. 9 (1976) 1351.
- C. Mande, M.Y. Apte, Bull. Mater. Sci. 3 (1981) 193.
- A.K. Nigam, M.K. Gupta, J. Phys. F: Metal Phys. 4 (1974) 1084.
- M.M. Ballal, C. Mande, J. Phys. Chem. Solids 38 (1977) 1383.
- S.K. Pandey, A.R. Chetal, P.R. Sarode, J. Phys. Soc. Jpn. 59 (1990) 1848.
- H.K. Hinge, S.K. Joshi, B.D. Shrivastava, J. Prasad, K. Srivastava, Ind. J. Pure Appl. Phys. 49 (2011) 168.
- D. Bhattacharyya, A.K. Poswal, S.N. Jha, B. Sangeeta, S.C. Sabharwal, Nucl. Instrum. Meth. Phys. Res. A 609 (2009) 286.
- D. Bhattacharyya, A.K. Poswal, S.N. Jha, B. Sangeeta, S.C. Sabharwal, Bull. Mater. Sci. 32 (2009) 103.
- A. Gaur, B.D. Shrivastava, D.C. Gaur, J. Prasad, K. Srivastava, S.N. Jha, D. Bhattacharyya, A. Poswal, S.K. Deb,J. Co-ordin. Chem. 64 (2011) 1265.
- A. Gaur, A. Johari, B D Shrivastava, D.C. Gaur, S.N. Jha, D. Bhattacharyya, A. Poswal, S.K. Deb, Sadhana 36(2011) 339.
- B.K. Agarwal, C.B. Bhargava, A.N. Vishnoi, V.P. Seth, J. Phys. Chem. Solids 37 (1976) 725.
- M. Newville, B. Ravel, D. Haskel, J.J. Rehr, E.A. Stern, Y. Yacoby, Physica B 154 (1995) 208.
- D.Joseph, A.K. Yadav, S.N. Jha and D.Bhattacharyya,Bullettin of Materials Science Vol 6,No.36, 2013 pp 1067-1072.


