
International Journal of Energy Science and Engineering, Vol. 1, No. 4, September 2015 Publish Date: Aug. 23, 2015 Pages: 153-162
Environmental and Economic Analysis of Scenarios for Transition to Renewable Energy in the Iranian Electricity Supply System
Department of Energy Engineering, Graduate School of the Environment and Energy, Science and Research Branch, Islamic Azad University, Tehran, Iran
Abstract
Renewable energy resources are environmentally friendly and considered as a strategy for decreasing greenhouse gases (GHGs). This paper aims to model the Iran electricity supply system by using Long range Energy Alternative Planning system "LEAP" tool. For this purpose three long-term scenarios, including: reference (BL), current governmental policies (GP) and transition to renewable energies (RE) are used to analyze the effects of energy, economy and environment of each scenario on electricity supply sector until 2040.The final growth rate of electricity demand in GP scenario was less than the BL scenario and in RE scenario, it was less than the GP scenario. The structure of electricity supply system in BL and GP scenarios was approximately similar and combined cycle power plant supplied most of the electricity in these scenarios. In RE scenario by increasing the share of renewable energies in the electricity supply portfolio, 65% of the produced energy, was supplied from renewable resources. This structural change in the RE scenario is resulted in decreasing 157.5 million tons carbon dioxide equivalent of greenhouse gas (GHG) emissions compared to the BL scenario as well as 20% and 30% increase in the total production costs compared to BL and GP scenarios, respectively.
Keywords
Renewable Energy, LEAP Model, Electricity System Scenarios, GHG Emissions Reduction
Received: July 28, 2015
Accepted: August 9, 2015
Published online: August 19, 2015
@ 2015 The Authors. Published by American Institute of Science. This Open Access article is under the CC BY-NC license. http://creativecommons.org/licenses/by-nc/4.0/
1. Introduction
With Industrial and economic development, population growth and improving the living standards, energy demand especially electricity is rising rapidly. Since by increasing the electricity consumption, greenhouse gas (GHG) emissions from electricity generation is continually increasing, adopting policies to reduce these emissions is crucial. Most of the observable increase in average global temperature since the mid-20th century is due to the increases in anthropogenic greenhouse gas concentrations [1]. GHG emissions and abrupt climate change with irreversible adverse impact on water resources, ecosystems, human health, food security and coastal settlements are only parts of the environmental consequences of fossil fuel consumption.
While global GHG emissions reached to 53.5 Gt CO2eq per yrin 2012 [2], and Global CO2 emissions from fossil fuel combustion and industrial processes, increased in 2013 to the new record of 35.3 billion tons Gt CO2 [3], the energy supply sector was the largest contributor to global GHG emissions that accounts for 35 % of anthropogenic GHG emissions [4]. According to the IEA, Iran is among the first 10 largest greenhouse gas producer countries.
There are many alternatives for decreasing the GHG emissions from the energy systems while still satisfying the global demand for energy services. Some of these possible options are energy conservation and efficiency, fossil fuel switching, Renewable Energy (RE), nuclear and carbon capture and storage (CCS) [5]. This paper will concentrate on the role that the deployment of RE technologies can play in the mitigation of GHG emissions from the electricity generation system.
As well as having a large potential to mitigate climate change, RE can provide wider benefits. RE may, if implemented properly, contribute to social and economic development, energy access, a secure energy supply, and reducing negative impacts on the environment and health [5].
According to the Iranian government’s current plan for long term energy sector expansion, it is expected that demand for electricity will increase more than double by 2040[6].To respond to this demand and because of very low cost of fossil fuels in Iran, the current policy of electricity supply system is based on the use of natural gas instead of liquid fuels in power plants and conversion of gas power plants into combined cycles. This approach taken by the government is mainly due to the consideration on costs and paying much attention to the environmental impact of using fossil fuels.
Compared with other fossil fuels, natural gas is clean and has the least amount of contaminants. However, due to high volume of consumption, 54 % of all carbon dioxide emissions is from the natural gas that in terms of climate change issue is significant [7].Continuation of current trends in terms of power plant fuel supply, carbon dioxide emissions, in addition to high costs of investments in this sector, will become a serious challenge. In addition, the limited availability of fossil energy carriers especially in the cold season and possible increase in their prices are the most serious problems facing the industry.
In energy supply systems analysis, cost is not the only purpose and other parameters such as decreasing GHG emissions and replacing fossil fuels with renewable resources are also important and should be considered in the analysis. For this reason in the present study by using LEAP model [8] the structure of electricity supply system in Iran under transition to renewable energies scenario with the purpose of decreasing GHG emissions until the end of planning period by increasing the share of renewable technologies in electricity supply system will be planed. Additionally the effect of this change on electricity production, installed capacity of each technology, cost and GHG emissions will be studied.
A review on expansion of the country power sector during the period after 1978 shows that: the installed capacity of power facilities has increased from 7024 MW in 1978 to 70279 MW in 2013 [9]. The total Electricity generation has increased from 17,386 GWh in 1978 to 262,192 GWh in2013, which indicates the annual average growth of 8.1 % [9]. While the total primary energy supply has increased 216.7% from 69.3 to 219.6 and consequently the CO2 emissions has increased 198.7% from 178.7 to 532.2[10]. Additionally the GDP of Iran has increased 141.6% from 101.5 in 1990 to 245.2 in 2012 [10].
The electricity generation structure in Iran has been considerably changed from 1978 to 2013. In 1978, Steam Turbines accounted for 36.33%; Gas, 22.60%; Diesel, 5.13%; Hydropower, 35.94%; Combined Cycle, 0.0% and renewable energy (non-hydro) and Nuclear, 0.0%.In 2013, Steam Turbine accounted for 34.20%; Gas, 25.19%; Combined Cycle, 33.23%; Diesel, 0.03%; Hydropower, 5.52%; renewable energy (non-hydro), 0.08% ; and Nuclear, 1.75% [9].
It is obvious that currently most of the electricity is provided by Gas Turbines, Steam and Combined Cycle power generation. The share of hydroelectric power plants was significantly decreased compared to 1978. Although potential of renewable sources of energy in Iran is high, the share of these sources in the electrical production is limited to 0.08% in 2013.
In 2012, the share of the power sector in CO2 emissionswas31.37% and average CO2 emissions index in the power sector was 719.468 g / kWh. The steam power plants with 53.1% of total emissions, were considered as the largest pollutants among the energy department power plants. [7]
Social costs of environmental degradation caused by the consumption of fossil energy carriers in the country, according to the World Bank and Environmental Protection Agency studies in 2012, was about 102.6 trillion Rials based on constant prices of 2002, which is equivalent to 19.6 percent of GDP in that year [7].
2. Methodology
2.1. LEAP Model
In the present study, in order to analyze the electricity system, GHG emissions and cost based on the long term scenarios, LEAP model (version 2014) [8] was used. LEAP, the Long range Energy Alternatives Planning System, is a widely-used software tool for energy policy analysis and climate change mitigation assessment developed by the Stockholm Environment Institute (SEI)[11].
The basic version of LEAP was developed by Paul Ruskin from R&D group of the Stockholm Environment Institute for integrating the energy and environment analysis of energy systems in 1980. LEAP model is a proper tool for evaluation of energy policies, establishing and policy making in energy section and evaluating GHG emissions. This software on the basis of scenario approaches, evaluates the effects of energy sector expansion on GHG emissions and provides comprehensive information regarding cost analys is of decreasing emissions for users.
LEAP has been used for a variety of tasks including, energy forecasting, greenhouse gas mitigation analysis, integrated resource planning, production of energy master plans, and energy scenario studies. [11] Various authors have carried out studies with LEAP model. Cai et al. [12] analyzed emissions reduction potential in China's electricity sector. Giatrakos et al.[13] evaluated the electrical energy status, and examined the possibility of further penetration of sustainable energy of Crete. Jun et al [14] studied the economic and environmental influence of renewable energies on existing electricity generation market of South Korea. Park et al.[15] used LEAP model to analyzed the scenarios for the transition to renewable energy in the Korean electricity sector. Amirnekooei et al. [16] used LEAP to generate energy scenario and carried out demand and supply sides analysis for Iran. Ghanadan and Koomey[17] developed and analyzed exploratory scenarios to explore alternative energy pathways in California. Global Green Growth Institute studied energy and GHG-reduction scenarios with a bottom-up techno-economic analysis for development of green energy systems in Mongolia [18]
LEAP modeling software has been very useful for energy research and analysis in Iran. For instance, we can refer to the first report of climate change in Iran about the United Nations Framework Convention on Climate Change in 2002, estimating the demands of energy carriers until 2041, planning the production and consumption of petroleum products in 2009, specifying fuel consumption portfolio in the country in transportation section in 2009, and simulating demand and supply of energy carriers until 2035 in Iran in 2013 [19].
2.2. Data Structure
The LEAP data set is composed of key assumptions, demand, transformation and resources. The key assumption includes exogenous variables such as macro-economic indexes, demographics, and other related parameters that are used for predicting the demand data. Demand module includes different sections of energy consumer. Transformation module are used for modeling the supply section and converting energy, domestic consumption and transmission and distribution network.
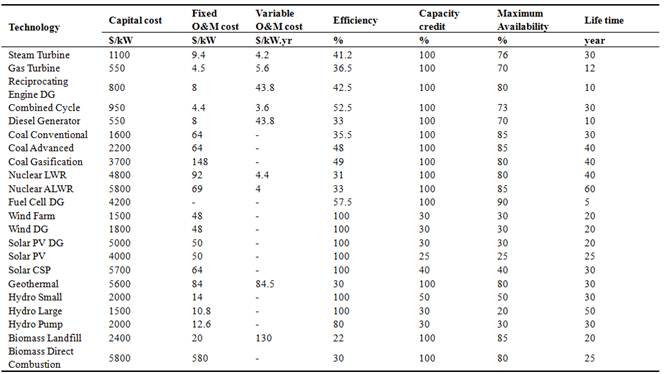
Technical and economic characteristics of power plant technologies were entered to the model according to the following information: the long-term energy section expansion report in the country [20], the electrical power supply system structure plan reported by electricity and energy Macro Planning Office, Ministry of Energy of Iran [6] and renewable power generation cost report of IRENA [21] (See Table 1).
Table 1. Technical and economic characteristics of power generation technologies.
According to detailed statistics of Iran’s Electricity Industry [22] domestic consumption of power plants as well as transmission and distribution loses are 3.5 % and 16% respectively. In addition, transmission and distribution loses are expected to reach to 9% at the end of planning period.
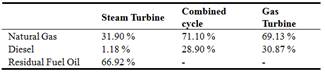
The duration of 26 years from 2014 to 2040 is considered as system planning horizon. Power plants fuel composition extracted from "detailed statistics of Iran’s electricity industry- production of electricity in 2013" [22]and it is offered in the Table 2.
It is supposed that compounding the use of the resources according to the existent limitations of using natural gas in the cold sessions and other conditions until end of the planning period are constant.
Table 2. Power plants fuels composition according to the statistics of 2013.
To calculate GHG and air pollutants emissions, the Tire 1 method of the revised 1996 IPCC guideline for inventory [23] was used. The costs of energy carriers is another important parameter for supply side that in the current study is extracted from the report of electrical power supply system structure plan [6] and offered in the Table 3.
Table 3. Cost of different fuels.
![]()
2.3. Scenario Design
In this study, three scenarios of reference (BL), current governmental policies (GP) and transition to renewable energies (RE)were analyzed. In the reference scenario, electricity supply system is developed without any new policy.
The GP scenario is offered according to electrical power supply system structure planning in Iran reported by "Ministry of Energy of Iran, Electricity and Energy Macro Planning Office"[6].
In the GP scenario according to the "Fifth Development Plan of the Islamic Republic of Iran"[24] until 2016, 12000 Megawatts of gas power plants will be changed to combined cycle.
In the RE scenario, environmental aspect is a priority that by increasing 65% of the share of renewable power plants in the electricity supply system portfolio and developing the power plant section by using renewable technologies, this issue would be possible. In the RE scenario decreasing the GHG emissions of the power plant section at the end of planning period compared to 2013 and decreasing of dependency to fossil fuels aiming at decreasing the environmental impacts with least possible costs in electricity section are considered.
The final electricity demand growth during planning period under each scenarios is shown in the Table 4. In the GP scenario by assuming that consumption management policies are applied, the rate of energy consumption is lower than BL scenario and also the rate of energy consumption in RE scenario by assuming the efficiency improvement of electricity consumer systems is less than GP scenario.
Table 4. Finalelectricity demand growth changes during planning period.
![]()
3. Result and Discussion
3.1. Capacity Analysis
Figs. 1, 2, 3, and Table 5 show different technologies of power plants as total installed capacity in the planning period under different scenarios.
In the reference scenario the total installed capacity was expected to increase from 71125MW in 2013 to 133783 MW in 2040. Steam turbine and gas power plants were outdated gradually and combined cycle and hydropower technologies were replaced. Coal power plant was entered to the circle as of 2016 and after that new capacity is not economical.
In the governmental policies scenario, total installed capacity in 2040 will reach to 134844MW.Capacity change compared to the reference scenario is not significant, but according to the Fifth Development Plan policies, decreasing capacity of the gas power plants occur at the beginning of the planning period, until 2016. Capacity of the steam power plants at the end of planning period reaches to less than the half of capacity in 2013. Gas turbine and pump storage technologies selection, mainly was to cover the peak load. Additionally suggesting the solar power plant in the model was imposed solely with regard to SANA constraints for building this capacity.
In the transition to renewable energies scenario the total installed capacity will reach to 214232 MW in 2040 due to increasing the share of renewable power plants with fewer accessibility factor in the model. The installed capacity of wind, hydro, and biomass power plants at the beginning of the period reaches to the maximum potential of the installable capacity in Iran, due to competitive ability of this technologies. To reach to maximum share of renewable energies (65%) in electricity supply portfolio, the model offers solar technologies.
Table 5. Power generation technologies in the form of total installed capacity.
| 2013 | 2020 | 2030 | 2040 | |||||||||
| Branches | BL | GP | RE | BL | GP | RE | BL | GP | RE | BL | GP | RE |
| Steam Turbine | 15,830 | 15,830 | 15,830 | 14,780 | 12,829 | 13,022 | 14,780 | 11,327 | 9,011 | 12,575 | 6,575 | 5,000 |
| Gas Turbine | 24,715 | 24,715 | 24,715. | 15,923 | 12,091 | 21,419 | 15,500 | 11,747 | 16,709 | 15,078 | 11,402 | 12,000 |
| Reciprocating Engine DG | 183 | 183 | 183. | 223 | 263 | 463 | 583 | 583 | 3,023 | 543 | 583 | 3,023 |
| Combined Cycle | 17,850 | 17,850 | 17,850 | 28,160 | 33,690 | 19,704 | 47,360 | 52,890 | 22,352 | 64,640 | 72,090 | 25,000 |
| Diesel Generator | 408 | 408 | 408 | 413 | 413 | 408 | 453 | 458 | 408 | 453 | 458 | 408 |
| Coal Conventional | 650 | 650 | 650 | 650 | 650 | 650 | 650 | 650 | 650 | 650 | 650 | 650 |
| Coal Advanced | - | - | - | - | - | - | - | - | - | - | - | - |
| Coal Gasification | - | - | - | - | - | - | - | - | - | - | - | - |
| Nuclear LWR | 1,020 | 1,020 | 1,020 | 1,020 | 1,020 | 1,020 | 1,020 | 1,020 | 1,020 | 1,020 | 1,020 | 1,020 |
| Nuclear ALWR | - | - | - | - | - | - | - | - | - | - | - | - |
| Fuel Cell DG | - | - | - | 0 | 0 | 0 | 0 | 0 | 14 | 0 | 0 | 24 |
| Wind Farms | 204 | 204 | 204 | 604 | 604 | 3,404 | 4,204 | 4,604 | 15,004 | 7,404 | 8,204 | 15,004 |
| Wind DG | - | - | - | 70 | 70 | 560 | 700 | 770 | 5,040 | 1,260 | 1,400 | 5,040 |
| Solar PV DG | - | - | - | 0 | 0 | 1 | 1 | 1 | 33 | 2 | 2 | 123 |
| Solar PV | - | - | - | 1 | 50 | 763 | 10 | 550 | 17,231 | 19 | 1,050 | 63,300 |
| Solar CSP | - | - | - | 30 | 30 | 458 | 300 | 330 | 10,369 | 570 | 630 | 38,010. |
| Geothermal | - | - | - | 5 | 5 | 700 | 50 | 55 | 5,000 | 95 | 105 | 5,000 |
| Hydro Small | - | - | - | 150 | 300 | 1,200 | 1,500 | 1,650 | 2,550 | 2,550 | 2,550 | 2,550 |
| Hydro Large | 10,265 | 10,265 | 10,265 | 10,765 | 11,265 | 14,265 | 15,265 | 15,765 | 25,265 | 20,265 | 20,765 | 25,265 |
| Hydro Pumped | - | - | - | 300 | 600. | 2,400 | 3,000 | 3,300 | 10,200 | 5,700 | 6,300 | 10,200 |
| Biomass Landfill | - | - | - | 1 | 1 | 4 | 5 | 6 | 164 | 9 | 10 | 616 |
| Biomass Direct | - | - | - | 50 | 50 | 350 | 500 | 550 | 2,000 | 950 | 1,050 | 2,000 |
| Total | 71,125 | 71,125 | 71,125 | 72,749 | 73,931 | 80,790 | 105,881 | 106,255 | 146,043 | 133,783 | 134,844 | 214,232 |
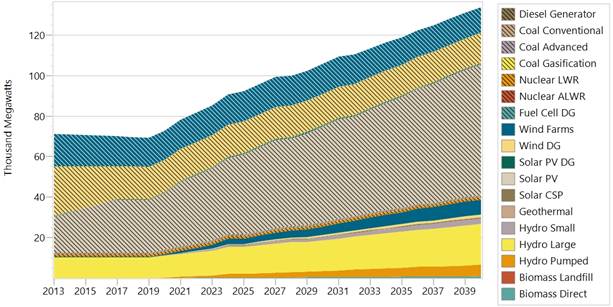
Fig. 1.Total installed capacity in the reference scenario.
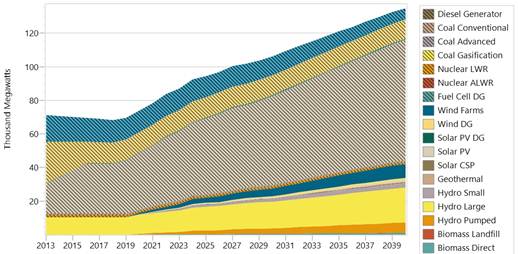
Fig. 2. Total installed capacity in the government policy scenario.
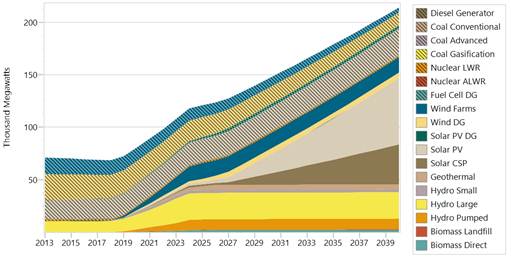
Fig. 3. Total installed capacity in the transition to renewable scenario.
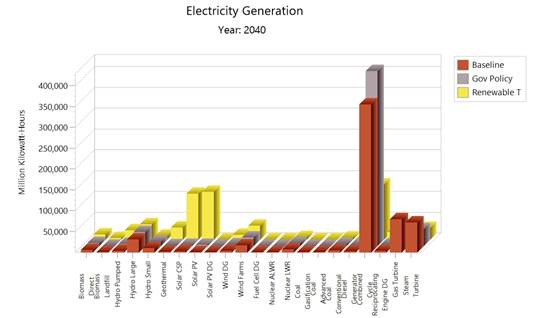
Fig. 4. Comparing generated electricity of each technology under different scenarios.
3.2. Energy Analysis
As shown in Table6, electricity generation was expected to increase from 262192GWh in 2013 to the following values by 2040: 594172GWh in the BL scenario; 579204GWh in the GP scenario; and 575452GWh in the RE scenario. In the BL scenario the major share of electricity generation at the end of the planned period generated by combined cycle, gas power plant, steam power plant, and hydro power are: 59.8%, 13.4%, 12.1%, and 7.3%respectively.
Table 6. Electricity generation of each technologies in 2040.
| Branches | Baseline | Government policy | Renewable target |
| Steam turbine | 71,953 | 39,919 | 27,560 |
| Gas turbine | 79,464 | 19,174 | 4,427 |
| Reciprocating engine | 3,271 | 3,726 | 17,540 |
| Combined cycle | 355,266 | 420,406 | 132,360 |
| Diesel generator | 2,387 | 2,561 | 2,071 |
| Coal conventional | 4,160 | 4,414 | 4,007 |
| Coal advanced | - | - | - |
| Coal gasification | - | - | - |
| Nuclear | 6,144 | 6,519 | 5,918 |
| Fuel cell | 2 | 2 | 154 |
| Wind farms | 16,723 | 19,662 | 32,645 |
| Wind dg | 2,846 | 3,355 | 10,966 |
| Solar PV dg | 4 | 5 | 268 |
| Solar PV | 36 | 2,097 | 114,772 |
| Solar CSP | 1,717 | 2,013 | 110,268 |
| Geothermal | 572 | 671 | 29,010 |
| Hydro small | 9,599 | 10,185 | 9,247 |
| Hydro large | 30,515 | 33,177 | 36,647 |
| Hydro pumped | 3,735 | 4,540 | 22,193 |
| Biomass landfill | 58 | 68 | 3,794 |
| Biomass direct | 5,722 | 6,710 | 11,604 |
| Total | 594,172 | 579,204 | 575,452 |
In the GP scenario the highest share of electricity supplied by combined cycle power plant is 72.6%, while the percentages for the hydro power plant, steam power plant and wind power plant are 8.3, 6.9 and 4. The share of gas power plants in GP scenario was reduced to 3.5%.
In the RE scenario solar power plant (CSP and PV) with 36.7% was the main electricity supplier and after that combined cycle power plant generated 23% of electricity. While the share of steam and gas power plants decreased to 4.8% and 0.8% respectively, the share of hydro, wind, geothermal and biomass was 11.9%, 7.6%, 5%, and 2.7% respectively.
The share of renewable power plant (non-hydro) in supplying electricity in the RE scenario was about 55% at the end of the planning period, while this share in the BL and GP scenarios was 4.7% and 6% respectively. Fig. 4 compared generated electricity by each technology considering the studied scenarios.
3.3. Cost Analysis
Cumulative total cost of production in each scenarios is calculated by the model. The total cost of production includes: capital cost, fixed O&M cost, variable O&M cost, social costs and fuel cost. In the BL, GP and RE Scenarios total cost of production was 53791, 49777, 64428 million Dollars respectively. In the RE scenarios this cost was approximately 20% more than the BL and about 30% more than the GP scenario.
Although by replacing renewable energies with fossil fuels in the RE scenario, the fuel cost and social costs decreased, due to the high expense of capital cost of renewable technologies, the amount of total cost in the RE scenario was higher. Anyway, the impacts of increasing the fuel cost or decreasing the capital cost of renewable technologies, during the planning period are not applied in the model. Fig. 5 shows the total costs of production based on each scenarios.
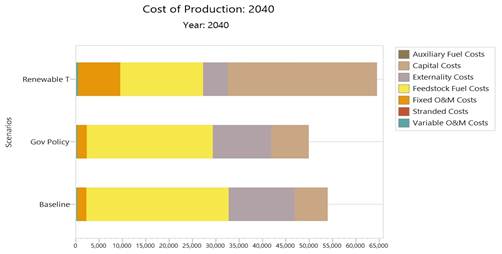
Fig. 5. Total cost of production for each scenarios.
3.4. Environment Analysis
In 2013,GHG emissions in the power section was 129.6 million tons of CO2 equivalent and in 2040this number in the reference scenario reached to 254.2 with 96% increasing. Fig. 6 represented changes in emissions in 2040,based on each scenario compared to the reference scenario.
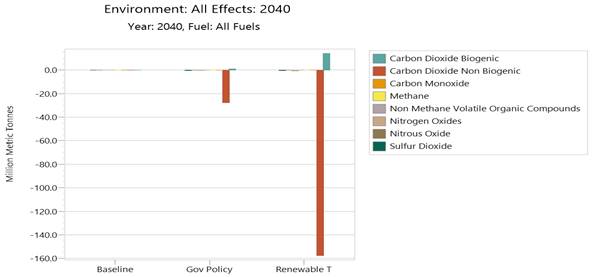
Fig. 6. Changing in GHG emissions of each scenarios in 2040 compared to the reference scenario.
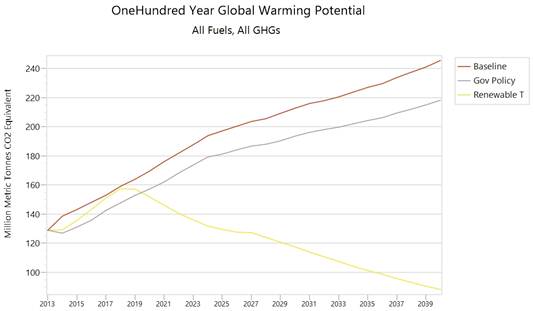
Fig. 7. One hundred year global warming potential trend in each scenario.
In the RE scenario by assuming the biomass power plant in the electricity supply system, biogenic Carbone dioxide emission increased in 2040compared to the other scenarios. Fig. 7 represented trend of one hundred year global warming potential under each scenarios, during the planning period.
4. Conclusion
The present study analyzed the energy, economic and environmental effects of scenarios of Iran electricity system, up to 2040. BL and GP Scenarios were designed on the basis of combined cycle power plants and other fossil fuels. The RE scenario was designed based on renewable energy sources. The final electricity demand growth in the GP scenario was less than the BL, because of applying consumption management policies, and in the RE scenario was less than GP due to efficiency improvement of electricity consumer systems.
Though, in BL and GP scenarios the share of gas and steam power plants in electricity supply portfolio, at the end of the panning period, according to the low efficiency of such technologies were decreased compared to combined cycle, the system totally depends on fossil fuels and combined cycle power plants was the main suppliers of electricity in such scenarios. Otherwise in RE scenario the system was not dependent on fossil fuels and most of the electricity was supplied by renewable technologies.
By increasing the share of renewable power plants in electricity supply portfolio in RE scenario,CO2 emissions were decreased 157.5 million tons compared to the reference scenario at the end of planning period.
Being independent on fossil fuels and decreasing GHG emissions in RE scenario were affected by increasing 20%, 30% of the production costs than those of BL and GP scenarios.
This study showed that decreasing GHG emissions of electricity section, by using renewable technologies does not impose a considerable cost on the system.
In this paper, by using the basic information, three investigated scenarios have been utilized to design the sustainable structure of electricity supply system in Iran up to 2040. In the future studies it is possible to study more detailed information of changes in fuel and renewable technologies prices as influential factor. In addition, it is possible to integrate the system with electricity storage technologies and micro grids.
References
- IPCC. Climate Change 2007: Synthesis Report. Contribution of Working Groups I, II and III to the Fourth Assessment Report of the Intergovernmental Panel on Climate Change. Geneva, Switzerland: IPCC; 2007. 104 p.
- JRC-EDGAR (Joint Research Center, Emission Database for Global Atmospheric Research). GHG (CO2, CH4, N2O, F-gases) emission time series 1990-2012 per region/country[Internet Database]. [Updated 2015 July 8; cited 2015 July 8]. Available from: http://edgar.jrc.ec.europa.eu/overview.php?v=GHGts1990-2012
- Olivier J G.J. (PBL), Janssens-Maenhout G (IES-JRC), Muntean M (IES-JRC), Peters J A.H.W (PBL).Trends in global CO2emissions: 2014 Report. The Hague: PBL Netherlands Environmental Assessment, European Commission Joint Research Centre Institute for Environment and Sustainability Agency; 2014. 59 p. PBL publication number: 1490, JRC Technical Note number: JRC93171
- IPCC. Climate Change 2014: Mitigation of Climate Change. Contribution of Working Group III to the Fifth Assessment Report of the Intergovernmental Panel on Climate Change. Cambridge University Press, Cambridge, United Kingdom and New York, NY, USA: IPCC; 2014. 1435 p.
- IPCC. Special Report on Renewable Energy Sources and Climate Change Mitigation. Cambridge University Press, Cambridge, United Kingdom and New York, NY, USA: IPCC; 2012. 1076 p.
- Ministry of Energy of Iran,Electricity and Energy Macro Planning Office. Electrical power supply system structure planning report. Tehran; 2011. 130 p. (in Persian)
- Ministry of Energy of Iran,Electricity and Energy Macro Planning Office. Energy balance sheet 2012. Tehran; 2013. 492 p. (in Persian)
- Heaps C G. Long-range Energy Alternatives Planning (LEAP) system. [Software version 2014.0.1.29] Stockholm Environment Institute. Somerville, MA, USA; 2012. www.energycommunity.org
- Ministry of Energy of Iran, TAVANIR Company. 47 years of Iran power industry in the mirror statistics (1967-2013). Tehran: TAVANIR; 2014. 44 p. (in Persian)
- IEA. CO2 Emissions from fuel combustion-Highlights. Paris: International Energy Agency; 2014. 123 p.
- Community for Energy, Environment & Development. An Introduction to LEAP [Internet].2014. [Cited 2015 July 8]. Available from: http://www.energycommunity.org/default.asp?action=47
- Cai W, Wang C, Wang K, Zhang Y, and Chen J. Scenario analysis on CO2 emissions reduction potential in China’s electricity sector. Energy Policy 2007; 35(12): 6445-6456
- Giatrakos GP, Tsoutsos Th D, Zografakis N. Sustainable power planning for the island of Crete. Energy Policy 2009; 37(4): 1222-1238
- Jun S, Lee S, Park J-W, Jeong S-J, Shin H-Ch. The assessment of renewable energy planning on CO2 abatement in South Korea. Renewable Energy 2010; 35(2): 471-477
- Park N-B, Yun S-J, Jeon E-C. An analysis of long-term scenarios for the transition to renewable energy in the Korean electricity sector. Energy Policy 2013;52 : 288-296
- Amirnekooei K, Ardehali MM, Sadri A. Integrated resource planning for Iran: Development of reference energy system, forecast, and long-term energy-environment plan. Energy 2012; 46(1): 374-385
- Ghanadan R, Koomey J G. Using energy scenarios to explore alternative energy pathways in California. Energy Policy 2005; 33(9):1117-1142
- GGGI. Strategies for Development of Green Energy Systems in Mongolia Final Report. Mongolia: Global Green Growth Institute; 2014 march. 145 p.
- Eshraghi H, Maleki A, Vakili A. energy carriers demand and supply simulation until 2035 in Iran Using LEAP model. Planning Researches and Energy Policy 2013; 3(1): 113-136 (in Persian)
- Ministry of Energy of Iran,Electricity and Energy Macro Planning Office. Iran’s long-term energy section expansion report. Tehran; 2014. 142 p. (in Persian)
- IRENA. Renewable Power Generation Costs in 2014.International Renewable Energy Agency; 2015. 162 p.
- Ministry of Energy of Iran, TAVANIR Company. Detailed statistics report of Iran’s Electricity Industry - production of Electricity in 2013. Tehran: TAVANIR Co; 2014. 148 p. (in Persian)
- IPCC. Revised 1996 IPCC Guidelines for National Greenhouse Gas Inventories. Intergovernmental Panel on Climate Change; 1996.
- President Deputy Strategic Planning and Control. Fifth Five-Year Development Plan of the Islamic Republic of Iran (2011- 2015); Tehran. 2010. 751 p.


