
Physics Journal, Vol. 1, No. 2, September 2015 Publish Date: Sep. 1, 2015 Pages: 137-152
Characterizing the Maximum Electron Density of the F2 Layer (NmF2) in the Equatorial Ionosphere
A. Ogwala*, E. O. Somoye, E. O. Onori, R. A. Adeniji-Adele
Department of Physics, Lagos State University, Ojo, Lagos
Abstracts
A study of the Maximum Electron Density of the F2 layer (NmF2) in the ionosphere over the African, Asian and American sectors is presented. Mean NmF2 and NmF2 coefficient of variability (CV) of three ionosonde stations namely Dakar (14.8°N, 17.4°, 16.1°N dip) in the African sector, Manila (14.7°N, 121.1°E, 14.2°N dip) in the Asian sector and Huancayo (12°S, 75.3°W, 1.9°N dip) in the American sector were used for this study during three epochs of solar cycle: 1982, year of high solar activity (HSA) with monthly average sunspot number, Rz12 (115.9), 1983, year of moderate solar activity (MSA) with monthly average sunspot number, Rz12 (68.7) and 1986, year of low solar activity (LSA) with monthly average sunspot number, Rz12 (13.4). Results obtained show that pre- and post-noon peaks bothering the noon bite-out were present in the diurnal curves of mean NmF2 for the three stations. Morning peaks were predominant during HSA while afternoon peaks were predominant during MSA and LSA. NmF2 CV is characterized by pre- and post-midnight peaks in all the three stations. The results reveal diurnal, seasonal, solar cycle and longitudinal influences of mean NmF2 and NmF2 CV.
Keywords
Mean NmF2, NmF2 CV, Diurnal, Seasonal, Solar Activity, Noon Bite-Out
Received: July 14, 2015
Accepted: August 14, 2015
Published online: September 2, 2015
@ 2015 The Authors. Published by American Institute of Science. This Open Access article is under the CC BY-NC license. http://creativecommons.org/licenses/by-nc/4.0/
1. Introduction
The dynamic nature of the equatorial ionosphere has been of major concern to the scientific world. Many scientists have applied the properties of the ionosphere in many beneficial ways over the last century. [7] and [4] mentioned the proper understanding of the dynamic nature of the equatorial ionosphere because it can pose serious threats to satellite users. Navigation and communication systems rely on this region for proper prediction, functionality and characterization [4]. Ionospheric electric field is very important in determining the dynamic nature and plasma distribution, especially at equatorial latitudes where these fields develop equatorial ionization anomaly (EIA) [4]. The EIA is one of the most important features in the ionosphere over the equatorial region [5,16,18]. It is formed by the equatorial fountain process which is driven by the large scale upward E×B drift [16,20]. Also, the physical and chemical processes controlling its behavior need to be well understood, particularly with respect to its dynamic nature and response to solar influences. The ionosphere affects modern technologies such as civilian and military communications, navigation systems and surveillance systems, etc. For many communication and navigation systems, this arises because the systems use signals transmitted to and from satellites, which must therefore pass through the ionosphere. For the most reliable communication and navigation it is necessary to correct the signals for effects imposed by the ionosphere [28]. To do that, the properties of the ionosphere such as its variability with respect to magnetospheric disturbance, diurnal, seasonal and solar cycle influence must be well understood [28]. The day to day variability of all ionospheric parameters that exists in the near earth environment is the most widely used by researchers and it is greater than those of hour to hour [22,24,25].
Several empirical models have described the quiet ionosphere. [6] mentioned the best known and most common model as the International Reference ionosphere (IRI). The IRI is an international project sponsored by the Committee on Space Research (COSPAR) and the International Union of Radio Science (URSI). The local time, season, longitude, latitude and solar activity determines the quiet time ionosphere. IRI provides monthly median values for F region while the variability surrounding the mean values for most F region parameters have not been well represented [6].
In this paper, an attempt is made to investigate the response of the quiet time F layer peak electron density (NmF2) to local time, season and solar activity in the equatorial ionosphere, and also to show to show longitudinal influences on mean NmF2 and NmF2 CV. The results of this study will provide inputs for future improvement of the IRI model.
2. Data and Method
The data used for this study are the hourly foF2 data from the ionosonde at Dakar (14.8ºN, 17.4ºW, 11.4ºN dip) in the African sub sector, Manila (14.7ºN, 121.1ºE, 14.7ºN dip) in the Asian sector and Huancayo (12ºS, 284.7ºE, 1.9º dip) in the American sector. These data were used to obtain NmF2 using the relation in equation 1, that is, NmF2 being proportional to the square of foF2. The data which were obtained from Space Interactive Data Resource website (http://spidr.ngdc.noaa.gov/) have been scaled automatically. They cover years of high solar activity (HSA), moderate solar activity (MSA) and low solar activity (LSA). The average annual sunspot number (Rz12) was used as the index to define solar activity level of the years under consideration, that is, as a high solar activity (HSA) year (1982; Rz = 115.9), a moderate solar activity (MSA) year (1983; Rz = 68.7) and a low solar activity (LSA) year (1986; Rz = 13.4).
Mean NmF2 and NmF2 CV values were plotted against each hour of the day on seasonal and annual scales. For seasonal analysis, the data were grouped into four seasons of March equinox comprising February, March and April; June Solstice comprising May, June and July; September Equinox comprising August, September and October; December Solstice comprising November, December and January [8], in order to evaluate seasonal effect on NmF2. Owing to the non-availability of April data during HSA for the Dakar station, only February and March data were used to obtain March equinox. Similarly, the annual average data for each station and during the three years being considered were plotted against each hour of the day, in order to observe the clear effect of longitude and solar cycle respectively.
The coefficient of variability (CV) is obtained by using the monthly mean, μ and the standard deviation, σ at each hour. Following the example of Forbes et al. 11 and Bilitza et al8, we define CV as:
CV (%) = σ/μ × 100 (1)
The extent of spread or deviation of each data from the calculated mean is usually given by CV. CV given by equation 1 has advantage over the one obtained from the quotient of interquartile range and median used by [12,15]though the latter is easier to interprete in terms of probability. While the CV obtained from equation 1 considers the whole data point, the latter method uses only 50% of the data [8,24].
Effect of solar activity on NmF2 CV for the three stations at different seasons and longitude is considered by determining the correlation coefficient, r between NmF2 CV and Rz at each hour of the day by equation 2.
![]() (2)
(2)
Where ![]() and
and ![]() represent the two variables and n is the number of pairs of data.
represent the two variables and n is the number of pairs of data.
3. Results
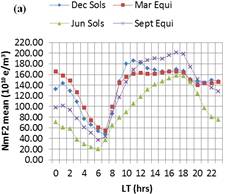
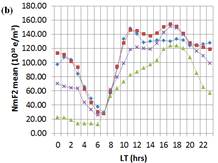
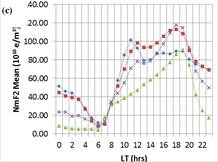
Fig. 1. Diurnal plots of mean NmF2 for Dakar during 1982 (HSA) year, 1983 (MSA) year and 1986 (LSA) year respectively.
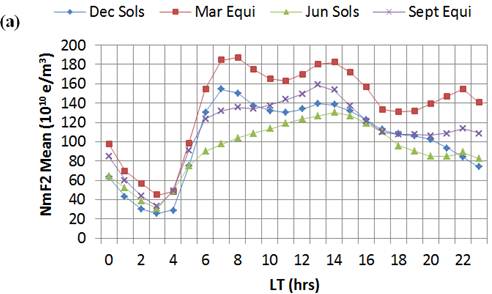
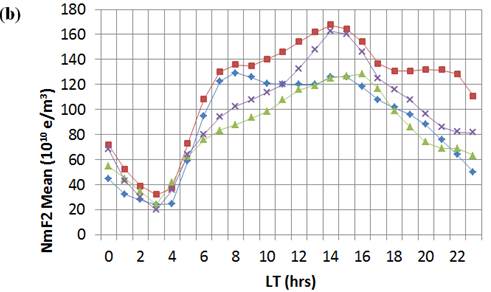
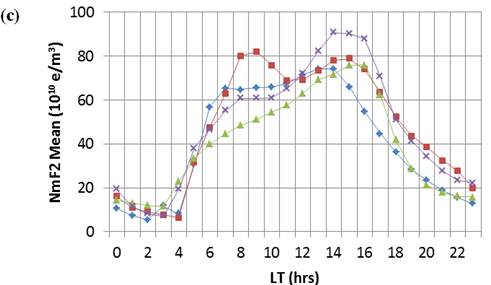
Fig. 2. Diurnal plots of mean NmF2 for Manila during 1982 (HSA) year, 1983 (MSA) year and 1986 (LSA) year respectively.
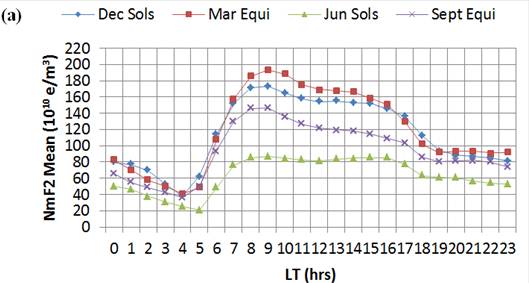
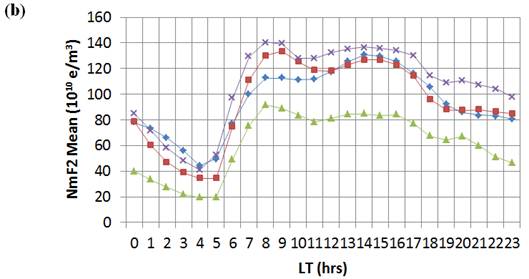
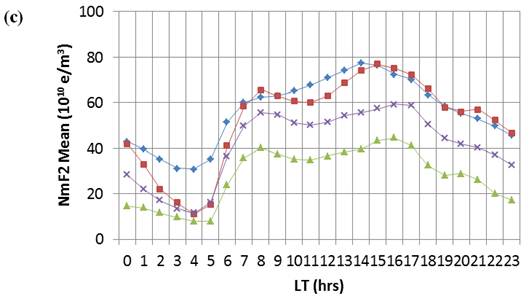
Fig. 3. Diurnal plots of mean NmF2 for Huancayo during 1982 (HSA) year, 1983 (MSA) year and 1986 (LSA) year respectively.
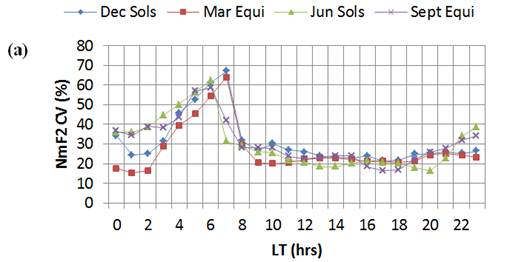
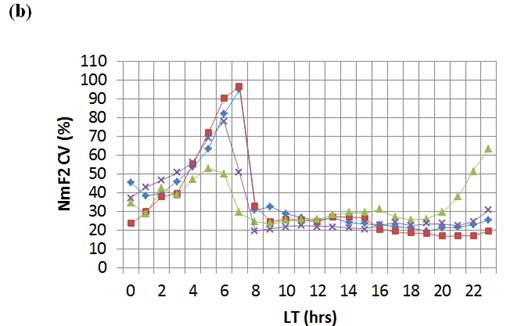
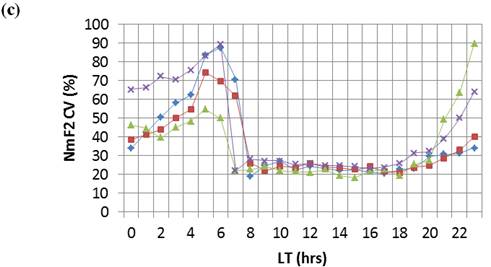
Fig. 4. Diurnal plots of NmF2 CV (%) for Dakar during 1982 (HSA) year, 1983 (MSA) year and 1986 (LSA) year respectively.
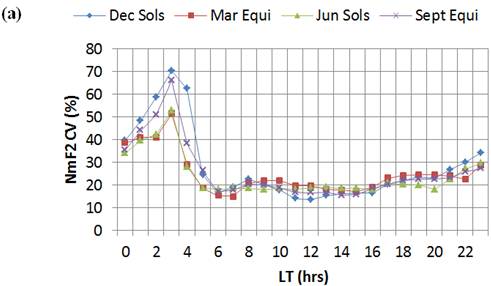
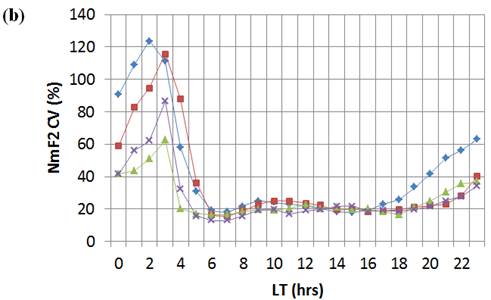
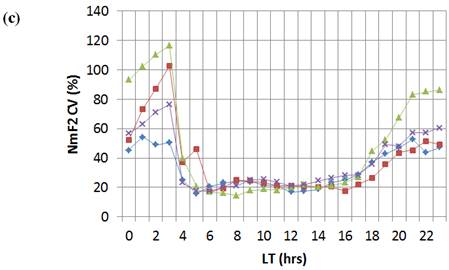
Fig. 5. Diurnal plots of NmF2 CV (%) for Manila during 1982 (HSA) year, 1983 (MSA) year and 1986 (LSA) year respectively.
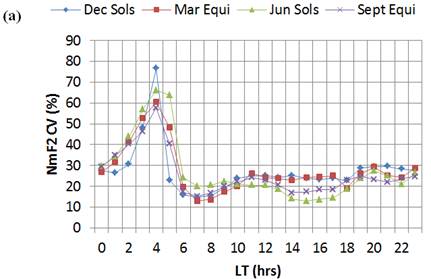
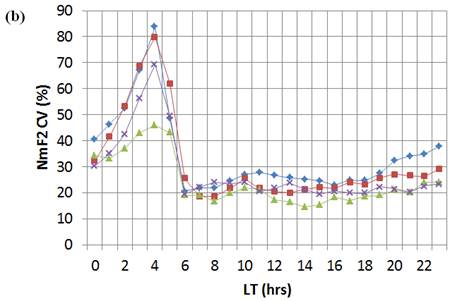
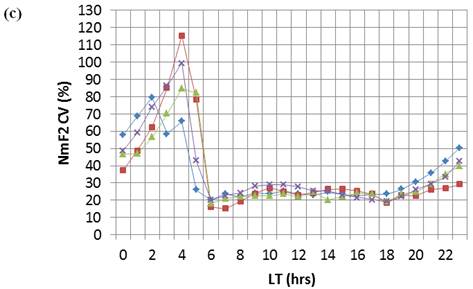
Fig. 6. Diurnal plots of NmF2 CV (%) for Huancayo during 1982 (HSA) year, 1983 (MSA) year and 1986 (LSA) year respectively.
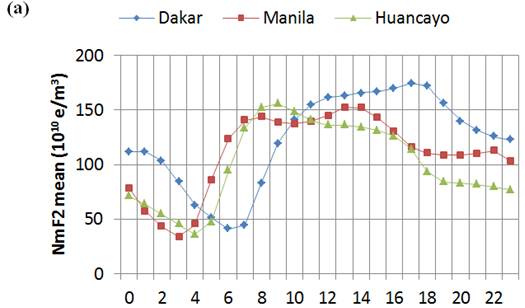
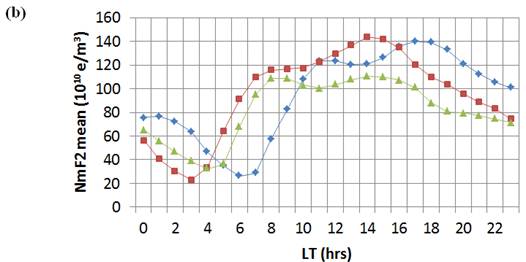
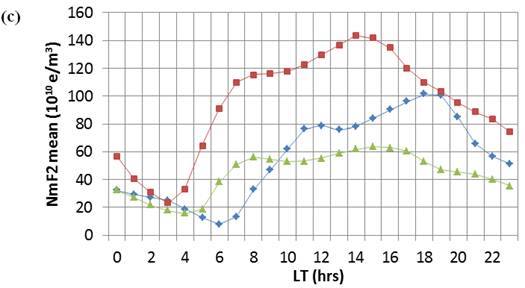
Fig. 7. Diurnal plots of annual average mean NmF2 for Dakar, Manila and Huancayo during 1982 (HSA) year, 1983 (MSA) year and 1986 (LSA) year respectively.
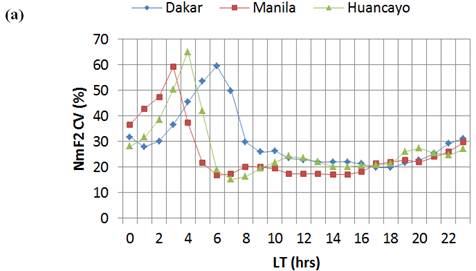
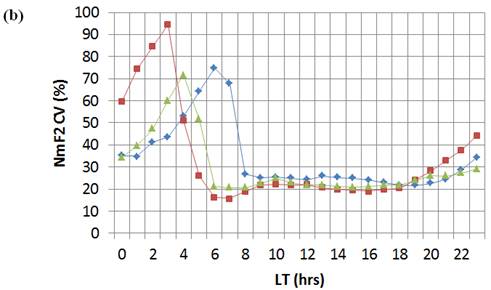
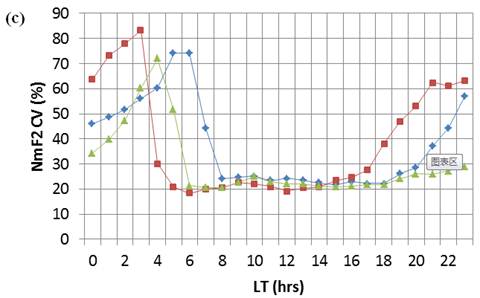
Fig. 8. Diurnal plots of annual average NmF2 CV (%) for Dakar, Manila and Huancayo during 1982 (HSA) year, 1983 (MSA) year and 1986 (LSA) year respectively.
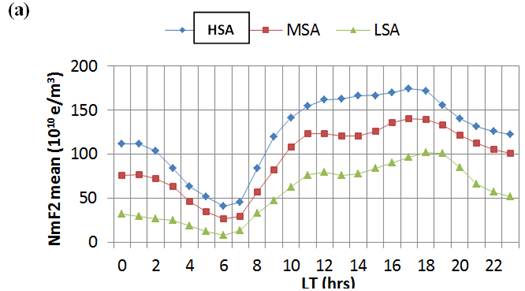
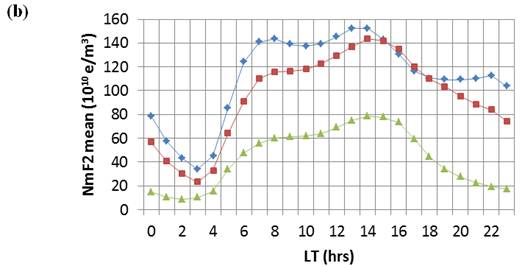
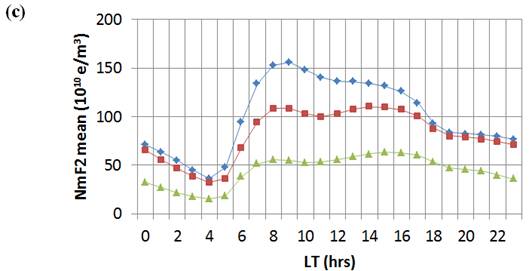
Fig. 9. Diurnal plots of annual average mean NmF2 during 1982 (HSA) year, 1983 (MSA) year and 1986 (LSA) year for Dakar, Manila and Huancayo respectively.
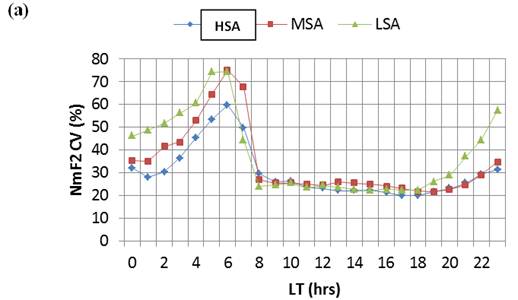
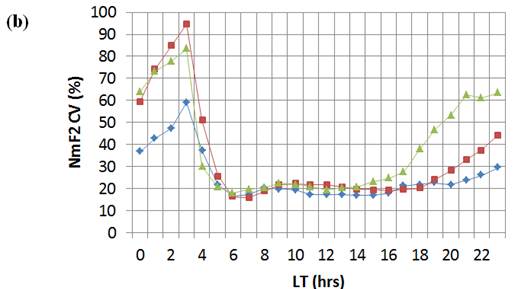
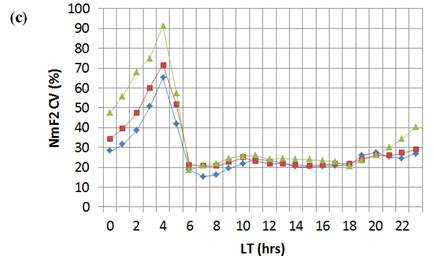
Fig. 10. Diurnal plots of annual average NmF2 CV (%) during 1982 (HSA) year, 1983 (MSA) year and 1986 (LSA) year for Dakar, Manila and Huancayo respectively.
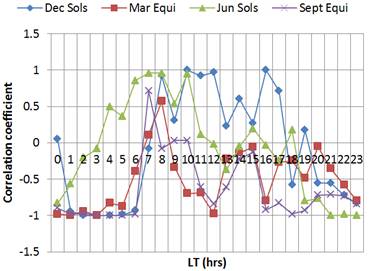
Fig. 11a. Diurnal plots of correlation coefficient between NmF2 CV and Rz for Dakar during 1982, 1983 and 1986.
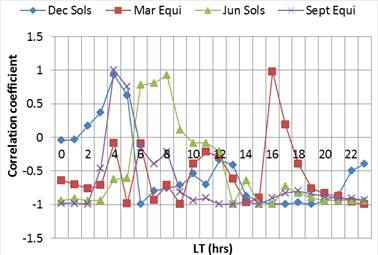
Fig. 11b. Diurnal plots of correlation coefficient between NmF2 CV and Rz for Manila during 1982, 1983 and 1986.
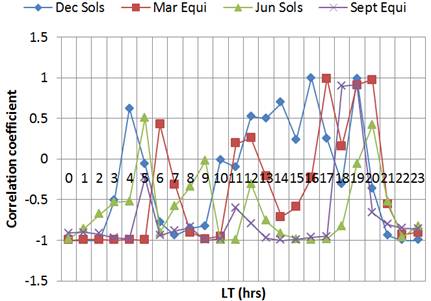
Fig. 11c. Diurnal plots of correlation coefficient between NmF2 CV and Rz for Huancayo during 1982, 1983 and 1986.
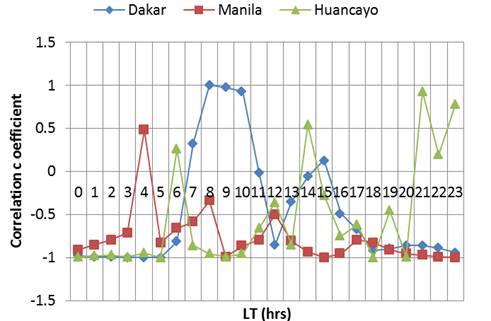
Fig. 12. Diurnal plots of Correlation coefficient between NmF2 CV and Rz for Dakar, Manila and Huancayo during 1982, 1983 and 1983.
4. Discussion
Figures 1, 2 and 3 show the diurnal plots of mean NmF2 for Dakar, Manila and Huancayo during 1982 (HSA) year, 1983 (MSA) year and 1986 (LSA) year respectively. The same diurnal features were observed throughout the day for the three stations during the years under consideration. Mean NmF2 values during the daytime are higher than nighttime values with peaks occurring before and immediately after noon. Typical minimum mean NmF2 values occur in late night just before sunrise. This agrees with results obtained by many workers who have explored the ionosphere over the past decades. For example, [14] investigated mean NmF2 and NmF2 CV of five ionosonde stations namely Kodaikanal, Tucuman, Okinawa, Yamagawa and Kokobunji. [23,24,25] investigated the variability of foF2, MUF, h’F2 and NmF2 for Ibadan, Singapore and Slough. Also, [1] working at Ibadan investigated mean NmF2 and NmF2 CV. [2] working at Dakar, Ouagadougou and Djibouti investigated foF2 CV; [3] working at Manila, Okinawa and Vanimo investigated mean foF2 and foF2 CV; [4] also investigated foF2 CV at Ouagadougou, Vanimo and Huancayo.
The results obtained clearly reveals that June Solstice maintained the lowest mean NmF2 values throughout the day for all the stations during the years under investigation. These results agree with the fact that at equatorial/ low latitude stations, mean NmF2 values are higher during the equinox months [March and September] than the Solstice months [June and December], since the solar zenith angle is lowest during the equinoxes. Also, during these months the atmosphere is observed to be colder and denser hence the ionosphere will tend to move closer to the earth thereby increasing the electron density. This agrees with the reports of [1] who reported the same result on NmF2 during the build-up region (05 – 09 hrs). At Dakar, December Solstice values were higher than those of September equinox at some hours of the day (09 – 13hr) for the three years. At Manila, December Solstice values were higher than those of September equinox between 06 – 10hr for the three years. A different result was obtained during HSA and LSA at Huancayo where December Solstice values were higher than those of September equinox throughout the day, but MSA equinox month values were higher than those of its Solstice months. This exception has not yet been accounted for in literature.
The results in Figures 4, 5 and 6 show the diurnal plots of NmF2 CV for Dakar, Manila and Huancayo during 1982 (HSA) year, 1983 (MSA) year and 1986 (LSA) year respectively. Higher NmF2 CV at night than during the daytime with double characteristic peaks i.e. pre-midnight and post-midnight peaks is a major feature of NmF2 CV. This has been mentioned by many workers. [3,8,9] attributed this to the onset and turnoff of solar ionization radiation on the diurnal variation of mean foF2 and foF2 variability resulting from the steep electron density gradient. At night, the density of the ionosphere is largely dependent on the recombination of gas compositions and magnetic meridional winds [9,17]. Also, [2] mentioned that gravity waves also enhances ionospheric density gradient at night. It has been reported in many literature that foF2 CV increases with decreasing solar activity during nighttime. Figure 4, showing NmF2 CV at Dakar reveals that during HSA, NmF2 CV are in the range [15 – 67%], MSA NmF2 CV [17 – 97%] and LSA NmF2 CV [18 – 89%] which corresponds to mean NmF2 values of [20 – 201 1010e/m3] during HSA, [12 – 155 1010e/m3] during MSA and [8 – 118 1010e/m3] during LSA respectively. Figure 5 shows that NmF2 CV at Manila are in the range [15 – 71%] during HSA, [13 – 124%] during MSA and LSA NmF2 CV [15 – 117%], these corresponds to mean NmF2 values of [26 – 187 1010e/m3] during HSA, [20 – 168 1010e/m3] during MSA and [7 – 91 1010e/m3] during LSA respectively. Figure 6 which shows NmF2 CV at Huancayo, reveals that during HSA, NmF2 CV are in the range [13 – 76%], MSA NmF2 CV [15 – 84%] and LSA NmF2 CV [15 – 116%], these corresponds to mean NmF2 values of [21 – 193 1010e/m3] during HSA, [19 – 139 1010e/m3] during MSA and [8 – 78 1010e/m3] during LSA respectively.
Figures 7 shows diurnal plots of annual average mean NmF2 for Dakar, Manila and Huancayo during 1982 (HSA) year, 1983 (MSA) year and 1986 (LSA) year. NmF2 at the three stations during HSA and MSA have been seen to overlap each other (i.e. in close range) while during LSA, Manila depicted exceedingly high mean values throughout the day and least at Huancayo. Minimum mean NmF2 values occurred shortly before 0600LT at Manila and Huancayo, while at Dakar, minimum mean NmF2 values occurred at exactly 0600LT. This is the period when the ionization descending into a region of higher neutral density is observed and therefore resulting to higher loss [19]. Their CV shows that Manila have highest post-midnight NmF2 CV during the three years and MSA and LSA pre-midnight NmF2 CV. During the day, their CVs are about the same range as seen in Figures 8.
foF2 CV and by extension NmF2 CV is found to be greater at the ionospheric station east and west of the GM than at the station located in the neighbourhood of the GM. [3,4,27] attributed it to be as a result of the effect of longitude which was clearly obtained in this study. Ionization is highest during HSA followed by MSA and least during LSA as expected. This is clearly illustrated in Figure 9, which is clear effect of solar cycle. Another major effect of solar cycle can be seen at the LT in which the pre-noon and post-noon peaks bothering the noon bite-out occurs [19]. The three stations have almost the same distinct features as mentioned earlier, that is, higher post-noon than pre-noon peak during the three years except at Huancayo where some disparities have been exhibited, that is, higher pre-noon than post-noon peak during HSA. Figure 9 shows the diurnal plots of annual average mean NmF2 during 1982 (HSA) year, 1983 (MSA) year and 1986 (LSA) year for Dakar, Manila and Huancayo respectively. It is observed that mean NmF2 is higher at Dakar followed by Manila and least at Huancayo. This might be due to the fact that Dakar is located in the neighbourhood of the EIA. Their relative CV is illustrated in Figure 10.
Equatorial Ionization Anomaly (EIA) is one of the most important features in the ionosphere over the equatorial region [5,16,18]. It is formed by the equatorial fountain process which is driven by the large scale upward E×B drift [16,20]. The plasma fountain is found to be concentrated around the magnetic equator and transfers plasma from the equatorial region to higher latitudes [10,13,14,21]. This process depletes the F2 ionization at the equator and thus increases the density at ±20° geomagnetic latitude. The drift contribution is maximum at ±15° [14,21] where the crest is located.
Noon bite-out phenomenon which occurs as a result of the E×B drift is present in daytime mean NmF2. This phenomenon has been mentioned by some workers like [1,16,19] and many others, especially during HSA and LSA years. This phenomenon can be observed in the result of this research, although it is not very pronounced in some of the curves. [1] reported that noon bite-out can be absent (i.e. replaced by a single daytime peak) on some day-time NmF2 diurnal curves during HSA. He also reported that noon bite-out is always present on daytime NmF2 during LSA. [19] stated that it is sometimes replaced by a dome shape or is flattened during HSA and that it is mostly pronounced during the equinox months irrespective of solar epoch. Noon bite-out which changes pattern with solar cycle and longitude [19] – is evident in Figures 7 and 9. This agrees with the results obtained in this study. [1,19] showed that during HSA, morning peaks were predominant while afternoon peaks were predominant during LSA. Results obtained in this work also show that MSA afternoon peak predominates at the three stations.
The diurnal plots for different seasons of correlation coefficient, r, between NmF2 CV and Rz for Dakar, Manila and Huancayo are illustrated in Figures 11a, 11b and 11c respectively. It is observed from this study that most of the data points are negatively correlated (a case of increasing NmF2 CV with decreasing Rz) for all the stations. For Dakar station, March and September equinox have almost all their data points negatively correlated (92% each), a percentage much higher than those of December solstice (50%) and June solstice (58%). March and September equinox at Manila recorded (92%) negative correlation each, while December and June solstice each have 83% of their data points negatively correlated. A similar result is also obtained at Huancayo, except that the negative correlation of data points for June solstice (92%) were higher than those of March equinox (71%). Variation in the diurnal correlation coefficient, r between NmF2 CV and Rz for the three stations reveals longitudinal influence. The three stations have best consistent correlation coefficient, r > 0.71 at the early hours of the day (00 – 05 hr) except at Manila (04 hr) where r is 0.48 and at Huancayo where r > 0.78 before midnight (18 – 23 hr) except at 22 hr where r = 0.19.
5. Conclusions
We have presented here results of the diurnal, seasonal, solar cycle and longitudinal effect on NmF2 for three ionosonde stations namely Dakar, Manila and Huancayo. The following conclusions have been drawn:
1. Higher daytime mean NmF2 than nighttime mean NmF2 with the pre-noon and post-noon peaks bothering the noon bite-out is obtained resulting in higher nighttime NmF2 CV than daytime NmF2 CV.
2. Higher mean NmF2 Equinox values [March and September] than Solstice values [June and December] except where it behaved anomalously with December having higher value than those of September in some of the curves.
3. Solar ionizing radiations have been found to increase from LSA to HSA as expected.
4. The effect of solar cycle is also seen in the LT in which the pre-noon and post-noon peaks bothering the noon bite-out occurs.
5. The early morning depression which is as a result of the longitudinal effect on NmF2 has been observed to occur before 0600LT at Manila and Huancayo. At Dakar, it occurred at exactly 0600LT.
6. NmF2 CV is found to be greater at the ionospheric station east and west of the GM than at the station located in the neighbourhood of the GM.
7. Morning peaks were predominant during HSA while afternoon peaks were predominant during MSA and LSA.
8. NmF2 CV correlates highly with Rz for most hours of the day at all seasons for the three stations. A case of increasing NmF2 CV with decreasing Rz is observed.
References
- Adeniyi, JO. A Study of some features of the equatorial ionosphere on magnetically quiet and disturbed days. [PhD Thesis]. Ibadan, University of Ibadan, 1980.
- Akala, AO, Oyeyemi, EO, Somoye, EO, Adeloye, AB, Adewale, AO. Variability of foF2 in the African equatorial ionosphere.Advances in Space Research, 2010a;45: 1311-1314.
- Akala, AO, Adeloye, AB, Somoye, EO. Ionospheric foF2 variability over the Southeast Asian sector. J. Geo. Res., 2010b; Vol. 115, A09329, doi: 10.1029/2010JA015250.
- Akala AO, Somoye EO Adeloye AB, Rabiu AB. Ionospheric foF2 variability at equatorial and low Latitudes during high, moderate and low solar activity. Indian J. Radio and Space Physics, 2011; 40: 124-129.
- Appleton E V. Two anomalies in the ionosphere, Nature, 1946; 157, 691.
- Araujo-Pradere EA, Fuller-Rowell TJ, Codrescu MV, Bilitza D. Characteristics of the ionospheric variability as a function of season, latitude, local time and geomagnetic activity. Radio Science. 2005; 40: RS5009, doi: 10.1029/2004RS003179.
- Basu S, Groves KM, Basu Su, Sultan JP. Specification and forecasting of scintillations in communication/Navigation links: current status and future plans. J. Atmos. Solar-Terr. Phys. 2002; 64: 1745- 1754.
- Bilitza D, Obrou OK, Adeniyi JO, Oladipo O. Variability of foF2 in the equatorial ionosphere.Advances in Space Research, 2004;34: 1901-1906.
- Chou YT, Lee CC. Ionospheric variability at Taiwan low latitude station: comparison between observations and IRI-2001 model. Adv. Space Res. 2008; 42: 673–681.
- Coley WR, Mc Clure JP, Hanson WB. Equatorial fountain effect and dynamo drift signatures from AE-E observations. J. Geophys. Res., 1990; 95: 21285 – 21290.
- Forbes JM, Palo SE and Zhang X. Variability in the ionosphere. J. Atmos. and Solar-Terr. Phys., 2000; 62: 685-693.
- Fotiadis DN, Baziakos GM, Kouris SS. On the global behaviour of the day- to- day MUF variation. Adv. Space Res. 2004; 33(6): 893-901.
- Hanson WB and Moffet RJ. Ionization transport effects in the equatorial F region. J. Geophys. Res., 1966; 71: 5559 – 5572.
- Heredia T and Elias AG. Diurnal variation of NmF2 associated with E×B drift at the equator during solar maxima. Geofisica Internacional, 2004; 43(1): 119 – 124.
- Kouris SS, Fotiadis DN. Ionospheric variability a comparative statistical study. Adv. Space Res. 2002; 29 (6): 977-985.
- Liu H and Watanabe S. Seasonal variation of the longitudinal structure of the equatorial ionosphere: Does it reflect tidal influences from below? J. Geophys. Res., 2008; 113, A08315, doi:10.1029/2008JA013027.
- Miller KL, Lemon M and Richards PG. A meridional wind climatology from a fast model for the derivation of meridional wind from the height of the ionospheric F2 layerJ. Atmos. Terrs. Phys., 1997; 59: 1805-1822.
- Namba S and Maeday KI. Radio Wave Propagation, 1939; 86 pp., Corona Publishing, Tokyo.
- Rajaram G and Rastogi RG.Equatorial electron densities- seasonal and solar cycle changes, J. Atmos. Terrs. Phys., 1977; 39: 1175-1182.
- Rishbeth H. The equatorial F-layer: Progress and puzzles, Ann.Geophys., 2000; 18, 730–739.
- Schunk RW. Ionospheres Physics, Plasma Physics and Chemistry, Cambridge University Press, UK, 2000; pp 554.
- Somoye EO. Periodicity of solar cycle from diurnal variations of foF2 at Ibadan. International J. Physical Sciences. 2009a; 4(3): 111-114.
- Somoye EO. (2009b). Comparison of NmF2 variability at Ibadan, Singapore and Slough during different epochs of solar cycle. Asian J. of Sci. Res., 2009b; 2(3): 155-160.
- Somoye EO, Akala AO. NmF2 Variability at Equatorial and Low Latitude Stations: A review, Research Journal of Physics 2010; 4(2): 50 – 55.
- Somoye EO, Akala AO.Comparison of diurnal, seasonal and latitudinal effect of MUF VR and NmF2 VR during some solar cycle epochs. J. Adv. Space Res., 2013; 47: 2182 – 2187.
- Somoye EO, Akala AO, Ogwala A. Day to day variability of h’F and foF2 during some solar cycle epochs, J. Atmos. Terr. Phys., 2011; 73, 1915 – 1922.
- Somoye EO, Akala AO, Adeniji-Adele RA, Iheonu EE, Onori EO, Ogwala A.. Equatorial F2 characteristics variability: a review of recent observations. J. Adv. Space Res., 2013; 52 (7): 1261 – 1266.
- Yizengaw E. Ionosphere: Plasmasphere: Magnetosphere: Space Weather [Internet] 2013 [updated 2013 May 20; cited 2014 Oct 14, Available from:http://www.igpp.ucla.edu/public/ekassie/ionosphere.html.


