
Physics Journal, Vol. 1, No. 2, September 2015 Publish Date: Aug. 17, 2015 Pages: 79-88
Techno-Economic Evaluation of Utilizing a Micro Wind Turbine in Arak, Iran
Mohammad Hoseini Rahdar1, Abtin Ataei1, *, Mohammad Heydari1, Mohammadreza Torkamani2, Mojtaba Nedaei1
1Department of Energy Engineering, Graduate school of the Environment and Energy, Science and Research Branch, Islamic Azad University, Tehran, Iran
2Faculty of New Science and Technologies, University of Tehran, Tehran, Iran
Abstract
The purpose of this study is to evaluate the wind potential of Arak, located in the middle of Iran and to perform technical and economic assessment of utilizing an appropriate micro wind turbine based on the wind characteristics of the region. To achieve this aim, 10 years wind data in Arak was analyzed to determine wind energy potential using Weibull distribution function. It became clear that Weibull distribution was adequate for this study. Average of shape factor and scale factor are 4.31 and 5.19 respectively. The range of mean yearly wind speeds is obtained as 3.7 to 5.61 m/s at 10 m height. According to the characteristics of the understudied site, two wind turbines, SKYSTREAM3.7 and WHISPER500 were selected for power generation and then economic analysis was carried out. The results indicate that, WHISPER500 generates annual energy of 3975 kWh and internal rate of return for this turbine is 20.9% while these values for SKYSTREAM3.7 are 2961 kWh and 20.9%, respectively. According to the calculations, currently the wind power generation is not economically justified for Arak due to low returns of capital costs, but more supports from the government like devoting loans and considering the carbon credits can make the wind energy projects in Arak more viable.
Keywords
Wind Energy, Weibull Function, Power Density, Micro Wind Turbine, Economic Evaluation
Received: July 14, 2015
Accepted: August 9, 2015
Published online: August 17, 2015
@ 2015 The Authors. Published by American Institute of Science. This Open Access article is under the CC BY-NC license. http://creativecommons.org/licenses/by-nc/4.0/
Contents
1. Introduction 2. Material and Methods 2.1. Weibull Probability Density Function 2.2. Wind Power Density 2.3. Wind Energy Density 2.4. Most Probable Wind Speed 2.5. Wind Speed Carrying Maximum Energy 3. Results and Discussion 3.1. Monthly and Annual Mean Wind Speed Values 3.2. Weibull Distribution Analysis 3.3. Calculation of Wind Power and Energy Density 3.4. Energy and Economic Investigation of a Micro Wind Turbine in the Studied Site 4. Conclusion
1. Introduction
Today, it is clear that the electricity generation industry worldwide is dependent essentially to oil and substituting other energy sources for this black gold is a major challenge of the world. Furthermore, the environmental problems have become one of the most crucial anxieties of human beings. As a result the renewable resources are considered as efficient solutions for energy and environmental crises. Among the renewable resources, wind energy is more in favour as it is estimated that the total potential of the wind worldwide can produce 15 times more than the energy consumption of the world. [1] Nowadays, the use of this source of energy is rising significantly. In Iran, as a country which has used the wind energy from the 9th century A.D. for pumping water or grinding [2], activities for power generation from the wind resources are ongoing. Unlike solar energy, the wind energy potential for power generation is not easy to guess and it is directly dependent to the characteristics as well as topography of the region. [3] Classification and obtaining the characteristics of an area in order to know whether it has a high or low potential for the exploitation of wind energy requires a detailed investigation. The first statistical study to estimate the discrete variable wind speed conducted about fifty years ago by Gamma distribution function [4], however, for predicting the wind distribution other functions such as Weibull, Rayleigh, Poisson, Chi and Johnson could also be applied. Among these functions, Weibull is more flexible and simple and is used more widely and also two variable Weibull distribution is applied due to the changes in wind speed [5-7]. Weisser used the Weibull density function to estimate the wind energy potential in Grenada, West Indies based on historic recordings of mean hourly wind velocity [8]. Panda et al. performed the stochastic analysis of seven weather station in India to assess the wind-energy potential for those regions. They used Box-Cox transformation to transform the data for all of the stations to a normal distribution [9]. Ulgen et al. compared the two Weibull parameters of the wind speed distribution function and The Rayleigh distribution in a region in turkey. The Rayleigh distribution was found to be more suitable to represent the actual probability of wind speed data for his case study [10]. About the Evaluation of wind energy resources in Iran for power generation, several studies are conducted. For instance, the wind atlas of the country is produced by the renewable energy resources organization of Iran (SUNA) [11].Mostafaeipour investigated the annual and daily changes of some cities in Yazd province for power generation [12]. The power generation from wind, even for cities with low wind speed is feasible by using small wind turbines especially in the recent years. Small turbines range from 20 W to 100 kW. Likewise, the quantity of small wind turbines has grown rapidly over the last years. For instance, in England, 3715 small wind (0–100 kW) turbines were installed in 2012 [7].
In this study, regarding to 10 year data of a station in Arak province, wind energy potential of the region is determined using Weibull distribution function. Afterwards, based on the wind characteristics, the suitable kind of power generation is defined and some appropriate wind turbines are considered. With respect to the power curve of each turbine, the corresponding generable power is calculated and finally the best turbine for power generation in Arak region of Iran is selected.
2. Material and Methods
Arak, capital of Markazi Province, is located in the middle of Iran and surrounded by mountains in the south, west, and east. The location of the city is shown in Fig. 1. It has warm and dry weather in summer and cold and snowy in winter. While the warmest month for Arak is July (minimum average temperature 18.8°C and maximum average temperature 35.8°C), the coldest one in January (minimum average temperature -5.7°C and maximum average temperature 4.2°C) with a moderate climate [13]. Wind data has been collected from Arak site which is located in Longitude 49° 46´ E and Latitude34°6´ N, under supervision of Iranian Meteorological Organization. The height from level sea is 1708 m. Wind speed and direction are measured from 2001 to 2010 at three hours intervals.
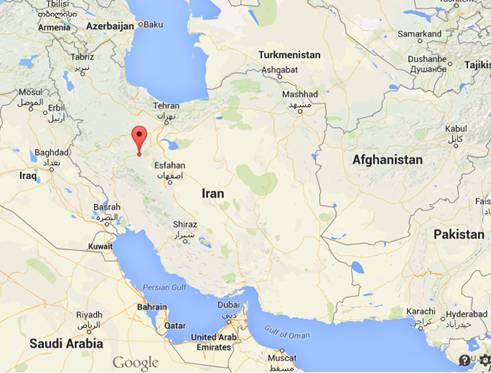
Fig. 1. Position of the studied site in Iran.
The distribution of wind speeds is important for the design of wind farms, power generators, and agricultural applications like irrigation. In recent years, some researchers have carried out the evaluation of wind energy potential for different regions by using various probability distribution functions such as Weibull, Rayleigh, Lognormal, Logistic and other distribution functions. The numerous studies for different locations of the world have shown that the Weibull two-parameter distribution gives favorable fits to the wind speed distributions[3-7].Unlike the other distribution functions (i.e. Lognormal, Logistic and Rayleigh), the Weibull distribution function has the advantage of making it possible to quickly determine the average of annual production of a given wind turbine with an acceptable accuracy level [14-17].Therefore, what differs this study from previous works is employing the Weibull distribution function to perform the wind resource assessment of a real site which had comparably low wind potential. This study shows although a site may not have enough potential for establishing huge wind farms, small wind turbines can still be operable in a feasible way to generate power and reduce green house gases. This study also presents the techno-economic viability of a small-scale wind turbine in the under investigated site.
2.1. Weibull Probability Density Function
Two important factors of Weibull function are k and c which are shape factor and scale factor and have to be specified for climate data in short time period [18]. Wind speed probability density functions is obtained from [19-21]:
![]() (k> 0, U> 0, c > 1) (1)
(k> 0, U> 0, c > 1) (1)
Where ν is the wind speed. In fact, k and c, define the potential of wind in the studied area. Weibull parameters, k determines how the wind distribution is and c indicates how ‘windy’ a wind location under observation is [22, 23]. They are defined as:
![]() (2)
(2)
 (3)
(3)
Where the average wind speed ![]() is expressed as:
is expressed as:
![]() (4)
(4)
![]() is the wind velocity variance and is obtained from:
is the wind velocity variance and is obtained from:
![]() (5)
(5)
Based on Weibull parameters, average wind speed and the variance of wind velocity can be determined as follows [24, 25]:
![]() (6)
(6)
![]() (7)
(7)
Where f(x) is gained from:
![]() (8)
(8)
If "k" is equal to 2, the Weibull distribution would be changed to Rayleigh distribution. The producers design, is often based on supplying standard proficiency for this specific condition of Weibull distribution [25]. Imprecise estimation in low wind speed near to zero, is the main weakness of the Weibull distribution but it is neglected from practical view because cut-in wind speed, is considered in the range of 2.5 to 3.5 m/s, depending on the size of the wind turbine [26, 27].
2.2. Wind Power Density
Power generation value of wind that moves the turbine blades is calculated by:
![]() (9)
(9)
Where ![]() is measured at a temperature of 288.15 K and a pressure of 101.325 kPa for air. The corrected monthly air density is obtained from [23]:
is measured at a temperature of 288.15 K and a pressure of 101.325 kPa for air. The corrected monthly air density is obtained from [23]:
![]() (10)
(10)
Where Rd is equal to 287 J/kg.K for dry air. The following equation is used for the corrected wind power at 10 m above the ground [21]:
![]() (11)
(11)
Although the density of air, changes with variation in temperature and height as well as wind speed, but it is assumed constant and is taken 1.225 in most of the studies due to the little changes of it, as previous investigations show inaccuracy is less than 5% [28]. Unit of wind power density which is expressed in (W/m2), which takes into consideration the frequency distribution of the wind speed as well as the association of wind power on wind speed and air density. Hence, wind power density is ordinarily regarded as a better index of wind energy than wind speed. Regarding to wind speed, the average wind power density is mentioned as [6]:
![]() (12)
(12)
Where i is the evaluated three-hourly wind speed and N is the entire sample data applied for each year. In addition, the wind power density can be calculated by Weibull distribution analysis as below:
![]() (13)
(13)
2.3. Wind Energy Density
Wind energy density denotes the quantitative value of available wind energy at the studied location. For a demanded period, T, it can be calculated as follows [6]:
![]() (14)
(14)
Regarding to the Betz limit, the maximum wind kinetic energy captured by a wind turbine is 59.3%. It signifies that 59.3% of Eq. (13) is obtainable in the best condition.
2.4. Most Probable Wind Speed
The significant defined wind speeds in wind energy progress, the most probable wind speed and the wind speed carrying maximum energy can be calculated from the shape and scale factors of the Weibull distribution. The most probable wind speed demonstrates the most repeated wind speed for a certain wind probability distribution and is obtained from [6]:
![]() (15)
(15)
2.5. Wind Speed Carrying Maximum Energy
The optimum wind speed which contains the most wind energy is called Wind speed carrying maximum energy and is calculated as:
![]() (16)
(16)
The turbine should be selected according to the optimum rated wind speed to produce maximum energy output [29]. Proportion of the actual generated electricity to the rated electricity output is defined as the capacity factor.
In this paper, an investigation on wind speed data from 2001 to 2010 for Arak, capital of Markazi province, has been done and Weibull distribution parameters, c and k, optimal rated wind speed, measured and predicted mean wind power and energy have been estimated. Results have been discussed in the next section.
Table 1. Monthly wind speed values and standard deviation during 2001 - 2010.
| Years | Parameters | Jan | Feb | Mar | Apr | May | Jun | July | Aug | Sep | Oct | Nov | Dec |
| 2001 | ν | 4.63 | 5.76 | 5.30 | 5.71 | 5.61 | 4.78 | 5.20 | 3.91 | 5.14 | 6.22 | 5.20 | 4.58 |
| ϭ | 0.82 | 0.31 | 0.15 | 0.26 | 0.15 | 0.67 | 0.26 | 1.54 | 0.31 | 0.77 | 0.26 | 0.87 | |
| 2002 | ν | 6.69 | 6.02 | 6.12 | 6.28 | 5.20 | 5.81 | 4.84 | 4.32 | 4.42 | 5.20 | 4.73 | 5.30 |
| ϭ | 1.08 | 0.41 | 0.51 | 0.67 | 0.41 | 0.21 | 0.77 | 1.29 | 1.18 | 0.41 | 0.87 | 0.31 | |
| 2003 | ν | 4.48 | 6.07 | 7.05 | 5.81 | 4.53 | 5.97 | 4.78 | 4.49 | 3.86 | 5.61 | 5.71 | 5.09 |
| ϭ | 0.82 | 0.77 | 1.75 | 0.51 | 0.77 | 0.67 | 0.51 | 0.36 | 1.44 | 0.31 | 0.41 | 0.21 | |
| 2004 | ν | 4.73 | 6.33 | 5.92 | 6.43 | 5.40 | 3.91 | 4.94 | 3.86 | 3.76 | 3.60 | 4.78 | 2.42 |
| ϭ | 0.26 | 1.85 | 1.44 | 1.95 | 0.93 | 0.51 | 0.87 | 0.67 | 0.72 | 0.87 | 0.31 | 2.06 | |
| 2005 | ν | 2.37 | 2.88 | 4.73 | 5.35 | 4.94 | 4.17 | 4.01 | 3.50 | 3.55 | 5.20 | 2.47 | 3.24 |
| ϭ | 2.06 | 1.54 | 0.31 | 0.93 | 0.51 | 0.26 | 0.41 | 0.93 | 0.87 | 0.77 | 1.95 | 1.18 | |
| 2006 | ν | 2.78 | 4.58 | 4.78 | 3.86 | 4.63 | 3.76 | 4.37 | 3.60 | 3.24 | 4.32 | 3.81 | 2.93 |
| ϭ | 1.39 | 0.41 | 0.62 | 0.31 | 0.46 | 0.41 | 0.21 | 0.57 | 0.93 | 0.15 | 0.36 | 1.23 | |
| 2007 | ν | 2.37 | 4.89 | 4.73 | 5.09 | 3.45 | 4.73 | 5.14 | 4.32 | 4.37 | 2.83 | 4.84 | 4.17 |
| ϭ | 1.34 | 1.18 | 1.03 | 1.39 | 0.26 | 1.03 | 1.44 | 0.62 | 0.67 | 0.87 | 1.13 | 0.46 | |
| 2008 | ν | 2.83 | 2.47 | 5.30 | 4.63 | 5.40 | 5.14 | 3.70 | 4.53 | 5.14 | 3.50 | 3.04 | 3.81 |
| ϭ | 1.95 | 2.31 | 0.51 | 0.15 | 0.62 | 0.36 | 1.08 | 0.26 | 0.36 | 1.29 | 1.75 | 0.98 | |
| 2009 | ν | 4.32 | 5.14 | 5.04 | 5.66 | 5.14 | 4.63 | 4.68 | 4.42 | 4.53 | 2.73 | 4.12 | 4.37 |
| ϭ | 0.57 | 0.26 | 0.15 | 0.77 | 0.26 | 0.26 | 0.21 | 0.46 | 0.36 | 2.16 | 0.77 | 0.51 | |
| 2010 | ν | 5.40 | 5.09 | 5.86 | 5.30 | 4.37 | 5.09 | 4.48 | 4.12 | 4.01 | 4.48 | 2.62 | 3.70 |
| ϭ | 0.62 | 0.31 | 1.08 | 0.51 | 0.41 | 0.31 | 0.31 | 0.67 | 0.77 | 0.31 | 2.16 | 1.08 | |
| Total year | ν | 4.06 | 4.92 | 5.48 | 5.41 | 4.87 | 4.80 | 4.48 | 4.15 | 4.20 | 4.37 | 4.13 | 3.96 |
| ϭ | 0.70 | 0.16 | 0.73 | 0.65 | 0.11 | 0.04 | 0.28 | 0.61 | 0.56 | 0.39 | 0.63 | 0.80 |
3. Results and Discussion
3.1. Monthly and Annual Mean Wind Speed Values
Based on the monthly mean wind speed values, standard deviations, σ, are calculated and presented in Table 1 from 2001 to 2010.The table indicates that the inclination of the mean wind speed for various years is almost uniform.
Generally, values of monthly wind speed vary between 4 and 5 m/s but there are some speeds out of this range. As it is shown in Fig. 2, the highest monthly mean wind speeds were occurred in March, the lowest values in September.
Totally, the maximum and minimum mean wind speeds are 7 and 2.3 m/s which were happened in March 2003 and January 2007 respectively. The frequency of the wind speed in 4 to 5 m/s is approximately 69%. As Fig. 2 illustrates, there is a uniform mean wind speed in the studied site and it is a positive point of this site which lets user to apply micro turbine for entire year. The mean annual wind speed is 4.57 m/s. The warm season with 4.67 m/s (spring and summer seasons) has a higher wind speed than the cold season (autumn and winter seasons) with 4.47 m/s.
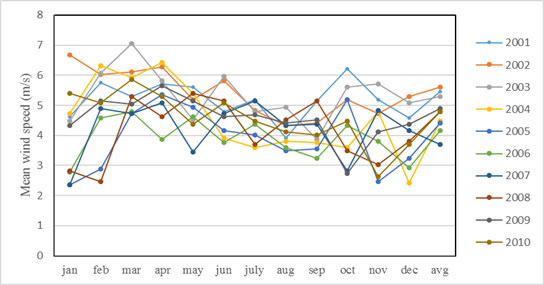
Fig. 2. Monthly average wind speed values from 2001-2008.
The annual mean wind speed can be calculated by averaging monthly mean wind speed in the year for the studied site. Results are indexed in Table 2 during 10 years.
The results indicate that range of yearly wind speeds are between 3.70 to 5.61 m/s with the maximum value happened in 2002 and minimum occurred in 2007.According to the PNNL (Pacific Northwest National Laboratory) assortment system, Arak is out of the category of the countries which are suitable for large-scale power generation yearly. But using the wind energy in this site is still attainable by the micro wind turbines.
3.2. Weibull Distribution Analysis
The annual Weibull parameters, c and k, are listed in Table 2 which were calculated from the long-term wind data of the studied site.
The yearly average value of k is 4.31 and c is 5.18 from 2001 to 2010. Fig. 3 illustrates annual diagram of measured and Weibull wind speed frequency for entire 10 years in Arak. Most percentage errors between Weibull and measures wind speed frequencies occurred at 5 m/s with a value of 29%. Generally, Figure 3 shows that Weibull function has an acceptable compatibility with the observed data [30].
Table 2.The annual predicted and measured wind speed values, k, c and ![]() values from 2001 to 2010.
values from 2001 to 2010.
| years | k | c (m/s) | v (measured) | v (predicted) | |
| 2001 | 4.80 | 6.60 | 5.45 | 5.17 | 8.54 |
| 2002 | 4.91 | 7.55 | 5.61 | 5.41 | 8.81 |
| 2003 | 4.70 | 6.10 | 5.30 | 5.32 | 8.72 |
| 2004 | 3.91 | 5.32 | 4.48 | 4.56 | 7.84 |
| 2005 | 3.87 | 3.87 | 4.42 | 3.87 | 7.05 |
| 2006 | 3.72 | 3.44 | 4.17 | 3.89 | 7.08 |
| 2007 | 3.52 | 2.98 | 3.70 | 4.24 | 7.48 |
| 2008 | 4.51 | 4.84 | 4.78 | 4.12 | 7.35 |
| 2009 | 4.69 | 5.02 | 4.89 | 4.57 | 7.85 |
| 2010 | 4.49 | 6.09 | 4.78 | 4.54 | 7.83 |
| Annual | 4.31 | 5.18 | 4.76 | 4.57 | 7.86 |
3.3. Calculation of Wind Power and Energy Density
It is obvious that wind power and energy density depend on wind speed and rotor swept area which can be obtained from Equations (13) and (14). The maximum wind power can be achieved in March with 205 W/m2 while the minimum one occurs in December with 98 W/m2 and energy density is between 70 to 148 kWh/m2/month.
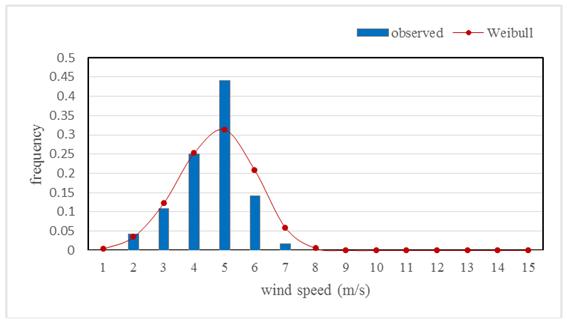
Fig. 3. The diagram of Weibull distribution of wind speed for entire 10 years in Arak.
As it is shown in Table 3, the predicted power and energy density by Weibull distribution is greater than the measured power and density of wind in Arak. One of main reasons is the low wind speed in studied site as Zhou at al [31] found out that discrepancies of the Weibull predictions and meteorological data when the wind speed is in low ranges are much greater. In fact, whatever wind speed go far more from lower range, the predicted values of Weibull function are more Coincident.
Monthly wind power density is illustrated in Fig. 4. Difference between maximum and minimum value of wind power is 107 W/m2. Figure 4 can be used for assessing a wind power project. According to the Betz equation, only 59.3% of wind power is achievable. For example, maximum extractable wind power in March which have most wind power is 0.593 multiplied by 234 W/m2and multiplied by swept area of wind turbine. The results for wind power and energy which are reported in Table 3 are for 10 m height. Polar diagram of wind speed is plotted in Fig. 5 which shows direction of wind in Arak. It is obvious that prevailing winds are expected from south (270°) on a percentage of 53%.
Table 3.The Weibull predicted and the measured power and energy density based on Weibull distribution.
| years | Weibull | Meteorological | ||
| P/A (W/m2) | E/A (kWh/m2/month) | P/A (W/m2) | E/A (kWh/m2/month) | |
| 2001 | 176.30 | 126.93 | 131.17 | 94.44 |
| 2002 | 199.22 | 143.44 | 152.54 | 109.83 |
| 2003 | 193.84 | 139.56 | 148.07 | 106.61 |
| 2004 | 143.12 | 103.04 | 104.55 | 75.27 |
| 2005 | 95.58 | 68.82 | 63.16 | 45.48 |
| 2006 | 90.82 | 65.39 | 57.94 | 41.72 |
| 2007 | 114.30 | 82.30 | 77.84 | 56.04 |
| 2008 | 109.93 | 79.15 | 74.91 | 53.94 |
| 2009 | 132.26 | 95.22 | 92.55 | 66.64 |
| 2010 | 133.45 | 96.08 | 94.17 | 67.80 |
| Annual | 138.88 | 99.99 | 99.69 | 71.78 |
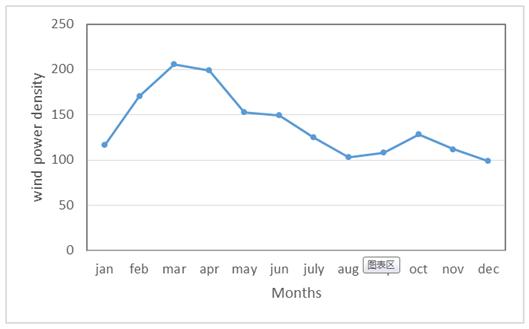
Fig. 4. Monthly wind power density.
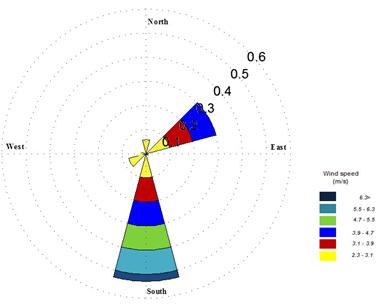
Fig. 5. Polar Diagram of wind direction.
3.4. Energy and Economic Investigation of a Micro Wind Turbine in the Studied Site
Investigations imply that wind potential of the studied site is weak to produce electricity in a large scale, however, it could be applied for small scale power generation like domestic application. Two small wind turbines, WHISPER500 (3 kW rated power) and SKYSTREAM3.7 (1.8 kW rated power) are chosen. The start up speed of both of these micro wind turbines is 2 m/s. Energy curves of the selected wind turbines, are illustrated in Fig. 6 [32, 33].
Capital cost and technical specifications of both wind turbines are listed in Table 4.
Table 4. Capital cost and technical specifications ofWHISPER500 and SKYSTREAM3.7 micro wind turbines.
| Specifications | WHISPER 500 | SKYSTREAM 3.7 |
| Capital Cost ($) | 7095 | 5399 |
| Rotor Diameter (m) | 4.5 | 3.72 |
| Start-Up Wind Speed (m/s) | 3.4 | 3.5 |
| Rated Power (W) | 3000 | 1800 |
| Peak Power (W) | 3200 | 2400 |
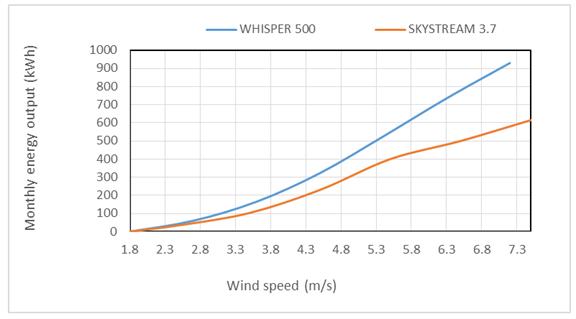
Fig. 6. Energy curves of WHISPER500 and SKYSTREAM3.7 micro wind turbines.
Calculation results show that WHISPER500 generates annual energy of 3975 kWh, while the SKYSTREAM3.7 produces 2961 kWh. Regarding to the price of selling the renewable generated electricity to government, as much as 0.1543 $ for year of 2014 [11], annual incomes are 613.475 and 456.981 $ for WHISPER 500 and SKYSTREAM 3.7 respectively. Lifetime of each wind turbine is assumed 15 year with respect to 20% growth of electricity price, internal interest rate (IRR) is 20.5%for SKYSTREAM 3.7 and 20.9% for WHISPER 500. Furthermore, considering 20% interest rate, payback periods are calculated as 11.8 years for SKYSTREAM 3.7 and 11.6 years for WHISPER 500.
Currently, it might be irrational to invest on such projects but in many countries, governments assign facilities for customers who decide to run renewable energy generation. Typically, if the customer pays half of the capital cost first and the rest of it could be paid as loans during 15 years, IRR for WHISPER500 would be 29.27%. Furthermore, based on the reports in recent years, global warming is a crucial issue which would treat many countries in near future. Hence, serious efforts are done in the international communities to prevent its growth. Knowing significant effects of using wind turbines for decreasing the CO2 emissions, makes these projects more attractive and viable. Following equations are used to calculate CO2 emission penalty cost [33]:
![]() (17)
(17)
![]() (18)
(18)
Where ![]() stands for the amount of CO2 emission (kg),
stands for the amount of CO2 emission (kg),![]() is the emission conversion factor of grid electricity (kg/kWh), Selec denotes the annual electricity consumption (kWh),
is the emission conversion factor of grid electricity (kg/kWh), Selec denotes the annual electricity consumption (kWh),![]() represents the annual CO2 emission penalty cost ($) and
represents the annual CO2 emission penalty cost ($) and![]() is the CO2 emission penalty cost ($/kg) which is considered as 0.09 $/kg [34].
is the CO2 emission penalty cost ($/kg) which is considered as 0.09 $/kg [34].
The results show that using the WHISPER500 and SKYSTREAM3.7 can save 347 and 258 $ respectively by reduction of CO2 emission annually.
4. Conclusion
In this study, an assessment of wind energy potential in Arak has been done using Weibull probability function during the years 2001 to 2010. Arak has almost uniform wind speed and most of monthly mean wind speeds are in the range of 4 to 5 m/s. Two parameters of Weibull, k and c which are shape factor and scale factor, have been obtained for each month and they were reported as average of total years. Based on Weibull prediction, average of k and c during total years are 4.31 and 5.19 respectively. Also it is predicted that mean wind power density changes in range of 98.47 to 205 W/m2 which happen in December and March respectively. Based on the estimation of wind power characteristics for the studied area, two micro wind turbines, SKYSTREAM3.7 and WHISPER500, have been selected to evaluate and compare operation of micro wind turbines in the studied site. The results show that SKYSTREAM3.7 annually produces 2961 kWh while WHISPER500 generates 3975 kWh. For evaluation of each wind turbine, capital costs and renewable electricity price should be considered. The results indicate that WHISPER500 has a slight priority against SKYSTREAM3.7 as the IRR values are 20.9% and 20.5% respectively. Although, the described projects are not economically justified in the mentioned situation regarding to low returns of capital costs, but more supports by the government like devoting loans and estimation of the considerable amount of CO2 emission decrements can make them more attractive. Calculations indicate that WHISPER500 and SKYSTREAM3.7 can reduce charges due to CO2 emissions reduction by 347 and 258 $ per year respectively.
[1] References
[2] American Wind Energy Association (AWEA), www.awea.org
[3] Manwell, J. F., McGowan, J. G., & Rogers, A. L. (2010). Wind energy explained: theory, design and application. John Wiley & Sons.
[4] Nedaei, M. (2014). Wind resource assessment in Hormozgan province in Iran. International Journal of Sustainable Energy, 33(3), 650-694.
[5] Drew, D. R., Barlow, J. F., Cockerill, T. T., &Vahdati, M. M. (2015). The importance of accurate wind resource assessment for evaluating the economic viability of small wind turbines. Renewable Energy, 77, 493-500.
[6] Shu, Z. R., Li, Q. S., & Chan, P. W. (2015). Investigation of offshore wind energy potential in Hong Kong based on Weibull distribution function. Applied Energy, 156, 362-373.
[7] Nedaei, M., Assareh, E., &Biglari, M. (2014). An extensive evaluation of wind resource using new methods and strategies for development and utilizing wind power in Mah-shahr station in Iran. Energy Conversion and Management, 81, 475-503.
[8] Bilir, L., İmir, M., Devrim, Y., &Albostan, A. (2015). An investigation on wind energy potential and small scale wind turbine performance at İncek region–Ankara, Turkey. Energy Conversion and Management, 103, 910-923.
[9] Weisser, D. (2003). A wind energy analysis of Grenada: an estimation using the ‘Weibull’ density function. Renewable Energy, 28(11), 1803-1812.
[10] Panda, R. K., Sarkar, T. K., & Bhattacharya, A. K. (1990). Stochastic study of the wind-energy potential of India. Energy, 15(10), 921-930.
[11] Ulgen, K., Genc, A., Hepbasli, A., & Oturanc, G. (2004). Assessment of wind characteristics for energy generation. Energy Sources, 26(13), 1227-1237.
[12] Renewable energy organization of Iran (SUNA), www.suna.org.ir
[13] Mostafaeipour, A. (2010). Feasibility study of harnessing wind energy for turbine installation in province of Yazd in Iran. Renewable and Sustainable Energy Reviews, 14(1), 93-111.
[14] Meteorological organization of Iran. http://www.weather.ir/english
[15] Masseran, N. (2015). Evaluating wind power density models and their statistical properties. Energy, 84, 533-541.
[16] Kantar, Y. M., & Usta, I. (2015). Analysis of the upper-truncated Weibull distribution for wind speed. Energy Conversion and Management, 96, 81-88.
[17] Ataei, A., Choi, J-K., & Nedaei, M. (2015). Evaluating the Potential of Wind Power in Orderto Electrify a Remote Village in South East of Iran. American Journal of Renewable and Sustainable Energy, 1(2), 58-65.
[18] Wang, J., Qin, S., Jin, S., & Wu, J. (2015). Estimation methods review and analysis of offshore extreme wind speeds and wind energy resources. Renewable and Sustainable Energy Reviews, 42, 26-42.
[19] Seguro, J. V., & Lambert, T. W. (2000). Modern estimation of the parameters of the Weibull wind speed distribution for wind energy analysis. Journal of Wind Engineering and Industrial Aerodynamics, 85(1), 75-84.
[20] Chang, T. J., Wu, Y. T., Hsu, H. Y., Chu, C. R., & Liao, C. M. (2003). Assessment of wind characteristics and wind turbine characteristics in Taiwan. Renewable energy, 28(6), 851-871.
[21] Justus, C. G., Hargraves, W. R., Mikhail, A., & Graber, D. (1978). Methods for estimating wind speed frequency distributions. Journal of applied meteorology, 17(3), 350-353.
[22] Johnson GL. Wind energy systems. USA: Prentice-Hall; 1985.
[23] Mostafaeipour, A., Sedaghat, A., Dehghan-Niri, A. A., & Kalantar, V. (2011). Wind energy feasibility study for city of Shahrbabak in Iran. Renewable and Sustainable Energy Reviews, 15(6), 2545-2556.
[24] Ataei, A., Biglari, M., Nedaei, M., Assareh, E., Choi, J.-K., Yoo, C. and Adaramola, M. S. (2015), Techno-economic feasibility study of autonomous hybrid wind and solar power systems for rural areas in Iran, A case study in Moheydar village. Environ. Prog. Sustainable Energy. doi: 10.1002/ep.12121
[25] Keyhani, A., Ghasemi-Varnamkhasti, M., Khanali, M., & Abbaszadeh, R. (2010). An assessment of wind energy potential as a power generation source in the capital of Iran, Tehran. Energy, 35(1), 188-201.
[26] Jamil, M. (1994). Wind power statistics and evaluation of wind energy density. Wind Engineering, 18(5), 227-240.
[27] Persaud, S., Flynn, D., & Fox, B. (1999). Potential for wind generation on the Guyana coastlands. Renewable Energy, 18(2), 175-189.
[28] Anonymous. VESTAS. Products. Available from, http://www.vestas.com; 2015.
[29] Hennessey Jr, J. P. (1977). Some aspects of wind power statistics. Journal of applied meteorology, 16(2), 119-128.
[30] Johnson GL. Wind energy systems. USA: Prentice-Hall; 1985.
[31] Morgan, V. T. (1995). Statistical distributions of wind parameters at Sydney, Australia. Renewable energy, 6(1), 39-47.
[32] Zhou, W., Yang, H., & Fang, Z. (2006). Wind power potential and characteristic analysis of the Pearl River Delta region, China. Renewable Energy, 31(6), 739-753.
[33] National photovoltaic construction partnership, http://www.npcpsolar.com/images/skystreamspec.pdf
[34] Texas solar power company, http://www.txspc.com/PDF/whisper_500_spec.pdf
[35] Wang, J., Zhai, Z. J., Jing, Y., & Zhang, C. (2010). Particle swarm optimization for redundant building cooling heating and power system. Applied Energy, 87(12), 3668-3679.


