
Physics Journal, Vol. 1, No. 2, September 2015 Publish Date: Aug. 10, 2015 Pages: 62-70
Stability Analysis of 3D Beams
Velpuri Gopi Krishna, L. Bhaskara Rao*
School of Mechanical and Building Sciences, VIT University, Chennai Campus, Tamil Nadu, India
Abstract
Stability and dynamic response of a beam which is undergoing deflection is analysed by using various finite element methods. This formulation presents easy and efficient way to find stability of beam among various material properties and boundary conditions. Purpose of this paper mainly deals with various materials and boundary conditions, determining the perfect material and boundary condition to stabilise the beam for long time. This is one of the effective approaches to find the stability of beam. By using the Ritz method of approximation and cubic polynomial, the stiffness matrix is derived for following conditions. Stability of a structure can be usually defined by its ultimate strength to resist load and being stable before its mode of failure. There are two types of analysis namely linear and nonlinear which are used to find the deformation of a beam. In this paper, linear analysis is used to find the stability of the beam by using various analytical approaches like structural analysis, harmonic analysis etc. Among those mentioned approaches which define the stability of the beam more accurately is buckling analysis. This was proven by using various analytical approaches.
Keywords
Stability, Beam, End Condition, Finite Element Analysis
Received: June 29, 2015
Accepted: July 29, 2015
Published online: August 9, 2015
@ 2015 The Authors. Published by American Institute of Science. This Open Access article is under the CC BY-NC license. http://creativecommons.org/licenses/by-nc/4.0/
1. Introduction
Beams are structural members which are used to resist load under equilibrium condition. In particular, every beam cross-section with any material property has some stability where the value of the stability changes with respect to the cross section. Stoykov and Ribeiro [1] have shown with change in stiffness across the geometry there will be a change in bending and torsion. Finding the ultimate strength of a beam is the major challenge. Changes in the ultimate strength are due to the change in sectional properties and material property of the beam. Francesco et al., [2] shown that beams are strengthened to estimate the capacity of load carried and to highlight the external warping on strengthened beams structurally.
A beam can buckle because of its self-weight, so the definition of the cross-section of beam is essential. Ma et al., [3] shown that the designed member must guarantee minimum safety to the customer and it must not be much expensive. Mostly strength and safety of the column is defined by the slenderness of the column. Beam is said to be in equilibrium if it is supported by its supports under the action of load [4]. Principle of Virtual work states that if a system is in equilibrium under the action of set of forces will be subjected to virtual displacement where work done by the set of forces will be zero. Jian and Jie [5] proved that stability of beam differs with change in beam condition.
Raghuvir and Balaji [6] has shown that for thin walled elements mostly isotropic and anisotropic composite materials are mostly used in many engineering applications like aerospace, marine, building and many industrial applications. In the beam lateral investigation it has been proven that the shortening effects and pre buckling deformation have an effect on stability of beam [7]. In order to perform the stability analysis, rectangular cross section with parameters shown in Fig.1 has been considered in this study.
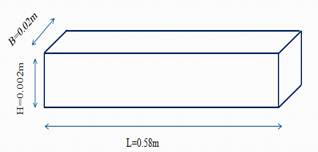
Fig. 1. Cross section details.
Mahzuz [8] studied the performance evaluation of triangular singly reinforced concrete beam and shown that the rectangular cross-section beams are most commonly used in buildings and bridges, machinery such as girders, joists, stringers etc. and constructions. Main objective is to find stability of beam by performing various linear analyses and find the best method to find stability of beam. Beams with various end conditions are considered in this study. Some of the beam conditions are Clamped- Clamped, Clamped-Free, SS-Clamped, SS- Free, Guided-SS, SS-SS, Guided-Guided, Guided-free, and Guide- Clamped etc.
2. Analysis
Analytically the best approach to find the stability of the beam is finite element analysis. There are 3 methods of solving problems within finite element analysis. These methods are: h- method, p-method and hp-method.
H-method: In this method the value of accuracy increases with increase in element size. The h-method improves results by using a finer mesh of the same type of element. This method refers to decreasing the characteristic length (h) of elements, dividing each existing element into two or more elements without changing the type of elements used.
P-method: The p-method improves results by using the same mesh but increasing the displacement field accuracy in each element. This method refers to increasing the degree of the highest complete polynomial (p) within an element without changing the number of elements used. With refining shape function the value to the accuracy increases.
HP-method: In this method the value of accuracy increases with increasing both number of elements and shape functions. Both the element size and shape functions are considered in this case.
The stability of the beam can be found by structural analysis, harmonic analysis etc. In the structural analysis the values give the formation of shear, equivalent stress distribution along the beam [9]. Whereas the harmonic analysis gives the value of displacement along with frequency from step to step. In addition to aforementioned methods, stability of the beam can be found out by using buckling analysis. Lazopoulo [10] studied the major reason for considering the buckling analysis to find the stability of beam.
3. Beam Element Derivation
Consider an Euler-Bernoulli beam of length ‘L’ and cross – sectional area ‘A’ with mass density ρ. Beams are straight bar elements which are subjected to transverse loads. Deformation in beams is described by slope and displacement. Beam element consists of 2 nodes and each node supports 2 degree of freedom.
The governing differential equation [11] for Euler-Bernoulli beam is expressed as:
![]() (1)
(1)
Consider a beam with length L in xy plane as shown in Fig 2
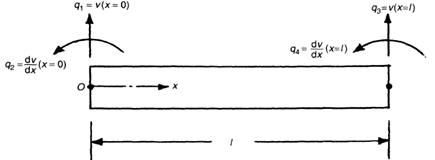
Fig. 2. Beam with length L in xy plane.
Mentioned Degrees of Freedom in beam are specified as ![]() Cubic displacement model for
Cubic displacement model for ![]() is given as:
is given as:
![]() (2)
(2)
Constants ![]() can be found by using following conditions:
can be found by using following conditions:
![]() and
and ![]() at x=0 and
at x=0 and ![]() and
and ![]() at x =
at x = ![]()
There are many methods which are used to obtain solution. Some of methods like Galerkin method, Sub-domain method, Rayleigh Ritz etc. Among the above mentioned methods, Ritz method gives the most approximate solution compared to all other methods. Ritz equation for this method is expressed as:
![]() (3)
(3)
where E - Young’s modulus and I - Moment of inertia.
Equation can be expressed in the matrix form as:
![]() (4)
(4)
Where 
According to Euler-Bernoulli beam theorem section plane remains plane even after deformation. Therefore ‘u’ the axial displacement owed to transverse displacement ![]() can be expressed as [Fig. 3]:
can be expressed as [Fig. 3]:
![]() (5)
(5)
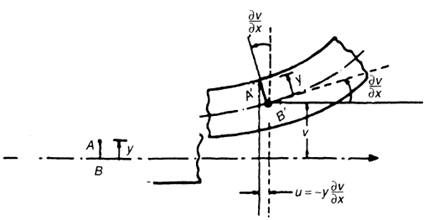
Fig. 3. Deformation of a beam in xy plane.
Where y is the distance from neutral axis.
For single element
At ![]() (6a)
(6a)
At ![]() (6b)
(6b)
At ![]() (6c)
(6c)
At ![]() (6d)
(6d)
Eqs. (6a) to (6d) can be represented in the following matrix form
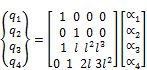 (7)
(7)
Then approximate solution becomes
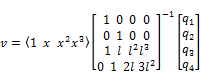 (8)
(8)
From Eq. (7) shape functions are obtained which are helpful to find the element shape functions.
![]() (9a)
(9a)
![]() (9b)
(9b)
![]() (9c)
(9c)
![]() (9d)
(9d)
Let us assume that
![]() Where
Where ![]() and
and ![]()
Where ![]() (10)
(10)
From the above assumption let us consider the left side of Eq. (3) as:
![]() (11)
(11)
Substituting Eqs. (9a)- (9d) into Eq. (10) yields the following stiffness matrix:
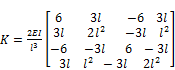 (12)
(12)
Now considering the right hand side of the equation Eq. (3) and Eqs. (9a)- (9d) then the following equation is obtained
![]() (13)
(13)
In Eq. (12), the work done by the momentum and load are negligible. Therefore, the equation is reduced to:
![]() (14)
(14)
Substituting Eq. (9) into Eq. (13), the following mass matrix is obtained:
![]() (15)
(15)
We can represent the above equations in the following form
![]() (16)
(16)
The displacement and rotation of beam can be computed from Eq. (15). Tahmaseb Towliat Kashani et al., [12] have presented the same procedure and are repeated for xz plane in order to obtain the element stiffness matrix. Combining all the elements gives the element Global stiffness matrix.
4. Material Properties
With change in material property, the stability of the beam changes. Rakesh et al., [13] shown the influence on elastic properties of beams by varying poisons ratio for a material and behaviour of the beam is observed. The material properties considered in this problem are mostly used in many engineering applications. Various materials and their properties which are considered in this problem are represented in Table. 1.
Table 1. Material Properties.
| S. No | Material | Young’s modulus (GPa) | Poisson’s ratio | Density (kg/m3) |
| 1 | Concrete high strength | 41 | 0.2 | 2400 |
| 2 | Stainless steel | 206.844 | 0.295 | 7820 |
| 3 | Aluminium | 70 | 0.334 | 2700 |
| 4 | Lead | 13.7896 | 0.431 | 11342 |
| 5 | Rubber | 2.5 | 0.5 | 1200 |
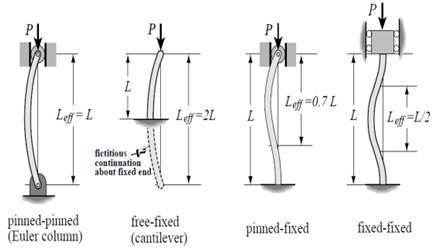
Fig. 4. Various beam end conditions.
5. Buckling
There are mainly three types of failures of buckling in beams. Most of these failures occur in beam is due to its dead weight alone. These types of failures occur mainly in the application of structural engineering [10]. Various failures are as follows:
Type I -This failure is most common in simply supported beams. If a beam is supported on bearings where rotation is allowed long the major axis and minor axis is fixed on the other side. In this case there is a possibility for the beam to buckle on one side where the rotation is restrained at supports by bearings. In this case when the major axis is subjected to rotation it forms a twist in the beam and the minor axis form bending which leads to a lateral torsional buckling [14].
Type II- This mode of failure occurs during the transportation. When the beams are transported in a truck where the arrangement of beams supports and turntables of truck is not restrained against rotation. So the buckling occurs than that of the simply supported case.
Type III- This type of failure is similar to that of the above case. In this transportation is not taken by the truck but by a crane. In this case beam can twist as a rigid body due to the twist. Some part of the beam weight acts along the minor axis. Due to this, large deflections can occur without change in value of twist along beam. This type of deflections is called as toppling. This is the most critical of all the three cases and this type of problems are called as hanging beam problem.
In buckling, the end conditions also play a key role with respect to the applied critical load as shown in Fig. 4. This can be expressed in the form of:
![]() (17)
(17)
Where ![]() denotes the effective length of a column, E – Young’s modulus and I- Moment of inertia.
denotes the effective length of a column, E – Young’s modulus and I- Moment of inertia.
6. Methodology
The methodology follows here is that the validation of the results analytically by using modal analysis with base material as aluminium under clamped-clamped end condition. To know the dynamic response of a beam, the modal analysis has been performed for different beam end conditions and materials to know the least fundamental frequency of beam. As discussed earlier beam with least frequency will always has more strength to with stand for applied load. In order to prove this statement various analysis like static, harmonic and buckling analysis has been performed under different load set ups with different materials and end conditions.
After performing analysis like structural and dynamic, the beam with least fundamental frequency and maximum deformation is selected under particular end condition that has been chosen to find stability of beam. For that particular chosen end condition, the harmonic analysis has been performed under different load set ups to know the failure of beam at particular frequency under different materials. Comparing all the results at particular end condition for different material, the buckling analysis is performed to know the stability of beam. The results are compared once again to find stability of beam. The numerical results obtained are in good agreement with the previously published data [15].
7. Results and Discussion
As discussed above, the value of accuracy changes with increasing element size in h-method. At element size of 15 the value obtained is nearly equal to that of the published result [15]. Units for the fundamental frequency are hertz (Hz). In a similar way, the modal analysis is performed for different materials with different beam conditions. The condition and material which gives the lowest fundamental frequency is lead with Clamped – Free beam end condition.
The lowest fundamental frequency for the Clamped – Free beam with various materials is presented in Tabel.2.
Table 2. Lowest fundamental frequency.
| S. No | Material | Fundamental frequency (rad/sec) |
| 1 | Lead | 6.6538 |
| 2 | Rubber | 8.7097 |
| 3 | Concrete | 24.9411 |
| 4 | Steel | 31.0345 |
| 5 | Aluminium | 30.2912 |
Structural analysis is performed to find out the maximum displacement of the beam. Structural analysis is performed for different materials with different end conditions at different load set ups. Among different end conditions clamped-free end condition gives the maximum deformation and the lowest fundamental frequency. Maximum deformation is selected because when we perform non-linear analysis we always go for large deformations to know the deformation of beam. Structural analysis is performed on the Clamped – Free beam condition by using different materials. The displacement values are presented in Table 3. Point load is applied at the middle of the beam in the structural analysis. The static analysis is carried out by considering a load as 1500 N and the type of element is 3node Beam 189.
Table 3. Static analysis results.
| S. No | Material | Deformation value (m) |
| 1 | Lead | 1.66115 |
| 2 | Rubber | 9.16137 |
| 3 | Concrete | 0.558431 |
| 4 | Steel | 0.110702 |
| 5 | Aluminium | 0.327133 |
Based on the above results, Rubber material has the maximum displacement value compared to all other materials. The elastic nature of the Rubber material is high compared to all other materials. So with high elastic nature, rubber material will always have the maximum deformation. So the material named rubber is eliminated due to the high elastic nature. Next material with maximum displacement is Lead and it is mostly considered material in many applications. Due to its stiffness which has high young’s modulus, it provides greater strength. But this material is rarely chosen due to its high cost. Deformation for the beam is shown Fig.5.
From the above results it is observed that the Lead material has the lowest fundamental frequency and the maximum displacement value under Clamped – Free beam condition. This is the best suitable condition to find the stability of the beam. Stability of the beam can be measured by using both the harmonic and Eigen buckling analysis. Harmonic analysis gives the ability to predict the sustained dynamic behaviour of the structures, thus enabling to verify whether or not, the design of the structure will successfully overcome resonance, fatigue, and other harmful effects of forced vibrations. Fig. 6 shows the Frequency Vs. displacement curve for lead material for Clamped – Free condition. Resonance is occurring in beam when the frequency values lies between 7 to 13 Hz and 64 to 68 Hz. This is the range we should avoid when we model the beam to keep it stable for the particular material and end condition.
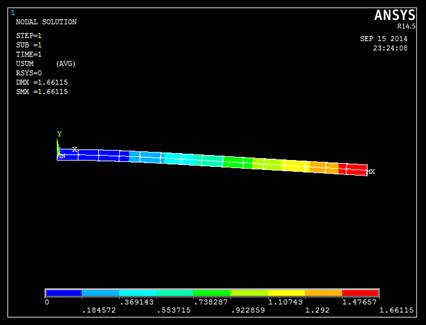
Fig. 5. Deformation of beam in clamped-free condition with Lead material.
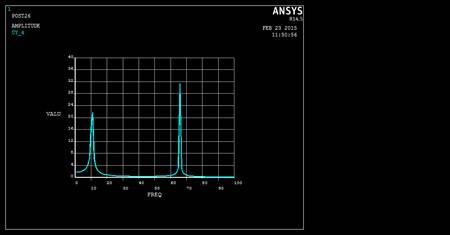
Fig. 6. Logarithmic frequency plot of beam with respect to load.
Data obtained from Fig. 6 are illustrated in Table. 4. Results that are obtained after performing harmonic analysis are:
Table 4. Harmonic analysis results.
| S. No | Frequency (Hz) | Amplitude (m) |
| 1 | 1.000 | 1.67 |
| 2 | 6.000 | 2.49 |
| 3 | 11.000 | 21.67 |
| 4 | 18.000 | 1.02 |
| 5 | 36.000 | 0.29 |
| 6 | 55.000 | 0.37 |
| 7 | 60.000 | 0.60 |
| 8 | 66.000 | 31.38 |
Displacement vector sum for the first mode shape is shown in Fig.7
For this fundamental frequency maximum deformation value obtained shown in Fig.7 is 1.67m and minimum deformation value is 0.18m where the beam loses its stability from that particular deformation and subjected to crack formation. It is the location where material starts to fail. By comparing results of modal and structural analysis results with harmonic results. Maximum deformation value obtained for lead material is 1.6615m and the frequency value obtained is 6.6538 rad/sec. From results of harmonic analysis beam failure starts at a frequency range of 7 to 13 Hz. So harmonic analysis gives the perfect range of frequency where beam failure starts and the maximum deformation obtained by a beam. Harmonic analysis results are compared with buckling analysis results however harmonic analysis won’t give the exact value of deformation. Buckling analysis can only detect to the exact point where beam buckling is started. Whereas in the case of harmonic analysis it is fully constrained with respect to the no of mode shape to be obtained and the frequency range considered for the analysis. That is the reason why harmonic analysis cannot give the exact value of the beam failure. The results that are obtained after performing Eigen buckling analysis is illustrated in Fig. 8.
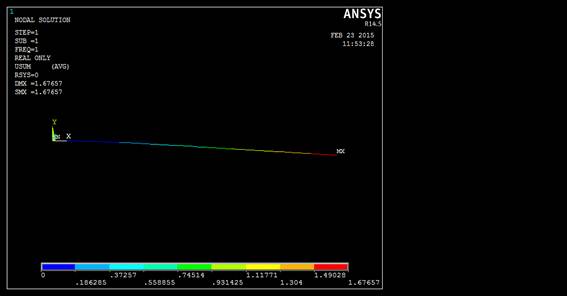
Fig. 7. Displacement vector sum for fundamental frequency.
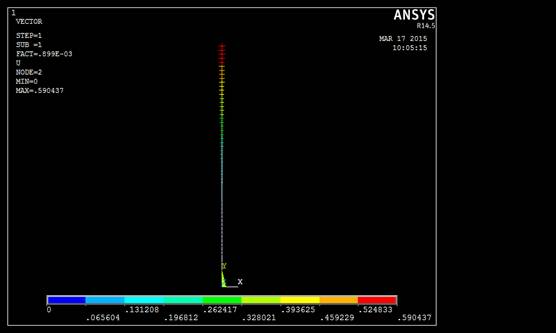
Fig. 8. Predefined vector plot for buckling analysis.
Buckling analysis gives the perfect value of load where buckling is started. In order to perform this buckling analysis compressive load was applied at top end of the beam. The factor which defines the buckling of a beam for a particular beam condition is buckling load factor. When buckling load is applied, beam will become unstable and characteristic mode shape is obtained with respective to buckling of structure. Buckling mainly depends up on the stiffness of component but not on the strength of material. Stability loss of component occurs within the elastic nature of it. So in order to find this the buckling analysis is performed. The buckling load factor for the Clamped – Free condition with various materials is presented in Table 5.
Table 5. Comparison of Buckling load Factor.
| S. No | Material | Buckling load factor (From ANSYS) | Critical load numerical | Critical load theoretical |
| 1 | lead | 0.89904E-03 | 1.34856 | 1.34823 |
| 2 | concrete | 0.26731E-02 | 4.00965 | 4.00864 |
| 3 | Aluminium | 0.45638E-02 | 6.8457 | 6.8286 |
| 4 | Stainless steel | 0.13486E-01 | 20.229 | 20.223 |
Critical load for Clamped-Free condition is computed from Eq. (17). It is observed that the lead material has low critical load factor among all other materials. From the results which are obtained from the Table.2, 3, 4 and 5. Among all the considered material properties and boundary conditions for a particular beam clamped – free boundary condition with lead material has the lowest stability for the particular beam we have chosen. The results are compared with Stoykov [15] are presented in Table. 6.
Table 6. Modal analysis.
| Frequency (rad/sec) | Elements | ||||
| 6 | 10 | 15 | 20 | ||
| ω1 | Stoykov | 192.7914 | 192.7421 | 192.7365 | 192.7356 |
| Present | 192.88 | 192.755 | 192.7367 | 192.7367 | |
| ω2 | Stoykov | 532.6710 | 531.3805 | 531.2543 | 531.2343 |
| Present | 534.3472 | 531.6328 | 531.3061 | 531.2496 | |
| ω3 | Stoykov | 1055.334 | 1042.567 | 1041.490 | 1041.332 |
| Present | 1063.9943 | 1044.3282 | 1041.877 | 1041.4379 | |
| ω4 | Stoykov | 1792.163 | 1727.719 | 1722.028 | 1721.261 |
| Present | 1919.0732 | 1821.7467 | 1723.6662 | 1721.7812 | |
Results shown in Table.6 are validated with the results by Stoykov [15]. Results presented in Table.6 are obtained by performing modal analysis on Aluminium beam with clamped – clamped boundary condition.
8. Conclusion
Beams have a very important usage in engineering applications particularly in structural and mechanical application. To serve this usage beam should have the stability to withstand at any load. In order to define the stability of beam various analysis are used like structural, modal, harmonic and Eigen buckling analysis. Each analysis mentioned above has its own criteria to define the stability of the beam. But the best analysis which gives the best value for the stability is Eigen buckling analysis. But buckling analysis always gives the results with in elastic limit. It means that it gives the deformation for beams with in elastic limit. The beam is not going to fail with in elastic limit. This can be shown from the above obtained results where buckling analysis gives the critical load of 1.34856 (where the beam exactly starts to buckle) with maximum deformation of .590437m.
Maximum deformation obtained in structural and harmonic analysis is 1.66115m and 1.67657m respectively. But the value obtained in buckling analysis is 0.590437m and this is the value obtained with in elastic limit. But structural and harmonic analysis show that the beam could deform maximum of 1.66115m and 1.67657m respectively which is not with in elastic limit. So to find the stability of beam linearly (with in elastic limit) buckling analysis gives the perfect results. But to find stability of beam non-linearly buckling analysis doesn’t give the perfect results. It is not that much simple to define the stability of the beam by using one method (h-method) that too by performing linear analysis. There are better methods which gives the better results than the h- method like p-method and hp-method. This continues the further scope of work with non- linear analysis.
References
- S. Stoykov and P. Ribeiro , Stability of nonlinear periodic vibrations of 3D beams, International Journal of Nonlinear Dynamics, 66(3), 335-353 (2011).
- Bencardino Francesco and Condello Antonio, Structural behaviour of RC beams externally strengthened in flexure with SRG and SRP systems, International Journal of Structural Engineering, 5(4) 346-368 (2014).
- Chau-Khun Ma, Abdullah Zawawi Awang and Wahid Omar, Slenderness effect and upper-bound slenderness limit of SSTT-confined HSC column, International Journal of Structural Engineering, 5(3) 279-286 (2014).
- M. Petyt, Finite Element Vibration Analysis, Cambridge University Press, Cambridge (2010).
- Jian-She Peng, Yan Liu and Jie Yang A, Semi analytical Method for Nonlinear Vibration of Euler-Bernoulli Beams with General Boundary Conditions, Mathematical Problems in Engineering, 2010 (591786) 1-17 (2010).
- Raghuvir Mehta and P. S. Balaji, Static and Dynamic Analysis of Functionally Graded Beam, Indian Journal of Research, 2(7) 2250-1991(2013).
- D. >L. Karabalis and D.E. Beskos , Static, dynamic and stability analysis of structures composed of tapered beams, Computers & Structures, 16(6) 731-748 (1983).
- H.M.A. Mahzuz, Performance evaluation of triangular singly reinforced concrete beam, International Journal of Structural Engineering, 2(4) 303-314 (2011).
- Moshe Eisenberger and Yoram Reich, Static, vibration and stability analysis of non-uniform beams, Computers & Structures, 31(4) 567–573 (1989).
- K. A. Lazopoulos and A. K. Lazopoulos, Bending and buckling of thin strain gradient elastic beams, European Journal of Mechanics - A/Solids, 29(5) 837-843 (2010).
- Singiresu S. Rao, The Finite Element Method in Engineering, Fifth edition, Publisher: Elsevier Science & Technology Books, ISBN: 0750678283 2010 (2010).
- M. Tahmaseb Towliat Kashani, Supun Jayasinghe and Syed M. Hashemi, On the Flexural-Torsional Vibration and Stability of Beams Subjected to Axial Load and End Moment, Shock and Vibration, 2014(153532) 1-11(2014).
- R. Patel, S. K. Dubey and K. K. Pathak, Effect of elastic properties on the behaviour of beams, International Journal of Structural Engineering, 5(1) 43-53 (2014).
- Seval Pinarbasi, Stability Analysis of Non-uniform Rectangular Beams Using Homotopy Perturbation Method, Mathematical Problems in Engineering, 2012(197483) 1-18 (2012).
- Stanislav Stoykov, Nonlinear Vibrations of 3D Beams, Fundação para a Ciências e a Tecnologia, through the scholarship SFRH/BD/35821/2007. (2012).


