
International Journal of Modern Physics and Applications, Vol. 1, No. 4, September 2015 Publish Date: Jul. 23, 2015 Pages: 175-180
No-Reference Quality Assessment Using the Entropy of First Derivative of Blurred Images in HSV Color Space
Ahmed Majeed Hameed*, Moaz H. Ali
Al-Safwa University College, Department of Computer Technics, Karbala, Iraq
Abstract
Quality assessment of No-Reference (NR) images is the process of finding a novel metric via comparable results with the results of Full-Reference (FR) metrics. Otherwise, it is the process of finding a computational model that can predict the human perceptual system. This research paper focused on the process of NR images quality assessment using the Entropy of First Derivative (EFD). Four color images are used as a sample in the Hue-Saturation-Value (HSV) system. The images were distorting manually with Gaussian blur, and the quality of distorted images was measured using the Normalize Mean Square Error (NMSE) as a FR metric. Then the EFD metric was used to assess the quality of distorted images. The results are compared with the results of the FR to find the efficiency of the NR metric. Therefore, it can contribute that EFD metric could be used in image quality assessment, and the HSV color space is an appropriate color space for this NR metric.
Keywords
Blurring, EFD, No Reference, HSV, Gaussian Blurring, Quality Assessment, IQA, Blurred Images
Received: June 27, 2015
Accepted: July 10, 2015
Published online: July 23, 2015
@ 2015 The Authors. Published by American Institute of Science. This Open Access article is under the CC BY-NC license. http://creativecommons.org/licenses/by-nc/4.0/
1. Introduction
Image quality assessment plays an important role in image and video processing and computer vision applications. Measuring the perceptual quality of images has been developed by many approaches. The previous works of objective image quality assessment IQA can be classified into two category content based and distortion based. Algorithms are aiming to find the inherent property of images are known as content based, for instance, Ke [1] was design high-level semantic features to classify between high-quality professional photos and low-quality snapshots. Also, Li and Chen [2] were studied the aesthetic visual quality of paintings. These images are usually considered as noise free. On the other hand, degradation based approaches are focused on the degradation that arise from different distortion sources. Generally, there are three types of degradation based algorithms IQA based on the availability of referenced image, full-referenced FR, reduced- reference RR, and no-referenced NR approaches [3]. FR [4-8] and RR [3,9,10] are widely developed with some well-established methods which interconnected well with human perception of quality. However, NR-IQA methods are still considerable field for improvement. This research paper is focused on the assessment of NR-IQA of distorted images. NR-IQA methods are aimed to estimate the quality of distorted images without the knowledge of the referenced image with respect to human perception. These methods assumed the type of distortion [11-15] such as, Wang [11] was introduced block-ness measures for JPEG compressed images. Gastaldo and Zunino [12] were used neural networks to learn a mapping from the feature space to quality scores for JPEG compressed images; Brandão and Queluz [13] were evaluated noise in block-based discrete cosine transform (DCT) domain arising from JPEG or MPEG encoding based on natural scene statistics (NSS) of the DCT coefficients. Furthermore, Marziliano [14] was introduced blur and ringing measures for JPEG2k compressed images, and Sheikh [15] was developed an NSS-based approach for JPEG2k compressed images. Every NR-IQA approach has to work with specific distortion source, and it is efficiency depends on many factors, one of these factors is the color space of distorted images which affect the assessment process. There are many methods and algorithms that used in NR-IQA, one of these algorithms is the entropy of first derivative EFD. The EFD has an advantage that it depends on lightness, where lightness components are affected greatly with distortion than other components. A future work can be made by applying the EFD metric on images distorted by noise or any type of distortion. Also, it is possible to choose another color space for working on which may be better than HSV in image quality assessment.
2. HSV Color Space
Three components in HSV color model are hue (H), saturation (S) and value (V). Hue is an attribute associated with the dominant wavelength in a mixture of light waves [16]. Figure 1 clarifies the HSV color space.
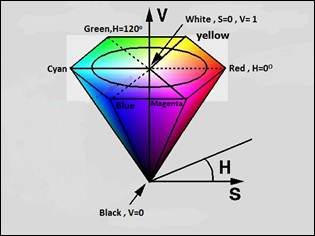
Figure 1. HSV color space [17].
The transformation from RGB color space to HSV color space is given by Eq. 1, 2, 3 [18]:
![]() (1)
(1)
![]() (2)
(2)
 (3)
(3)
Where![]() and
and![]() . All three components V, S, and H are in the range (0, 1).
. All three components V, S, and H are in the range (0, 1).
3. Blurring Distortion
Blurring is un-sharp image which is generated from a variety of sources such as an atmospheric scatter, lens defocus, optical aberration, spatial, and temporal sensor integration [19]. In digital image there are three common types of Blur effect. Firstly, average blurs. Secondly, Gaussian blur, and thirdly, motion Blur [20]. The Gaussian blur is a type of image blurring filter that uses a Gaussian function -which also expresses the normal distribution in statistics- for calculating the transformation to apply to each pixel in the image [21-22]. The equation of a Gaussian function in one dimension which is an Eq. 4. However, the two dimensions form as a function of the position x, y is given by:
![]() (4)
(4)
Where x is the distance from the origin in the horizontal axis, y is the distance from the origin in the vertical axis, and s is the standard deviation of the Gaussian distribution. It is applied in two dimensions so this formula produces a surface whose contours is concentric circles with a Gaussian distribution from the center point. The result values from this distribution are used to build a convolution matrix, which is applied to the original image. Each pixel's new value is set to a weighted average of that pixel's neighborhood. The original pixel's value receives the heaviest weight, which is having the highest Gaussian value and neighboring pixels receive smaller weights as their distance to the original pixel increases. The results in a blur that preserves boundaries and edges better than other, more uniform blurring filters. The blurring image is given by Eq. 5 [23].
![]() (5)
(5)
Where ![]() is the original image,
is the original image, ![]() is the Gaussian function,
is the Gaussian function, ![]() is the resulted blur image.
is the resulted blur image.
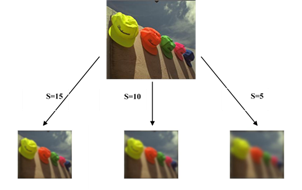
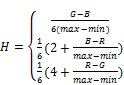
Figure 2. Original image is degraded with Gaussian blurring at different values of sigma (S).
Figure 2 shows the effect on Gaussian blurring of (hat) image with different values of Gaussian blurring factor Sigma.
4. Reference Quality Measurement
There are many referenced metrics that used in IQA, the Normalize Mean Square Error is one of these metrics.
Mean and Normalize Mean Square Error (MSE & NMSE)
MSE is computed by averaging the squared intensity of the original (input) image and the resultant (output) image pixels as in Eq. 6 [24]:
![]() (6)
(6)
Where e (m, n) is the error difference between the original and the distorted images. For lightness component as shown in Eq. 7.
![]() (7)
(7)
And the Normalization Mean Squared Error is defined as shown in Eq. 8.
![]() (8)
(8)
The Normalized mean squared error for hue is given as shown in Eq. 9.
![]() (9)
(9)
For saturation
![]() (10)
(10)
For value
![]() (11)
(11)
5. No Reference IQM
No reference image quality measurement refers to the problem of predicting the visual quality of the image without any reference to an original optimal quality image. This assessment is the most difficult problem in the field of image objective analysis [25] since many unquantifiable factors play a role in human perceptions of quality, such as aesthetics, cognitive relevance, learning, context [26]. No reference image quality is useful for many still image applications as assessment equality of high-resolution image, JPGE image compressed [27]. This objective method can measure image equality that is depending on verity of lightness and contrast.
The Entropy of the First Derivative (EFD) of Image
This method depends on the first derivative of an image, as shown in Eq. 12 [28]:
![]() (12)
(12)
Where ![]() is an image and
is an image and ![]() is the first derivative of
is the first derivative of ![]() .
.
The entropy of the first derivative is defined as follow in Eq. 13 [28]:
![]() (13)
(13)
Where ![]() is a discrete random variable with possible outcomes x1, x2,...xl,
is a discrete random variable with possible outcomes x1, x2,...xl, ![]() is the probability of the outcome
is the probability of the outcome![]() . The outcome is understood as a gray level in the lightness image and its probability is calculated by Eq. 14 [28]:
. The outcome is understood as a gray level in the lightness image and its probability is calculated by Eq. 14 [28]:
![]() (14)
(14)
Where ![]() is the total number of possible lightness in the image,
is the total number of possible lightness in the image, ![]() is the total number of pixels, and
is the total number of pixels, and ![]() is the number of pixels that have lightness level
is the number of pixels that have lightness level![]() . The higher entropy value denotes a better contrast in the image.
. The higher entropy value denotes a better contrast in the image.
6. Results
The detailed results of our approach are presented in Fig. 3, 4 and 5. Figure 3 shows the image samples were used in this approach. These images were converted from the red, green, blue (RGB) color space into the HSV color space. The images were distorted with Gaussian blurring with Sigma from 3 to 15. By using the EFD metric, it is found the results of this metric as shown in Fig. 4. After that, the NMSE was used as a FR metric to measure the quality of distorted images. Figure 5 shows the comparison between the results of the EFD and the NMSE for the distorted images. Finally, it is found that the correlation coefficients between EFD and NMSE as in the Table 1 for the four images and the average correlation coefficient of these images.
7. Discussion
The above Figs and Table are given as a full-imagination about quality, distortion, and the assessment process. In Fig. 4 we note that the quality measured by the NR metric is inversely proportional with sigma, where sigma is also inversely proportional with distortion that images have high distortion at low sigma and low distortion with high sigma. As a result, the quality has a direct proportional with distortion. The comparison in Fig. 5 shows that the behavior of the NR metric is almost much the FR metric. Also, the correlation coefficients in Table 1 is shown on that the EFD metric has succeeded to measure image quality of distorted images.
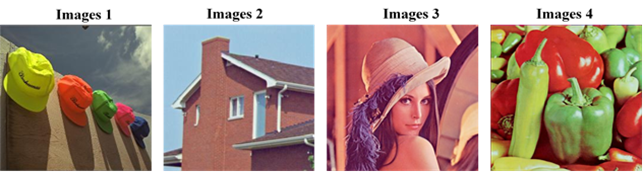
Figure 3. Images used in this research.
Table 1. The correlation coefficients between the reference metric (NMSE) and the no reference metrics (EFD) in (HSV) color space for the four images and the average correlation coefficient.
| Image 1 | Image 2 | Image 3 | Image 4 | Average Cor. | |
| Correlation coefficients | 0.9383 | 0.8983 | 0.9887 | 0.9230 | 0.9372 |
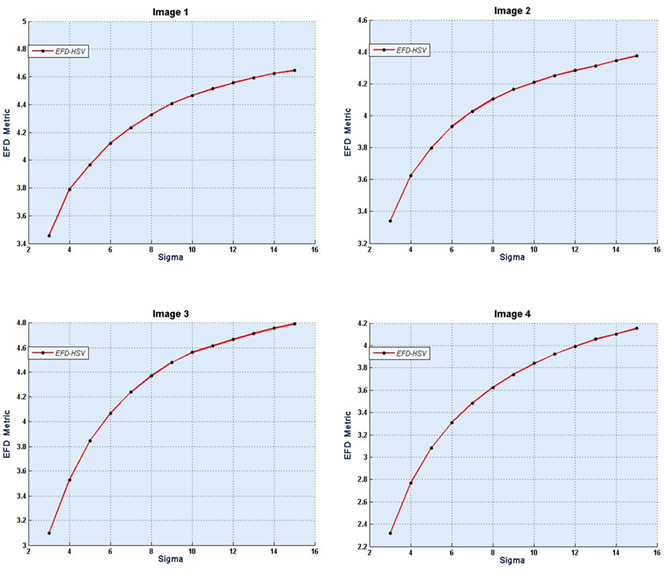
Figure 4. The EFD metric as a function of sigma for image 1, 2, 3 and 4 in HSV color space.
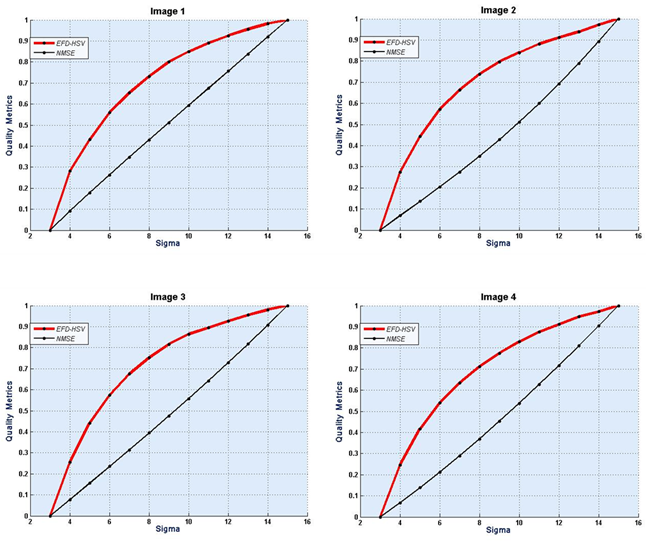
Figure 5. A comparison between EFD and NMSE results, for images 1, 2, 3, and 4 in HSV color space.
8. Conclusions
From the obtained results, the following conclusions could be drawn:
• Quality of images is increasing directly with the increasing of sigma.
• In EFD metric the quality is increasing directly with the increasing of sigma.
• EFD metric has succeeded to measure image quality.
• HSV color space is good for image quality assessment using the EFD metric.
Acknowledgment
The authors would like to acknowledge the support given by cooperation between the College Al-Safwa University and University of Kerbala in carrying out this research.
References
- Y. Ke, X. Tang, and F. Jing, "The design of high-level features for photo quality assessment", in Proc. IEEEConf. Comput. Vis. Pattern Recog., 2006, vol. 1, pp. 419–426.
- C. Li and T. Chen, "Aesthetic visual quality assessment of paintings", IEEE J. Sel. Topics Signal Process, vol. 3, no.2, pp. 236–252, Apr. 2009.
- Z. Wang and A. C. Bovik, "Modern Image Quality Assessment", San Rafael, CA: Morgan & Claypool, 2006.
- Z. Wang, A. C. Bovik, H. R. Sheikh, and E. P. Simoncelli, "Image quality assessment: From error visibility to structural similarity", IEEE Trans. Image Process., vol. 13, no. 4, pp. 600–612, Apr. 2004.
- H. R. Sheikh, A. C. Bovik, and G. de Veciana, "An information fidelity criterion for image quality assessment using natural scene statistics", IEEE Trans. Image Process., vol. 14, no. 12, pp. 2117–2128, Dec. 2005.
- H. R. Sheikh, M. F. Sabir, and A. C. Bovik, "A statistical evaluation of recent full reference image quality assessment algorithms", IEEE Trans. Image Process, vol. 15, no. 11, pp. 3440–3451, Nov. 2006.
- H. R. Sheikh and A. C. Bovik, "Image information and visual quality", IEEE Trans. Image Process., vol. 15, no. 2, pp. 430–444, Feb. 2006.
- C. Li and A. C. Bovik, "Content-partitioned structural similarity index for image quality assessment", Signal Process. Image Commun., vol. 25, no. 7, pp. 517–526, Aug. 2010.
- X. Gao,W. Lu, D. Tao, and X. Li, "Image quality assessment based on multiscale geometric analysis", IEEE Trans. Image Process., vol. 18, no. 7, pp. 1409–1423, Jul. 2009.
- D. Tao, X. Li, W. Lu, and X. Gao, "Reduced-reference IQA in contourlet domain", IEEE Trans. Syst., Man, Cybern. B, Cybern., vol. 39, no. 6, pp. 1623–1627, Dec. 2009.
- Z. Wang, H. R. Sheikh, and A. C. Bovik, "No-reference perceptual quality assessment of JPEG compressed images", in Proc. IEEE Int. Conf. Image Process., Rochester, NY, Sep. 2002, vol. 1, pp. I-477–I-480.
- P. Gastaldo and R. Zunino, "Neural networks for the no-reference assessment of perceived quality", J. Electron. Image, vol. 14, no. 3, p. 033004, Aug. 2005.
- T. Brandão and M. P. Queluz, "No-reference image quality assessment based on DCT domain statistics", Signal Process, vol. 88, no. 4, pp. 822–833, Apr. 2008.
- P. Marziliano, F. Dufaux, S. Winkler, and T. Ebrahimi, "Perceptual blur and ringing metrics: Application to JPEG2000", Signal Process. Image Commun., vol. 19, no. 2, pp. 163–172, Feb. 2004.
- H. R. Sheikh, A. C. Bovik, and L. Cormack, "No-reference quality assessment using natural scene statistics: JPEG2000", IEEE Trans. Image Process., vol. 14, no. 11, pp. 1918–1927, Nov. 2005.
- Haim Levkowitz, "Color theory and modeling for computer graphics, visualization, and multimedia applications", Kluwer Academic Publishers, 1997.
- Bourne, "Fundamentals of Digital Imaging in Medicine", Springer, 2010.
- Marc Ebner, "Color Constancy", John Wiley & Sons, 2007.
- A. M. Eskicioglu and P. S. Fisher, "Image quality measures and their performance", IEEE Trans. Communication, vol. 43, pp. 2959–2965, Dec. 1995.
- Z. Wang and A. C. Bovik, "A universal image quality index", IEEE Signal Processing Letters, vol. 9, pp. 81–84, Mar. 2002.
- Z. Wang, P. Simoncelli, "Local Phase Coherence and the Perception of Blur in: Adv. Neural Information Processing Systems", pp. 786-792. 2003
- D. J. Jabson, Z. Rahman, G. A. Woodell, "Retinex processing for automatic image enhancement", Journal of Electronic Imaging, Vol. 13(1), PP.100–110, January 2004.
- 1.Rafael C. Gonzales, Richard E. Woods, "Digital Image Processing", second edition, Prentice Hall, 2002.
- Yusra A. Y. Al-Najjar, Dr. Der Chen Soong, "Comparison of Image Quality Assessment: PSNR, HVS, SSIM, UIQI", International Journal of Scientific & Engineering Research, Volume 3, Issue 8, August-2012 1 ISSN 2229-5518.
- Z. Wang, and A. C. Bovik, "Why is Image Quality Assessment So Difficult?", IEEE ICASSP, 02 International Conference on Acoustics, Speech and Signal Processing, Orlando, Florida, USA, pp. 3313-3316, 2002.
- Y. Horita, T. Miyata, P. I. Gunawan, T. Murai, and M. Ghanbari, "Evaluation Model Considering Static-temporal Quality Degradation and Human Memory for SSCQE Video Quality", in Proc. SPIE, Lugano, Switzerland, PP. 1601-1611, 2003.
- X. Li, "Blind image quality assessment in Image Processing Proceedings", International Conference on, vol. 1, pp. I–449, 2002
- T. T. Nguyen, X. D. Pham, D. Kim and J. W. Jeon, "Automatic Exposure Compensation for Line Detection Applications", IEEE International Conference on Multisensor Fusion and Integration for Intelligent Systems Seoul, Korea, 2008.


