International Journal of Modern Physics and Applications, Vol. 1, No. 4, September 2015 Publish Date: Jul. 20, 2015 Pages: 145-151
Analysis of Molecular Dynamic Simulations Using Wavelet-Based Techniques
A. Abdel-Hafiez*
Experimental nuclear physics Department, Nuclear research center, AEA, Cairo, Egypt
Abstract
In this paper, I focus on describe, calculate and analyze of molecular dynamic(MD) simulations using wavelet transform (WT) techniques by analogy with its use in signal and image processing, so that I would like to talk about the theoretical background wavelet transform methods, including what properties they have, their common types, and how to operate them. Secondly, I would introduce the continuous wavelet transform, which is especially well-suited for time course data such as molecular dynamics simulations, the WT permits filtering out the high-frequency noise without completely omitting the high-frequency phenomena whose contribution is crucial in cases where the dynamics is localized in frequency and time. Medical applications could be studied in which biomedical related research requires lots of mathematical and engineering techniques to analyze data. The WT is observed to excel in reconstructing the original signal by a subset of the basis used in the analysis and in identifying the occurrence of rare phenomena by examining the wavelet energies at high-resolution levels.
Keywords
Molecular Dynamics, Wavelet Techniques, Some Applications
Received: June 10, 2015
Accepted: June 20, 2015
Published online: July 16, 2015
@ 2015 The Authors. Published by American Institute of Science. This Open Access article is under the CC BY-NC license. http://creativecommons.org/licenses/by-nc/4.0/
1. Introduction
Great progress has been made in applying linear time-invariant techniques in signal processing. In such cases the deterministic part of the signal is assumed to be composed of complex exponentials, the solutions to linear time invariant differential equations. However, many biomedical signals do not meet these assumptions. Thus, the emerging techniques of time-frequency analysis can provide new insights into the nature of biological signals [1-5].
There are several different time frequency analysis methods such as short time Fourier transform, S transform, Wigner transform, Cohen’s distribution and wavelet transforms [6-9]. I would use and focus on wavelet transform since it is used in biomedical signals analysis more commonly than others what it mean it is so sensitive and accurate.
Molecular dynamics (MD) has become a common method for studying the motion of proteins over time, and it is the only available technique for examining continuous fine granularity motion at atomic resolution [10-12]. By numerically integrating Newton’s equations of motion, one can produce a series of snapshots of a protein’s trajectory through time. These snapshots, when saved at sufficiently high resolution, serve as stop-motion photography and provide a great deal of information about how proteins behave.
In this paper, we focus on the analysis of MD simulations using wavelet-based techniques. It is worth noting, however, that any molecular system that evolves over time can be analyzed with these same wavelet techniques. Nrownian dynamics simulations and elastic networks are two examples of systems whose data have a similar structure to MD systems and which could benefit from wavelet analysis as well [13-15].
2. Theory
To extract information from signals and reveal the underlying dynamics that corresponds to the signals, proper signal processing technique is needed. Typically, the process of signal processing transforms a time domain signal into another domain since the characteristic information embedded within the time domain is not readily observable in its original form. Mathematically, this can be achieved by representing the time domain signal as a series of coefficients, based on a comparison between the signal x(t) and template functions {n(t)} [16, 17].
![]()
The inner product between the two functions x(t) and n(t) is
![]()
The inner product describes an operation of comparing the similarity between the signal and the template function, i.e. the degree of closeness between the two functions. This is realized by observing the similarities between the wavelet transform and other commonly used techniques, in terms of the choice of the template functions. A non stationary signal is shown in Figure 1 as an example. The signal consists of four groups of impulsive signal trains. In these groups, the signals are composed of two major frequencies, 650 and 1500 Hz.
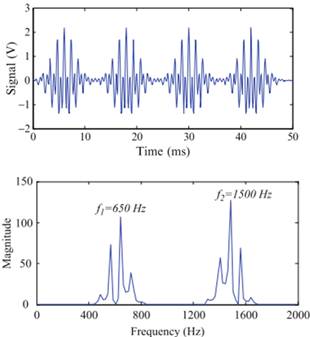
Fig. 1. An example for a non stationary signal. The signal consists of four groups of impulsive signal trains.
Using the notation of inner product, the Fourier transform of a signal can be expressed as
![]()
Assuming that the signal has finite energy
![]()
Short time Fourier transformation (STFT) can be expressed as
![]()
According to the uncertainty principle, the time and frequency resolutions of the STFT technique cannot be chosen arbitrarily at the same time [18].
![]()
![]()
Wavelet transform can be expressed as
![]()
The definition of continuous wavelet transform
![]()
where a shifts time, b modulates the width (not frequency), and (t) is mother wavelt.
It has superposition property. If the continuous wavelet transform of x(t) is X (s,![]() ) and of y(t) is Y(s,
) and of y(t) is Y(s,![]() ), then the continuous wavelet transform of z(t) = k1x(t) + k2y(t) can be expressed as
), then the continuous wavelet transform of z(t) = k1x(t) + k2y(t) can be expressed as
![]()
Suppose that the continuous wavelet transform of x(t) is X (s, ![]() ), then the transform of x(t-t0) is
), then the transform of x(t-t0) is ![]() suppose that the continuous wavelet transform of x(t) is X (s,
suppose that the continuous wavelet transform of x(t) is X (s, ![]() ), then the continuous wavelet transform of x(t/a) can be expressed as
), then the continuous wavelet transform of x(t/a) can be expressed as
![]()
This indicates that, when a signal is dilated by a, its corresponding wavelet coefficients are also dilated by a along the scale and time axes.
3. Results and Discussion
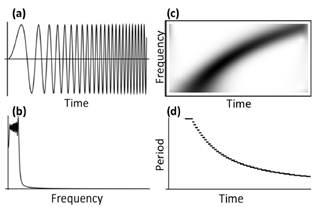
Fig. 2. Comparison of Fourier transform and the continuous wavelet transform. (a) A signal whose frequency increases over time. (b) The absolute value of the Fourier transform of the signal in a. (c) The continuous wavelet transform of the signal in a. (d) Plot of the significant period over time of the signal in (a), calculated by taking the most significant wavelet wavelength from (c).
The Fourier transform, wavelets give information about the frequency domain of a signal, but, unlike the Fourier transform, which gives only average information about each frequency, wavelets give instantaneous information about how a particular frequency is localized in time. Consequently, one can obtain considerable information about the modes of a particular signal without losing information about when these modes occur or how variable they are (Fig. 2). The wavelet transform shows clearly that the signal is increasing in frequency over time while the Fourier transform shows only that low frequencies are dominant. Figure 3 shows three types of wavelet transforms which are used in analyzing the signals.
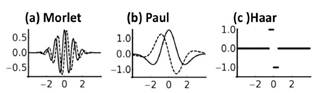
Fig. 3. Plots of the three wavelets used in this study, each plotted from −4 to 4 with scale s = 1. Solid lines represent the real parts while dashed lines represent the imaginary parts. (a) The Morlet wavelet. (b) The Paul wavelet. (c) The Haar wavelet.
3.1. Electrocardiography (ECG)
Electrocardiography (ECG) is a transthoracic interpretation of the electrical activity of the heart over a period of time, as detected by electrodes attached to the outer surface of the skin and recorded by a device external to the body. In short, electrocardiogram is a test that records the electrical activity of the heart. ECG has been used to measure the rate and regularity of heartbeats as well as the size and position of the chambers, the presence of any damage to the heart, and the effects of drugs or devices used to regulate the heart, as shown in Figure 4 and 5.
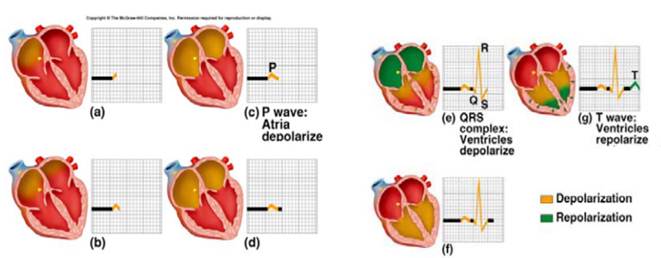
Fig. 4. Using ECG to measure the rate and regularity of heartbeats as well as the size and position of the chambers.
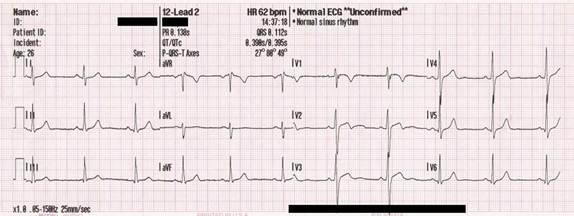
Fig. 5. Spectra of ECG in measuring the rate and regularity of heartbeats.
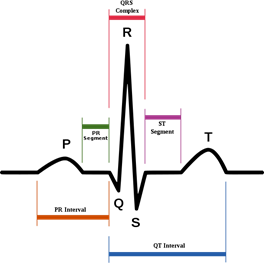
Fig. 6. Prtion of the tracing following the T wave and preceding the next P wave.
Table 1. Description the portion of the tracing following the T wave and preceding the next P wave.
| Feature | Description |
| RP interval | The interval between an R wave and the next R wave . Normal resting heart rate is between 60 and 100 bpm |
| P wave | During normal atrial depolarization, the main electrical vector is directed from the SA node towards the AV node. This turns into the P wave on the ECG. |
| PR interval | The PR interval is measured from the beginning of the P wave to the beginning of the QRS wave. The PR interval reflects the time the electrical impulse takes to travel from the sinus node through the AV node and entering the ventricles. The PR interval is therefore a good estimate of AV node function. |
| QRS wave | The QRS complex reflects the rapid depolarization of the right and left ventricles. They have a large muscle mass compared to the atria and so the QRS wave usually has a larger amplitude than the P wave. |
| T wave | The T wave represents the repolarization of the ventricles. The interval from the beginning of the QRS wave to the apex of the T wave is referred to as the absolute refractory period. The last half of the T wave is referred to refractory period . |
| ST interval | The ST interval is from the J point to the end of the T wave. |
A typical ECG tracing of the cardiac cycle consists of a P wave, a QRS wave, a T wave, and a U wave. The baseline voltage of the electrocardiogram is known as theisoelectric line. Typically the isoelectric line is measured as the portion of the tracing following the T wave and preceding the next P wave, as shown in Figure 6 and Table 1.
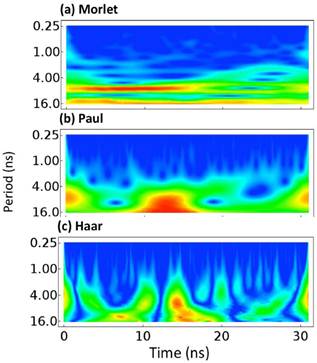
Fig. 7. Plots of the wavelet analyses of the Cα atom of R29 of the engrailed homeodomain (EnHd, PDB: 1enh). The absolute value of each wavelet coordinate is shown with low values illustrated in blue. No scale is given because wavelet values are in arbitrary units. (a) The Morlet wavelet. (b) The Paul wavelet. (c) The Haar wavelet. The scales of each are not identical as they are not directly comparable.
3.2. Edge Detection in Medical Images
One of the most important things for the medical images are image compression and image denoising which could be proceed on the following two flowcharts.
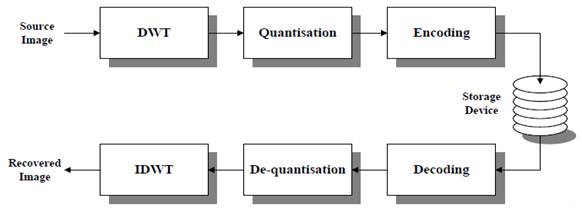
Fig. 8. Wavelet-based encoding scheme.
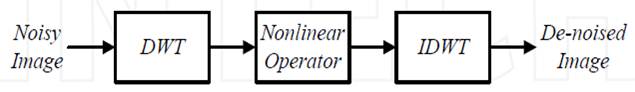
Fig. 9. Wavelet-based denoising system.
This method was developed by Stephane Mallat[19,20]. Its principle is based on finding local maxima of wavelet coefficients (Wavelet Transform Modulus Maxima Method), which represent the edges in the image. The method uses only horizontal and vertical coefficients values (Low High and High Low coefficients 1) from each level of wavelet decomposition.
Wavelet transform modulus is defined by the equation[21-23]
![]()
for each pair of horizontal and vertical coefficients
![]()
At the same position in matrices. A matrix of the gradient angles for the same pairs of coefficients is evaluated according to the equation
![]()
Points in the original image for which values of M f(u, v, 2j ) are local maxima in one-dimensional neighborhood in the direction of gradient are supposed to be edge pixels. These points are distributed according the boundary of important structures in the image. To recover edges, found individual maxima are chained.
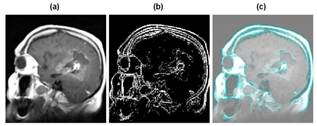
Fig. 10. Magnetic Resonance (MR) image: (a) Original image, (b) Edges found by wavelet maxima using Haar wavelet function, (c) Edges projection into the original image.
3.3. Wavelet Reconstruction
The signal decomposition into detail and approximation coefficients (here we label them as cD and cA) these decomposed signals contain fewer and fewer coefficients as we move to higher scale. The first scale detail coefficients, for example, are half in number as the original signal. This loss in resolution is a problem for localized analysis and that's where the topic of wavelet reconstruction comes in. The process of reconstruction is used to synthesize signals from detail and approximation coefficients. We could for example retrieve the original signal from a reconstruction of the same coefficients attained by the decomposition process (see Fig. 11).
Wavelet reconstruction can be used on multi-level transformed signals also to reconstruct the detail each level of the decomposition. Figure 12 is an example that shows the reconstructed detail of a signal at six different scales. Remember that the detail represents the fluctuation in the signal from the average of the signal. With each pass of the wavelet transform (moving downward in Fig. 12) we are looking at coarser fluctuations corresponding to larger scale regions of the signal. In this project we use functions that are part of the Matlab Wavelet Toolbox for both decomposition and reconstruction.
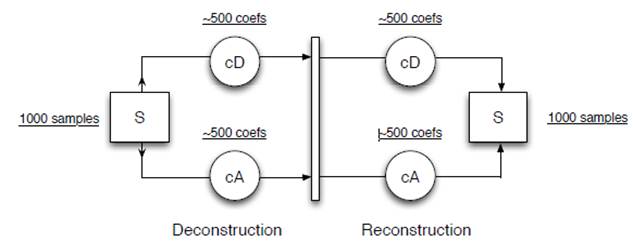
Fig. 11. Diagram of the wavelet reconstruction of the original signal from the detail (cD) and approximation (cA) coefficients.
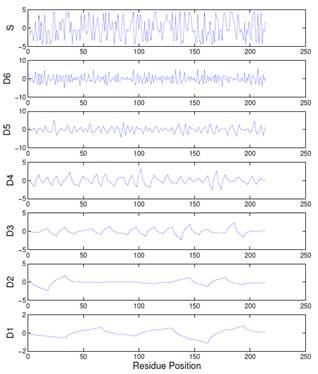
Fig. 12. The hydrophobicity signal S of a protein (top plot) and the reconstructed details at the reconstructed details at the first 6 scales.
4. Conclusion
Wavelet analysis is a powerful tool that can be used to quickly and automatically isolate distinct motions of interest in a protein simulation. Due to their ability to locate subtle changes without being overwhelmed by larger more obvious motions, wavelets represent an ideal method for screening simulations to quickly pinpoint changes or structural rearrangements and for comparing differences in simulations, due to mutation, pH, or temperature changes, for example. Additionally, wavelets can be used to scan large databases of simulations for biochemically relevant events, such as the motion of a catalytic site or of functionally relevant loops.
This work describes how the mathematical formulas come out, what properties they have, and how to select optimal wavelets for biomedical signal processing, we can gain help from the brief categories and descriptions. Electrocardiography, Edge detection in medical images and Wavelet Reconstruction as an application has been studied and explained.
References
[1] R.X. Gao, R. Yan, Wavelets: Theory and Applications for Manufacturing, Springer, 2010
[2] M. Akay et al. Time Frequency and Wavelets in Biomedical Signal Processing, Wiley-IEEE Press, 1997
[3] L. Cohen, "Time-frequency distributions-A review," Proc. IEEE, vol. 77, pp.941-981, 1989.
[4] L. Cohen, Time-Frequency Signal Analysis. Englewood Cliffs, NJ: Prentice Hall, 1995.
[5] T.C.M. Claasen and W.F.G. Mecklenbrauker, "The Wigner distribution-A tool for time-frequency signal analysis-Part I: Continuous-time signals," Philips J. Res., vol. 35, pp. 217-250, 1980.
[6] T.C.M. Claasen and W.F.G. Mecklenbrauker, "The Wigner distribution-A tool for time-frequency signal analysis-Part II: Discrete time signals," Philips J. Res., vol. 35, pp. 276-300, 1980.
[7] A. Nayak, R.J. Roy, and A. Sharma,"Time-frequency spectral representation of the EEG as an aid in the detection of depth of anesthesia," Ann. Biomed. Eng., vol. 22, pp. 501-513,1994.
[8] T. C.M. Claasen and W.F.G. Mecklenbrauker, "The Wigner distribution-A tool for time-frequency signal analysis-Part III: Relations with other time-frequency signal transformations," Philips J. Res., vol. 35, pp. 372-389, 1980.
[9] W. J. Williams and T. H. Sang, "Adaptive RID kernels which minimize time-frequency uncertainty," IEEE Int. SY111p. Time-Frequency and Time-Scale Analysis, pp. 96-99, 1994.
[10] W.J. Williams, "Time-frequency analysis of biological signals," IEEE Int. Conf. Acoust. Speech, Signal Proc., vol. I, pp. 83-~6, 1993.
[11] C.S. Zheng, W.J. Williams, and J.C. Sackellares, "RID time-frequency analysis of median filters and lowpass filters in reducing EMG artifacts in EEGrecording," Proc. IEEE Int. Con. Eng. Med. Bioi., vol. 15, pt. I, pp. 350-351,1993.
[12] Beck DAC, Jonsson AL, Schaeffer RD, Scott KA, Day R, Toofanny RD, Alonso DO, Daggett V. Dynameomics: mass annotation of protein dynamics and unfolding in water by high-throughput atomistic molecular dynamics simulations. Protein: Engineering, Design and Selection. 2008; 21:353.
[13] van der Kamp MW, Schaeffer RD, Jonsson AL, Scouras AD, Simms AM, Toofanny RD, Benson NC, Anderson PC, Merkley ED, Rysavy S, Bromley D, Beck DAC, Daggett V. Dynameomics: a comprehensive database of protein dynamics. Structure. 2010; 18(4):423. [PubMed: 20399180]
[14] Shaw, DE.; Dror, RO.; Salmon, JK.; Grossman, JP.; Mackenzie, KM.; Bank, JA.; Young, C.; Deneroff, MM.; Batson, B.; Bowers, KJ.; Chow, E.; Eastwood, MP.; Ierardi, DJ.; Klepeis, JL.; Kuskin, JS.; Larson, RH.; Lindorff-Larsen, K.; Maragakis, P.; Moraes, MA.; Piana, S.; Shan, Y.; Towles, B. Proceedings of the Conference on High Performance Computing, Networking, Storage and Analysis (SC09). New York, NY, USA: Association of Computing Machinery; 2009. Millisecond-Scale molecular dynamics simulations on Anton.
[15] Dror RO, Jensen M, Borhani DW, Shaw DE. Exploring atomic resolution physiology on a femtosecond to millisecond timescale using molecular dynamics simulations. Journal of General Physiology. 2010; 135:555. [PubMed: 20513757]
[16] Miao L, Schulton K. Probing a structural model of the nuclear pore complex channel through molecular dynamics. Biophysical Journal. 2010; 98:1658. [PubMed: 20409487]
[17] Lindahl E, Samsom MSP. Membrane proteins: molecular dynamics. Current Opinions in Structural Biology. 2008; 18:425.
[18] Day R, Daggett V. All-atom simulations of protein folding and unfolding. Advances in Protein Chemistry. 2003; 66:373. [PubMed: 14631823]
[19] Stephane Mallat. A Wavelet Tour Of Signal Processing. Academic Press, 1998.
[20] Stephane Mallat and Sifen Zhong. Characterization of signals from multiscale edges. IEEE TRANSACTION ON PATTERN ANALYSIS AND MACHINE INTELLIGENCE, 14(7):23, July 1992.
[21] Mauro Barni. Document and Image Compression. CRS Press, Taylor and Francis Group, 2006.
[22] Kehl C, Simms AM, Toofanny RD, Daggett V, Fersht A. Dynameomics: a multi-dimensional analysis-optimized database for dynamic protein data. Protein: Design, Engineering, and Selection. 2008; 21:379.
[23] Simms AM, Toofanny RD, Kehl C, Benson NC, Daggett V. Dynameomics: design of a computational lab workflow and scientific data repository for protein simulations. Protein: Design, Engineering, and Selection. 2008; 21:369.


