
International Journal of Modern Physics and Applications, Vol. 1, No. 2, May 2015 Publish Date: May 11, 2015 Pages: 27-31
Estimation of UV Index from Integrated Detector Type Measurements
A. A. Azooz1, *, N. I. B. Jallo2
1Department of Physics, College of Science, Mosul University, Mosul, Iraq
2Department of Physics, College of Science, Baghdad University, Baghdad, Iraq
Abstract
A procedure is suggested to calculate the approximate temporal value of the UV index at any geographical location using only frequency integrated UV or total solar irradiance measurements. This eliminates the need for the use of delicate and highly expensive solar UV spectrometers. The procedure introduces a new single continuous parameterization equation for the McKinlay - Diffey Erythema weighing function. Results of calculations are compared with data derived using upper atmosphere satellite UV and Ozone levels measurement for the city of Zarka in Jordon.
Keywords
UV Index, Solar Radiation, UV Solar Spectrum
Received: March 31, 2015 / Accepted: April 16, 2015 / Published online: May 8, 2015
@ 2015 The Authors. Published by American Institute of Science. This Open Access article is under the CC BY-NC license. http://creativecommons.org/licenses/by-nc/4.0/
1. Introduction
A significant part of solar energy reaching the earth surface falls in the ultra violet (UV) part of the electromagnetic spectrum. While small amounts of UV are necessary for life 1-3, elevated levels can be highly dangerous. UV is considered as a main cause of skin cancer 4-8. Providing adequate information to the general population about UV levels have become one of the main goals for any metrological institution 9, 10. The natures of solar UV spectrum, its interaction with atmospheric constituents 11-14 and with living cells 15-17 are highly complex. This makes it difficult for ordinary population to obtain meaningful health risks assessment information from direct measured values of UV intensity. Instead, a more straightforward criterion is put for this purpose. This criterion is based on the quantity called the UV index (UVI). This index represents an almost linear metric of the risk factor to human resulting from different UV intensity 9, 10. The calculation of UVI involves both effect of different wavelengths, and human susceptibility to them. It is known that exposure to shorter wavelengths causes more damage to human cells. This is usually expressed in terms of a weighing function. Several empirical forms of weighing functions are available 15-21. These are based on results of detailed studies of the effects of different UV wavelengths on living cells and DNA. As far as human skin UV hazards (Erythema action) is concerned, the most widely used weighing function is called the McKinlay – Diffey Erythema action spectrum. This spectrum has the following empirical form:
![]() for
for ![]()
![]()
![]() for
for ![]()
![]() (1)
(1)
![]() for
for ![]()
![]()
This equation is plotted as blue line in figure (1).
This function is an expression of the fact that skin susceptibility is highest and constant for UV wavelengths below 298 nm. Photons in this frequency range have energies exceeding that needed to produce cell damage and trigger cancer cells. This effect starts to reduce at wavelengths above 298 nm and almost diminishes above 330 nm.
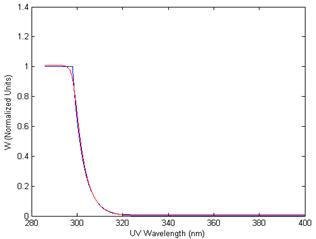
Figure (1). Comparison between equations (1) and (3).
The UV index at any given time and location is obtained through the integration of the product of the UV spectrum and the weighing function above.
![]() (2)
(2)
Where ![]() is the intensity in W/m2 nm. In cases where
is the intensity in W/m2 nm. In cases where ![]() is measured in Joul/m2.nm, the equation above is divided by a factor of 25.
is measured in Joul/m2.nm, the equation above is divided by a factor of 25.
The main problem associated with UVI calculation is the necessity for the detailed knowledge of the UV spectrum![]() . Two methods are employed for this purpose. The first involves spectral analysis of the UV at upper atmosphere in conjunction with atmospheric Ozone concentration measurements. These are usually obtained from satellite data. The second is through surface spectrometric measurements. Both methods require highly sophisticated and expensive facilities, which are only available in highly developed countries beyond the reach of less developed ones.
. Two methods are employed for this purpose. The first involves spectral analysis of the UV at upper atmosphere in conjunction with atmospheric Ozone concentration measurements. These are usually obtained from satellite data. The second is through surface spectrometric measurements. Both methods require highly sophisticated and expensive facilities, which are only available in highly developed countries beyond the reach of less developed ones.
The purpose of this work is to present an approximate method for the calculation of the UV index from integration UV detectors, or even global solar irradiance pyrometers, which are available in almost all metrological stations all over the world.
2. Modeling
As mentioned above, the two prerequisites for any UVI calculation are the Erythema action spectrum function and the solar UV spectrum function. Although equation (1) is now the most accepted form for the Erythema action spectrum calculations, this function contains two singularity points at 298 and 328 nm. It might be thus useful from computational point of view at least to attempt expressing ![]() as one continuous empirical function. For such purpose, values of
as one continuous empirical function. For such purpose, values of ![]() calculated from equations (1) are fitted to the empirical form.
calculated from equations (1) are fitted to the empirical form.
![]() (3)
(3)
(a)
(b)
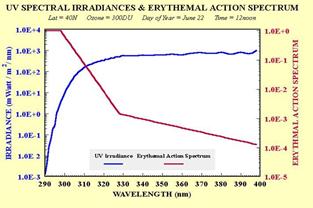
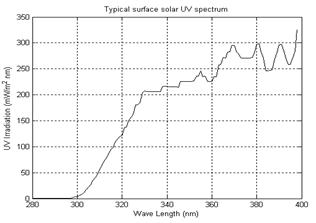
Figure (2). (a)Typical earth surface clear day solar UV spectrum ref [22], (b) plot in (a) converted numerical values.
Matlab nonlinear fitting facility is used to obtain a convergent six free parameters fit with over 95% confidence level with fitting parameters values ![]() . The result is shown as red line in figure (1). In the absence of direct spectral measurements of the surface UV, it becomes necessary to try to infer on this spectrum from the wavelength integrated total UV meters measurements. The main assumption here is that although the overall UV is temporal and spatial dependent, its detailed spectral structure can be considered as constant to a first approximation. This assumption can be justified if one neglects short-term variations in atmospheric Ozone and other constituents. Considering any typical clear day UV spectrum may serve first approximation calculations. Such typical UV spectrum published by NOAA shown in figure (2-a) is used in the following calculation. Figure (2-a) shows the original logarithmic scale UV spectrum 22. The reference only gives the information shown on the figure. No further information regarding year and specific location are available.Figure (2-b) shows plot of numerical data extracted from figure (2-a) using some special image processing technique 23. The data in figure (2-b) include only integer wavelength values between 280 and 400 nm plotted on a linear scale. The use of such integer values of wavelength is related to the numerical nature of the following integration process.
. The result is shown as red line in figure (1). In the absence of direct spectral measurements of the surface UV, it becomes necessary to try to infer on this spectrum from the wavelength integrated total UV meters measurements. The main assumption here is that although the overall UV is temporal and spatial dependent, its detailed spectral structure can be considered as constant to a first approximation. This assumption can be justified if one neglects short-term variations in atmospheric Ozone and other constituents. Considering any typical clear day UV spectrum may serve first approximation calculations. Such typical UV spectrum published by NOAA shown in figure (2-a) is used in the following calculation. Figure (2-a) shows the original logarithmic scale UV spectrum 22. The reference only gives the information shown on the figure. No further information regarding year and specific location are available.Figure (2-b) shows plot of numerical data extracted from figure (2-a) using some special image processing technique 23. The data in figure (2-b) include only integer wavelength values between 280 and 400 nm plotted on a linear scale. The use of such integer values of wavelength is related to the numerical nature of the following integration process.
Before being able to make any use of the spectrum in figure (2-b) for UVI calculations, a few points related to total UV measuring instruments must be mentioned. The first is that the readout of these instruments represents the integration of the product of the instrument convolution function and the solar UV radiation spectrum. The instrument function ![]() is usually bell shaped which can be usually described by a Gaussian function of the form
is usually bell shaped which can be usually described by a Gaussian function of the form
![]() (4)
(4)
![]() is the wavelength at which the detector has a maximum response of unity.
is the wavelength at which the detector has a maximum response of unity.
The relation between unit detector reading and the frequency spectrum in figure (2-b), can be constructed based on the fact that if the detector reading of one unit represents measurement of UV spectrum ![]() similar to that in figure (2-a) but normalized to a unit area under the curve.
similar to that in figure (2-a) but normalized to a unit area under the curve.
 (5)
(5)
The unit detector reading can thus be written as
![]() (6)
(6)
To a first approximation one assume that any increase or decrease of the detector reading is a result of linear changes in UV levels at all wavelengths. The approximate UV spectrum associated with any particular detector reading will be the value of the reading divided by ![]() in figure (2-b) at which the detector has maximum sensitivity of unity. At a detector reading
in figure (2-b) at which the detector has maximum sensitivity of unity. At a detector reading ![]() W/m2, the approximate UV spectrum can be written as
W/m2, the approximate UV spectrum can be written as
![]() (7)
(7)
The approximated UV index can be calculated using
![]() (8)
(8)
3. Experimental Data and Results
(a)
(b)
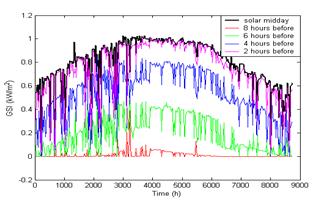
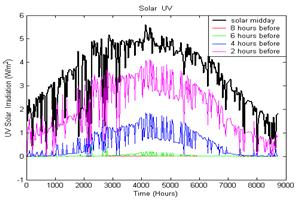
Figure (3). Variation of solar (a) GSI, and (b) UVB, at different parts of the day at Zarka Jordon during the year 2002.
A series of hour by hour temperature, global solar irradiation (GSI) and UVB measurements are carried out over the entire 2002 starting at 1-Jan-02 00:41:15 and ending 31-Dec-02 23:59:28 at the Hashemite University in Zarka Jordon automatic weather station. Only two short period system failures took place over the entire period. The first was during 9-Jun-02 23:41:15 and 11-Jun-02 00:34:40. The second was 9-Oct-02 23:34:40 and 15-Oct-02 00:59:28. A calibrated UV B-889 ultra violet solid state detector type and a pyrometer detector type are used to measure the UV and GSI measurements respectively. The UV detector has an almost Gaussian type wavelength response with maximum sensitivity at ![]() nm, and full width at half maximum
nm, and full width at half maximum ![]() nm. The detector is equipped with cosine angle diffusion system and filters for UVB region maximum sensitivity. The global solar radiation sensor is a pyrometer type and has spectral response in the range of 0.3-3 micrometers. All sensors are directly linked to digitized data logging device.
nm. The detector is equipped with cosine angle diffusion system and filters for UVB region maximum sensitivity. The global solar radiation sensor is a pyrometer type and has spectral response in the range of 0.3-3 micrometers. All sensors are directly linked to digitized data logging device.
Figure (3) shows the results of measurements of GSI for the eight hours period prior to mid solar day and until mid solar day in two hours step size over the entire year 2002.
The midday UVB data in figure (3-b) are used to calculate the approximate UV index using the procedure described above. The calculations are performed using matlab software specially built for this purpose. The inputs to the software are the detector wavelength response data at each integer nanometre values of wavelength between 280-400 nm, and the UV detector reading in W/m2
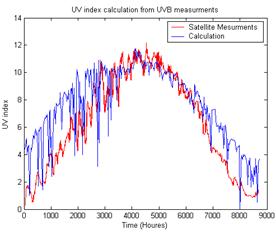
Figure (4). Comparison between calculated UVI (blue) and satellite measurements (red) at Zarka Jordon 2002.
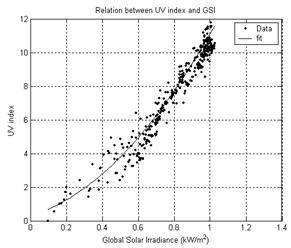
Figure (5). Correlation between UVI and GSI.
Results UV index calculations using the described method are shown in blue color on figure (4). These results are compared to satellite data (red) kindly made available by Professor Jos van Geffen of the Royal Netherlands Meteorological Institute, Climate Research and Seismology Department Section of Atmospheric Composition, for the nearby geographical location of Mafrak for the same period of time. The figure indicates a good agreement between the two sets of data during summer in particular. This is important because it is during this period, the UV index can reach the dangerous levels. The results of calculations tend to show somewhat higher values compared to satellite data for lower UV irradiations levels.
Because of the strong correlation between UV and GSI irradiation levels, it may be useful to attempt to obtain an empirical direct relation between the UV index and GSI. For this purpose, the calculated UVI values of figure (4) are plotted against the corresponding measurements of GSI in figure (5). The data are fitted with over 95% confidence level to the quadratic equation
![]() (9)
(9)
This equation can provide a useful tool for approximate estimation of the UV index in situation where only total solar irradiation data are available without the need for the more expensive UV meters.
Results of calculations of UVI by direct substitution of the pyrometer measured midday GSI values into equation (9) are presented in figure (6) (black) and compared with satellite data (red). It is again clear that good agreement at the important range of UV index values for summer period is obtained.
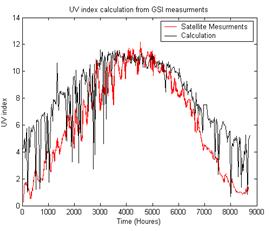
Figure (6). Comparison between UVI values calculated using equation (9), (black) and satellite measurements (red) at Zarka Jordon 2002.
4. Conclusions
A simple method is suggested to calculate the UV index from wavelength integrated UV detector measurements or even from pyrometer type global solar irradiance measurements. The application of this method on 2002 data obtained from Zarka University Jordon metrological station produced UV index values, which are in good agreement with those obtained using more sophisticated satellite measurements for summer months. These months are particularly important as far as UV protection is concerned. The proposed empirical equation can provide a reasonable way for estimating UVI from global solar irradiance data.
References
- D.Brune, R. Hellborg, R.Bertil, R. Persson, R. Pääkkönen "Radiation at Home, Outdoors and in the Workplace" ScandinavianScience Publisher Oslo (2001).
- R. H. Douqlas, J. Moan, F. Dall'Acqua. "LIGHT IN BIOLOGY AND MEDICINE Volume I" Plenum Press, New York (1988).
- E. A. Cicarma, A. C. Porojnicu, Z. Lagunova, A. Dahlback, A. Juzeniene, J. MOAN. ANTICANCER RESEARCH 29: 3495-3500 (2009).
- WORLD HEALTH ORGANIZATION International Agency for Research on Cancer IARC Working Group ReportsVolume 1 "EXPOSURE TO ARTIFICIAL UV RADIATIONAND SKIN CANCER" (2005)http://www.iarc.fr/en/publications/pdfs-online/wrk/wrk1/ArtificialUVRad&SkinCancer.pdf.
- United States Air and Radiation EPA 430-F-06-013 Environmental Protection (6205J) September (2006)http://www.epa.gov/sunwise/doc/sunscreen.pdf.
- D. E. Brash, J. A. Rudolph, J. A. Simon, A. Lin,G. J. Mckenna, H P. Badent, A. J. Halperin, J. Pontin. Proc. Nati. Acad. Sci. USAVol. 88, pp. 10124-10128, (1991).
- H. Soehnge, A. Ouhtit, H. N. Ananthaswamy. Frontiers in Bioscience 2, d538-551, November 1, (1997).
- F. R. De Grulil, J. C. Van Derleun J. theor. Biol. 83,487-504 (1980).
- United states Environmental Protection Agency "A guide to U Vindex"http://www.arpa.emr.it/cms3/documenti/uv/EPA_guide.pdf.
- A joint recommendation of: World Health Organization, World Meteorological Organization, United Nations Environment Programme, International Commission on Non-Ionizing Radiation Protection. "G L O B A L S O L A R U V I N D E X, a practical Guide" (2002)http://www.who.int/uv/publications/en/UVIclip.pdf.
- P. Jovanovi´c and D. Djurovi Serb. Astron. J. No. 162, 51 – 56 (2000).
- M. H. Rees "Physics and Chemistry of Upper atmosphere" Cambridge University Press (1989).
- United States Department of Agriculture, "Atmospheric and Biospheric Interactions of Gases and Energy in the Pacific Region Pacific southwest of the United States, Mexico, and Brazil. General Technical Report PSW-GTR-161 (1997).
- J. G. Estupinan, S. Raman, G. H. Grescenti, J. J. Streicher, W. F. Barnard. Journal of Geophysical Research Vol. 1 No. D11 (1996).
- J.n König, K. Zarnack, N. M. Luscombe, J. Ule. NATURE REVIEWS | GENETICS Vol 13 (2012).
- J. Lippincott-Schwartz, E. Snapp, A. Kenworthy. © 2001 Macmillan Magazines Ltd NATURE REVIEWS MOLECULAR CELL BIOLOGY Vol. 2 (2001).
- Martijn S. Luijsterburg , Joachim Goedhart , Jill Moser ,H. Kool, B.t Geverts, A. B. Houtsmuller, L. H. F. Mullenders, W. Vermeulen, R. van Driel.J Cell Sci. 120: 2706-16 (2007)https://openaccess.leidenuniv.nl/bitstream/handle/1887/15929/06.pdf?se
- N. V. K. Prasad, K. Niranjan, N. Madhavi. International Journal of Physical Sciences Vol.5 No.1 (2010)
- B. L. Diffey. Photochemistry and Photobiology Vol. 46 No. 1 (1987)http://onlinelibrary.wiley.com/doi/10.1111/j.1751-1097.1987.tb04735.x/abstract.
- A. Altheide, H. J. Altheide, M. Knalmann, H. Tronnier. . Photochemistry and Photobiology Vol. 6 No.2 (1996)http://www.ncbi.nlm.nih.gov/pubmed/7899509.
- F. R. de Gruill, H. J. Sterenborg, P. D. Forbes, R. E. Davies, C. Cole, G. Kelfkens, H. van Weelden, A. Anders, H. J. Altheide, M. Knqlmann,H. Tronnier. Cancer Research Vol. 1No. 53 (1993)]http://www.ncbi.nlm.nih.gov/pubmed/841.
- http://www.cpc.ncep.noaa.gov/products/stratosphere/uv_index/gif_files/spectrum.gif.
- A. Azooz, Instruments and Experimental Techniques, Vol. 54, No. 3, (2011).


