
Journal of Nanoscience and Nanoengineering, Vol. 1, No. 3, October 2015 Publish Date: Aug. 27, 2015 Pages: 148-161
Adsorption of Dyes from Simulated Textile Wastewater onto Modified Nanozeolite from Coal Fly Ash
Patricia Cunico1, *, Anu Kumar2, Denise A. Fungaro1
1Chemical and Environmental Center, Nuclear and Energy Research Institute, São Paulo, Brazil
2Land and Water, Commonwealth Scientific Industrial Research Organization, Glen Osmond, S. A. Australia
Abstract
Nanozeolite synthesized from fly ash and modified with hexadecyltrimethylamonium (HDTMA) was used as adsorbent to remove dyes - Solophenyl Navy (SN) and Solophenyl Turquoise (ST) and their hydrolysed forms Solophenyl Navy Hydrolysed (SNH) and Solophenyl Turquoise Hydrolysed (STH), respectively from simulated textile wastewater. The HDTMA-modified nano-zeolite (ZMF) was characterized by X-ray fluorescence spectrometry, X-ray diffraction and scanning electron microscopy. The ZMF presented negative charge probably due to the formation of a partial bilayer of HDTMA on exchangeable active sites on the external surface of unmodified nanozeolite. Initial dye concentration, contact time and equilibrium adsorption were evaluated. Two kinetic models including pseudo first and second order equations were analysed to understand the adsorption process. It was found that the adsorption kinetics of SN and ST; and their hydrolysed forms followed a pseudo second-order model. Langmuir, Freundlich and Temkin models were applied to describe the adsorption isotherms. Adsorption of the dyes was best described by the Langmuir model. Acute toxicity of the leached of ZMF to a waterflea, Ceriodaphnia dubia was determined, and the results showed an EC50 value of 35%. In order to identify what substances were causing the observed toxicity for the leached of ZMF, Toxicity Identification Evaluation tests (TIE) were realized and showed that the baseline acute effects were significantly reduced after manipulation with Solid-Phase Extraction (SPE) and Ethylenediaminetetraacetic acid (EDTA). The data from the present study suggest that ZMF could be used as an adsorbent in the removal of Solophenyl dyes from wastewater.
Keywords
Coal Fly Ash, Surfactant-Modified Nanozeolite, Phthalocyanine, Direct Dye, Ceriodaphnia dubia, Copper-Complex
Received: August 4, 2015
Accepted: August 16, 2015
Published online: August 27, 2015
@ 2015 The Authors. Published by American Institute of Science. This Open Access article is under the CC BY-NC license. http://creativecommons.org/licenses/by-nc/4.0/
Contents
1. Introduction 2. Material and Methods 2.1. Preparation of Simulated Wastewater 2.2. Zeolite Synthesis 2.3. Adsorption Studies 2.4. Kinetic and Equilibrium Models 2.5. Characterization of Fly Ash and Zeolites 2.5.1. pH and Conductivity 2.6. Toxicity Assessment 2.7. Analysis 3. Results and Discussion 3.1. Characterization of the Materials 3.2. Solophenyl Navy and Solophenyl Turquoise Structures and Hydrolysis Process 3.3. Effect of Agitation Time and Initial Concentration of Dyes on Adsorption 3.4. Adsorption Isotherms 3.5. Acute Toxicity Tests with C. dubia and Identification of Toxicity in the Leached of ZMF 4. Conclusion Acknowledgements
1. Introduction
The manufacture and use of synthetic dyes for dyeing fabrics has become an industry solid. It is estimated that around 700,000 tons of dyes are produced annually around the world. Of this amount about 20% is unloaded the industrial wastes without previous treatment. However, their use has become a matter of serious concern to environmentalists. Synthetic dyes are highly toxic causing negative effects on all life forms because they present sulfur, naphthol, vat dyes, nitrates, acetic acid, surfactants, enzymes chromium compounds and metals such as copper, arsenic, lead, cadmium, mercury, nickel, cobalt and certain auxiliary chemicals [1-2].
Solophenyl Navy (SN) and Solophenyl Turquoise (ST) are blue-coloured, water-soluble direct dyes. Their chemical structure contains one phthalocyanine metal, a copper ion. These dyes are used for colouring cellulosic fibres, particularly cotton. In Brazil, SN and ST dyes are widely used in commercial laundries and in textile industry to dye jeans. They are also combined with other dyes to create new colours [3-4]. Most direct dyes have unique disazo and trisazo structures which impart particular colors [5-6]. Azo dyes consist of a diazotized amine coupled with an amine or a phenol group along with one or more azo linkages. They comprise the largest (60-70%) and the most diverse group of dyes [7].
Direct dyes are problematic compounds and widely used in the textile industry. High temperatures and alkaline conditions require for dying of the fibres but they are hydrolysed under these conditions. Hydrolysed dyes do not bind to fibres [8]. For this reason, textile wastewaters contain both hydrolysed and nonhydrolysed dye.
Amongst the various physical and chemical methods available to remove dyes from water, adsorption using activated charcoal is the most efficient. Commercially available activated carbons are usually derived from wood or coal, being considered expensive. This has led to the scientists to use lower-cost adsorbents, which are cheaper efficient substitutes [9-11].
The use of coal for energy supply is still widely employed around the world and of large importance in the global economy. However, thermal power plants face the problem of coal fly ash disposal. In Brazil, Figueira Power Plant is the only coal-based thermal power plant in the state of Parana and responsible for supplying energy for approximately 40,000 residents, moreover, it is the only large industry in the area and responsible for jobs and the state's economy. Nevertheless, the fly ash generated from coal combustion is inappropriately disposed, causing environmental problems.
The fly ash generated by power plants can be modified by physical and chemical treatment, due to their high contents of silicon and aluminium, with are the structural elements of zeolites [12-13]. The Brazilian fly ashes have been converted in zeolites and have been used as low cost adsorbent for removal of dyes from water [14-17]. It is known that zeolitic material modified with quaternary amines can substantially enhance the adsorption of non-ionic organic solutes from aqueous solutions. One of the most commonly used surfactants for zeolite surface modification is hexadecyltrimethylammonium bromide (HDTMA-Br), in which each molecule is composed of a hydrophilic and positively charged head group, and a hydrophobic tail. HDTMA-Br may form monolayers and/or bi-layers on the zeolite surface [16,18,22]. This surfactant is wide used because of its availability and low cost [23-24].
Part of the study was dedicated to describe synthesis and modification of zeolite from fly ash of Figueira Power Plant, Brazil, and characterization of this material. In addition, adsorption studies using the modified zeolitic material in removal of copper phthalocyanine dyes – SN and ST and their hydrolysis products will be also reported. The second objective was addressed to the toxicity of the modified zeolitic material. To this end, zeolitic efficacy was evaluated for toxicity using the waterflea Ceriodaphnia dubia.
2. Material and Methods
2.1. Preparation of Simulated Wastewater
The dyes Solophenyl Navy BLE 250% and Solophenyl Turquoise BRLE 400% (HUNTSMAN) were used without further purification. The stock solutions were prepared containing 30% of the quantities in the industrial formulation, The stock solutions contained 30% of the industrial formulation of the dyes (0.067g of dye and 1.005 g of NaCl in 10 mL of water) [25]. Taking into consideration that in textile effluents the direct dyes are in the hydrolysed state, the hydrolysis procedure (similar to the industrial process) was carried out to prepare hydrolysed dyes, therefore. Hydrolysed ST (STH) and SN (SNH) were prepared by mixing 5 g L-1 dye (stock solution) in 40% NaOH (pH 11-12). The solutions were heated in an oven at 70-80 °C for 90 min. Then the pH was decreased to 5 using 31% HCl 31%. The working solutions were prepared by diluting the stock solutions in water) [26].
2.2. Zeolite Synthesis
Coal fly ash was procured from a coal-fired power plant in Figueira County (Parana, Brazil). The quaternary ammonium salt hexadecyltrimethylammonium bromide (HDTMA) (99%) (Merck) was used. Fly ash (FA) was used as starting material for zeolite synthesis by hydrothermal treatment. During synthesis, 20 g of fly ash was heated to 90 °C in oven for 24 h with 160 mL of 3 M NaOH solution. The zeolite from fly ash (ZF) was repeatedly washed, until pH 10-11, with deionized water and dried at 100 °C for 24 h [27]. In order to create surfactant-modified zeolite (ZMF), 20 g of ZF was added to 400 mL of 1.8 mmol L-1 HDTMA-Br, placed on shaker for agitation for 7 h at 120 rpm. The solid phase was filtered and dried in an oven for 12 h at 50°C [18].
2.3. Adsorption Studies
Kinetics studies were conducted by agitating 10 mL of dye solution of know initial dye concentration with 0.1 g of ZMF at a 120 rpm for 5-120 min. The supernatant was separated by centrifugation at 3000 rpm. An aliquot of 0.3 mL of the supernatant was analyzed by using a Cary 1E spectrophotometer - Varian at a λmax = 604 nm for SN and SNH and λmax = 611 for ST and STH, respectively.
The amount of the dye taken up and the percentage of dye removal by the adsorbent were calculated by equations 1 and 2, respectively:
![]() (1)
(1)
![]() (2)
(2)
where qt is the adsorbed amount of adsorbate per gram of adsorbent at any time t (mg g-1), C0 and Cf the concentrations of the adsorbate in the initial solution and at any time t, respectively (mg L-1); V the volume of the adsorbate solution added (L) and M the amount of the adsorbent used (g).
2.4. Kinetic and Equilibrium Models
In order to investigate the mechanism of adsorption, characteristic constants were determined using the linearized form of pseudo-first order (Equation 3) and pseudo-second order (Equation 4) kinetic models with equations as follows:
![]() (3)
(3)
![]() (4)
(4)
where qe is the amount of dye adsorbed at equilibrium (mg g–1), qt is the amount of dye adsorbed at time t (mg g–1), k1 is the rate constant of the pseudo-first-order adsorption (min-1), and k2is the rate constant of the pseudo-second-order kinetics (g mg–1 min–1) [28-30]. The values of k1and qe were obtained from the slope and intercept respectively of plot of log (qe - qt) versus t for pseudo-first order model. The values of qe and k2 can be determined from the slope and intercept of a plot of t/qt versus t, respectively for pseudo-second-order model. The initial adsorption rate, h (mg g-1 min-1), as t→0 can be defined as (equation 5):
![]() (5)
(5)
where k2 is the rate constant of the pseudo-second order kinetics (g mg–1 min–1) and qe is the maximum adsorption capacity (mg g-1).
The adsorption isotherms were determined with initial concentrations between 10-50 mg L-1 for SN in the equilibrium time determined in kinetic studies at 25°C. The adsorption isotherm data were analyzed using three equilibrium models: Langmuir [31], Freundlich [32] and Temkin [33]. The linearized mathematical expressions are given by Equations 6 to 8, respectively:
Langmuir: ![]() (6)
(6)
Freundlich: ![]() (7)
(7)
Tenkim: ![]() (8)
(8)
The non-linear regression Chi-square test (χ2) (Equation 9), was employed as a criterion for the fitting quality due to the inherent bias resulting from the linearization of isotherm models [34].
![]() (9)
(9)
where qe exp is the equilibrium capacity of the adsorbent obtained from experiment (mg g−1), and qe calc is the equilibrium capacity obtained by calculating from the model (mg g−1). A low value of χ2 indicates that experimental data fit better to the value from the model.
2.5. Characterization of Fly Ash and Zeolites
2.5.1. pH and Conductivity
The fly ash, zeolite and zeolite modified from fly ash samples (0.25 g) were added to 25 mL of deionized water and the mixture was stirred for 24 h in a shaker at 120 rpm (Ética — Mod 430). After filtration, the pH of the solutions was measured with a pH meter (MSTecnopon — Mod MPA 210) and the conductivity was measured using a conductivimeter (BEL Engineering - Mod W12D) [35-36].
2.5.2. Point of Zero Charge (PZC)
The zeolite and zeolite modified samples (0.1 g) were placed in 50 mL of 0.1 M potassium nitrate and the mixtures were stirred for 24 h using a mechanical stirrer (Quimis – MOD Q-225M) at 120 rpm. The initial pH of solutions was adjusted to 2, 4, 10, 11, 12 and 13 by addition of 0.1 and 1 mol L-1 HCl or 3 mol L-1 NaOH solution. The difference between the two values plotted against the initial pH. The point x where the curve intersects the y = 0 is the pH of PZC.
2.5.3. Real Density and Specific Surface Area
The fly ash, zeolite and zeolite modified from fly ash samples were heated at 423.15 K for 12 h to remove volatile and moisture in a degasser (Nova 1000 Degasser). The real density and the specific surface area of fly ash and zeolite were determined using a helium picnometer (Micromeritcs Instrument Corporation) and BET Surface Area Analyser (Quantachrome Nova), respectively. The BET surface areas were obtained by applying the BET equation to the nitrogen adsorption data.
2.5.4. Morphological Analysis and Chemical Composition
To verify the morphology, fly ash, zeolite and zeolite modified from fly ash samples were covered with a thin layer of gold to make them conductive and examined using a scanning electron microscope (SEM) (XL30-Philips). The chemical composition of the samples was determined by an X-ray fluorescence equipment (IX 3000 X-ray Fluorescence Spectrometer - Rigaku).
2.5.5. Mineralogical Composition and Cation Exchange Capacity
The mineralogical composition of fly ash, zeolite and zeolite modified from fly samples were determined by X-ray diffraction (Miniflex II X-ray Diffractometer - Rigaku) using Cu Kα radiation at 40 kV and 20 mA. The scan rate was 0.05 °/s and ranged between 5 and 80° (2θ). Phase identification was done by searching the International Canter for Diffraction Data (ICDD) powder diffraction file database, with Joint Committee on Powder Diffraction Standards (JCPDS) files for inorganic compounds. In composition and cation exchange capacity (CEC) measurements, the samples of fly ash, zeolite and zeolite modified from fly were saturated with 1 mol L-1 sodium acetate, washed with distilled water (1 L) and then, mixed with 1 mol L-1 ammonium acetate solution. The sodium ion concentration of the resulting solution was determined by optical emission spectrometry with inductively coupled plasma — ICP-OES (Spedtroflame — M120).
2.6. Toxicity Assessment
2.6.1. Acute Toxicity Test for the Leached of ZMF with Ceriodaphnia dubia
In order to investigate the potential toxic effects by the zeolitic modified material in environment, acute toxicity tests were performed. The sample of zeolite modified material (2 g) was agitated with 10mL of culturing media in the equilibrium time for each dye. The supernatant was filtrated and the leached used in the tests. The brood stock of C. dubia used in the bioassays was obtained from Commonwealth Scientific and Industrial Research Organization (CSIRO), Australia, laboratories. Cultures were maintained in 1L beakers at 24±°C with a 16 h light: 8 h dark photoperiod using cool white fluorescent lamps. C. dubia were reared in formulated water (hardness 80–100 mg L-1 as CaCO3) according to the guidelines recommended by the US Environmental Protection Agency [37]. This moderately hard water (MHW) was enriched with 2 mg L-1 selenium (as Na2SeO4). The culture was fed a tri-algal mix consisting of Ankistrodesmus sp., Chlamydomonas sp. and Pseudokirchneriella subcapitata and a mixture of yeast, cereal leaves and trout chow (YCT). The culture water was replaced and the culture was fed three times per week.
Tests were conducted in 50 mL glass beaker containing 25 mL of test solution. Five neonates in quadruplicate were exposed to seven increasing concentrations of 1.5, 3.1, 6.2, 12.5, 25, 50 and 100%. As the concentration of modified zeolite on the leached were unknown, the concentrations were called 100% for the leached without dilutions and 50% for 12.5 mL of leached plus 12.5 mL of test water, etc. Test concentrations were prepared by pipetting calculated amounts of freshly prepared working stock solution of test water to achieve the required concentrations of the test chemical. Each vial was sealed with a lid and shaken vigorously to obtain a homogeneous mixture. A control and negative and positive controls were established in the same way as the testconcentrations. Copper sulphate (as CuSO4.5H2O) was used as a positive control to monitor the health of the test organisms. Concentrations of copper sulphate ranged from 5 to 20 mg L-1. The concentrations used in the definitive tests were based on the range finding tests. Water fleas were not fed during the test period. Water quality parameters were measured before and after the 24 h renewal of the test solutions. The test endpoint was immobilization after 24 h and 48 h, which was defined as the failure to move within 15 s of the beaker being gently swirled. For acute toxicity tests, the LC50 values with 95% confidence limits (p < 0.05) were calculated by the Trimmed Spearman–Karber (TSK) analysis for lethal tests [38].
2.6.2. Toxicity Identification Evaluation Test for the Leached of ZMF
In order to clarify what toxicants were causing the observed toxicity in the leached of ZMF, those concentrations characterized as toxic were further analyzed by Toxicity Identification Evaluation (TIE) procedures [39]. The tests were performed in the leached of ZMF, raw sample, (base line test) and after manipulation with SPE and EDTA. The TIE approach is divided in three phases: characterization; identification and confirmation. The subsequent performance of bioassay after each manipulation, i.g addition of ethylenediaminetetraacetic acid (EDTA), graduation of pH, solid phase extraction, etc. proves the reduction or not in the toxicity of the base sample, it means the sample not manipulated [39]. The comparison of the manipulated sample with the original one enables to identify the contaminants or mixture of contaminants responsible of the observed adverse effects [40]. The methodology for preparations of the samples followed the same order described before (item 2.6.1).
In order to reduce the bioavailability of metals, EDTA (1 g L-1) was added in each beaker and left to interact for 2 h with the leached samples. C. daphnia neonates were then added to the beaker. Raw samples (100% of the leached) were passed through solid-phase extraction (SPE) using column C18 Waters Oasis® HLB (6cc/500 mg) and nonpolar organic compounds were separated. After both manipulation, five young individuals of C. dubia (up to 24 h of live), in quadruplicates, were exposed to different concentration of the leached sample from ZMF 6.2 – 100% for 48 h. For all the tests realized with manipulation of SPE or EDTA, one base line test with raw sample, not treated, of the leached of ZMF was made, as a baseline test, simultaneously, in order to compare the samples manipulated with EDTA or SPE and not manipulated. Water quality parameters - pH, EC (conductivity), T (temperature) and DO (dissolved oxygen) were measured in the beginning and at the end of acute tests. Tests were conducted in 50 mL glass beaker containing 25 mL of test solution. Test concentrations were prepared by pipetting calculated amounts of freshly prepared working stock solution of test water to achieve the required concentrations of the test chemical. A control and negative and positive controls were established in the same way as the test concentrations. Water fleas were not fed during the test period. The test endpoint was immobilization after 24-h and 48-h, which was defined as the failure to move within 15 s of the beaker being gently swirled. The LC50 values with 95% confidence limits (p <0.05) were calculated by the Trimmed Spearman–Karber (TSK) analysis for lethal tests [38].
2.7. Analysis
Chemical analyses were performed on water samples used in the toxicity tests, for each concentration tested and the control, by Liquid Chromatography-Mass Spectrometry (LCMS) (Thermo Surveyor). A gradient pump, auto sampler and diode array detector – DAD) coupled to a mass spectrometer Thermo LXQ Linear Ion Trap with electrospray ionization (ESI+) and a diode array detector were used. The samples were filtered through ultrafiltration membranes (Millipore) with molecular weight cut 50 kDa, before injection into the chromatograph. A volume of 20 µL of sample was injected and the chromatographic separation was performed on a Hypersil GOLD column (100 mm × 4.6 mm). Methanol/water (acidified 1%, v/v) was used as mobile phase at a flow rate of 0.4 mL min−1.
3. Results and Discussion
3.1. Characterization of the Materials
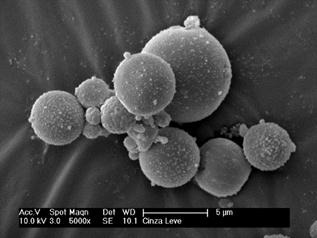
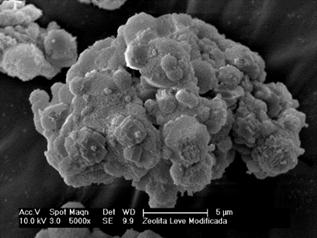
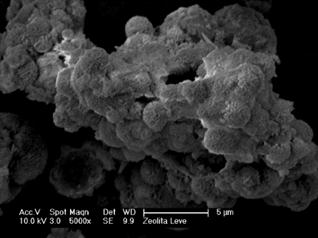
The morphology of the starting material FA, synthesized product ZF and modified zeolite ZMF were examined using SEM (Fig. 1). The FA particles were spherical in shape with smooth surface and were of different sizes (Fig. 1a). The surfaces of ZF and ZMF (Figs. 1b and 1c) were rough, suggesting that zeolite crystals were deposited on the surface of underlying fly ash particles during the hydrothermal treatment (Figs. 1b and 1c). After modification with surfactant, the surface of zeolite was covered with an organic layer. Thus, the pores were thicker packaged. However, the zeolite crystals were visible [41].
(a)
(b)
(c)
Figure 1. Scanning electron microscope micrographs of fly ash (a); zeolite from fly ash (b) and modified zeolite fly (c).
The chemical compositions of FA, ZF and ZMF determined by X-ray fluorescence (XFR) are shown in Table 1. The major constituents of FA, ZF and ZMF were silica (SiO2), alumina (Al2O3) and ferric oxide (Fe2O3). Quantities below 5 wt.% of K2O, CaO, TiO2, SO3 and MgO are also detected. The high contents of silicon and alumina suggest synthesis of zeolites. A significant amount of Na element is incorporated in the zeolitic products after hydrothermal treatment with NaOH solution due to entrapment of sodium ions to neutralize the negative charge on aluminosilicate gel [42]. The presence of bromide in the modified zeolitic material was detected since the positive charge of cation HDTMA adsorbed on the surface of the zeolite is counter balanced by anions bromide.
The SiO2/Al2O3 ratio was 2, 1.35 and 1.39 for FA, ZF and ZMF, respectively (Table 1), and this ratio is associated to the cation exchange capacity. The zeolitic materials that shows lower value of this relationship have a high ability of the particles to exchange positively charged ions. The SiO2/Al2O3 ratios for the zeolites were lower than those of raw fly ash, suggesting that the hydrothermal treatment contributed to the increase in the cation exchange capacity of those materials.
Table 1. Chemical composition of fly ash (FA), zeolite from fly ash (ZF) and surfactant-modified zeolite (ZMF).
| Elements (wt. %) | FA | ZF | ZMF |
| SiO2 | 50 | 38 | 39 |
| Al2O3 | 25 | 28 | 28 |
| Fe2O3 | 11 | 14 | 14 |
| Na2O | 0.9 | 9.2 | 7.9 |
| CaO | 2.4 | 2.9 | 2.9 |
| TiO2 | 1.7 | 2.2 | 2.1 |
| SO3 | 1.6 | 0.6 | 0.4 |
| MgO | 1.7 | 2.3 | 2.3 |
| Br | 0.02 | 0.02 | 0.05 |
| SiO2/Al2O3 | 2 | 1.35 | 1.39 |
Some of the physicochemicals properties of fly ash and its zeolitic materials are listed in Table 2. The values for bulk density of all samples showed no significant difference. In general, zeolites presented lower values of density than those of the ashes. The values for FA, ZF and ZMF were 2.45, 2.43 and 2.38 g cm-3, respectively. This suggests that the hydrothermal treatment produced a porous and less compact material than the precursor materials [43].
Table 2. Physicochemical properties of fly ash (FA), zeolite from fly ash (ZF) and surfactant-modified zeolite (ZMF).
| Properties physico-chemical | FA | ZF | ZMF |
| Bulk density (g cm-3) | 2.45 | 2.43 | 2.38 |
| BET surface area (m2 g-1) | 2.85 | 68.4 | 64.5 |
| pH in water | 8.1 | 9.9 | 10 |
| pHpzca | N.A | 7.5 | 6.5 |
| Conductivity (µS cm-1) | 248 | 387 | 213 |
| CEC (meq g-1)b | 0.249 | 2.52 | 2.73 |
(a)point of zero charge; (b) cation exchange capacity.
The specific surface areas of ZF and ZMF were approximately 22 times greater than those of their precursors. In general, large surface area results in higher reactivity with the activating agents during the synthesis of zeolites [43]. The increase in the specific surface area of zeolite compared with its ash precursor is due to the formation of zeolitic phases, which was also confirmed by X-ray diffraction analysis.
The CEC values of the ash are similar to those repeated in earlier studies [45]. The values for ZF and ZMF were approximately 10 times higher than FA, due to the hydrothermal treatment. Despite the low CEC values for FA, the products of their zeolitization ensured a better chance of exchanging ions. These low values of CEC found in ash in the present study suggest importance of converting ash into materials with high adsorption capacity [45].
The pH of the coal ash is related to the availability of macro and micronutrient [46]. The pH value of fly ash (8.1) suggest alkalinity which could be due to the presence of compounds formed by K+, Na+, Ca2+ and Mg2+in combination with carbonates, oxides or hydroxides [45]. The pH of zeolitic materials increased due to hydrothermal treatment with NaOH solution. Depoi et al [47] and Cardoso [48] found pH values of 9.18 e 11.2 for fly ash and zeolite fly, respectively. These values were similar to those found in this study.
The value of pHPZC of ZMF (Table 2) was lower than the pH in water suggesting that the surface was negatively charged in aqueous solution (pH> pHPCZ). The value of the pHPZC of ZMF obtained in this study was 6.5. This value is lower than the pH and the surface of ZMF also showed negative charge.The point of zero charge (PZC) is defined as the pH at which the surface of the adsorbent has neutral charge. The pHPCZ adsorbents depends on several factors such as the nature of crystallinity, Si/Al ratio, impurity content, temperature, adsorption efficiency of electrolytes, degree of adsorption of H+ and OH-, and, therefore, it must vary adsorbent for adsorbing [18].
The X-ray diffraction analysis (XRD) of the zeolites and ash were performed to confirm if a change occurred in the structure and identity of crystalline material after modification with surfactant. The identification and interpretation of PXRD patterns of the materials are prepared by comparing the diffraction database provided by "International Centre for Diffraction Data/Joint Committee on Power Diffraction Standards" (ICDD/JCPDS). The X-ray diffractograms of fly ash, zeolite fly and surfactant-modified zeolite are shown in Fig. 2. The crystalline species were identified for quartz (ICDD / JCPDS 001-0649) and mullite (ICDD / JCPDS 002-0430) and the zeolite product formed was identified as hydroxy-sodalite (ICDD / JCPDS 011-0401). Quartz and mullite are from the coal ash that does not were converted to the hydrothermal treatment [18]. The structural parameters of zeolites modified by surfactant were very close to those of the unmodified zeolite, suggesting that the crystalline nature of the zeolite remained intact after adsorption of HDTMA-Br. The intensity of the overlapping peaks of quartz and mullite in 26.6° increased when the zeolite was modified by surfactant. This could be because the surfactant was mostly adsorbed on hydroxy-sodalite phase [18,49].
Figure 2. XRD of fly ash (FA), zeolite from fly ash (ZF) and surfactant-modified zeolite (ZMF) (Q = Quartz; M = Mulite and H = Zeolite Hydroxy-sodalite).
The structural parameters of saturated ZMF with dyes were very close to those of the corresponding ZMF before adsorption (Fig. 3). The crystalline nature of the zeolites remained intact after adsorption of molecules of ST and SN dyes.
Figure 3. XDR before adsorption process (ZMF) and after adsorption process with Solophenyl Navy (ZMF+SN) and Solophenyl Turquoise (ZMF+ST) dyes. (Q = Quartz; M = Mulite and H =Zeolite Hydroxy-sodalite.
3.2. Solophenyl Navy and Solophenyl Turquoise Structures and Hydrolysis Process
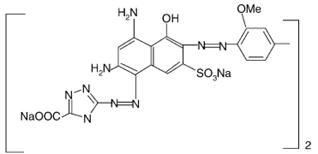
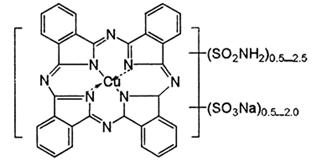
The possible chemical structures of the patented SN and ST dyes are shown in Figure 4. Those possible chemical structures were found in the literature and personal data from other authors, but with other names and not showing the colour index number, wide used for dye classification.
(a)
(b)
Figure 4. Chemical structures of (A) Solophenyl Navy SN dye (MW1100 g/mol); (B) Slophenyl Turquoise dye (MW 775.17 g/mol).
As showed in Figure 4, the structures of both dyes contain aromatic amines, sulphonate, phthalocyanine and Cu. The hydrolysis of these dyes can generate amino-naphthol. Studies realized by Gottilieb et al. [50] with Reactive Black 5, Food Yellow and Acid Orange 7 dyes showed the formation of sulphanilic acid following azo bond reduction after hydrolyses process of these dyes, but different amino-naphthols compounds.
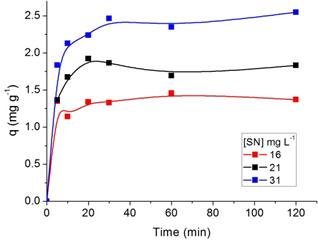
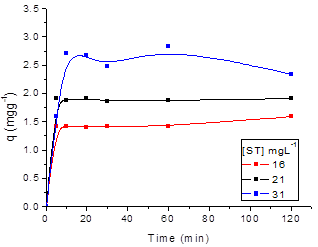
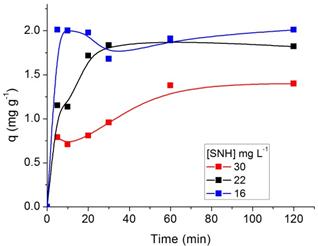
3.3. Effect of Agitation Time and Initial Concentration of Dyes on Adsorption
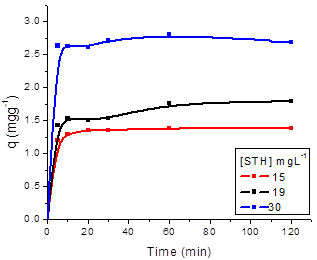
The effect of agitation time on the adsorption process of SN, ST, SNH and STH onto ZMF were investigated at different initial dyes concentrations (Fig. 5 and 6, respectively). The removal of dyes in solution increased with the contact time until a state of equilibrium is reached. The equilibrium time was independent of the initial concentration of dyes. The rate of uptake was rapid in the the first 10 min. The adsorption equilibrium for SN and ST was reached at 20 min with ZMF (Fig. 5a and b). For SNH and STH, the equilibrium time was reached at 30 min with ZMF (Fig 6a and b). The processes showed a removal in the equilibrium time of 78 and 66% for SN and STH and 85 and 91% for ST and STH by ZMF, respectively.
(a)
(b)
Figure 5. Effect of agitation time and initial concentration on the adsorption capacity of Solophenyl Navy (a) and Solophenyl Turquoise (b) by ZMF (T= 25 oC; pH = 5).
Regarding the dyes hydrolysed, we conclude that possibly after hydrolysis process with the size reduction of the dye molecule, the equilibrium time showed no significant difference when comparing the pattern forms for both dyes. Although the molecular weight of SN is higher than that of ST, no difference in their adsorption patterns was noted. The efficiency of adsorption increased with an increase in the initial concentration of dye for both adsorbents. The rapid removal of the adsorbate and the range of equilibrium in a short period is one indication that the adsorbent is efficient and economical to be used to treat wastewater.
(a)
(b)
Figure 6. Effect of agitation time and initial concentration on the adsorption capacity of Solophenyl Navy Hydrolysed (a) and Solophenyl Turquoise Hydrolysed (b) by ZMF (T= 25 oC; pH = 5).
It is important to be able to predict the rate at which contamination is removed from aqueous solutions in order to design an adsorption treatment plant. Aiming at evaluating the adsorption kinetics of ST, SN and their hydrolysed forms onto ZMF, the pseudo-first order and pseudo-second order models were used to fit the experimental data, according to the kinetic model equations 3 to 5. The values of kinetic constants for ST and SN and its hydrolysed forms adsorption onto surfactant-modified zeolite are presented in Table 3.
The correlation coefficient R2 for the linear plots of the pseudo-second order model is higher than the correlation coefficients R1 for the pseudo-first order, suggesting that the adsorption kinetic is better represented by the pseudo-second order model. Pseudo-second order rate constants (k2) decrease with increase in the initial dye concentration for the system SN/ZMF. This could be due to faster adsorption for lower concentrations of the solute. The reverse process was observed for the SNH, where k2 values increase with the increase in the dye concentration. Similar trends have been reported by Azizian et al. [51].
Table 3. Kinetic parameters for the removal of Solophenyl Navy (SN), Solophenyl Turquoise (ST) and their hydrolysed forms Solophenyl Navy Hydrolysed (SNH) and Solophenyl Turquoise Hydrolysed (STH), respectively.
| Dye | Concentration (mg L-1) | Pseudo-first-order | Pseudo-second-order | ||||||
| k1 (min)-1 | qecal (mgg-1) | R1(1) | k2 (gmg-1 min-1) | qecal (mgg-1) | R2(2) | qeexp (mgg-1) | |||
| SN | 16 | 1.14x10⁻² | 0.182 | 0.257 | 1.11 | 1.39 | 0.999 | 1.45 | |
| 22 | 58.0 x10⁻² | 5.97 | 0.999 | 0.616 | 1.82 | 0.998 | 1.69 | ||
| 31 | 9.90 x10⁻² | 0.792 | 0.971 | 0.149 | 2.57 | 0.999 | 2.34 | ||
| ST | 16 | 0.011x10⁻² | 17.9 x10⁻² | 0.0832 | 0.231 | 1.61 | 0.998 | 1.41 | |
| 21 | 3.91 x10⁻² | 0.368 x10⁻² | 0.484 | 1.72 | 1.91 | 0.999 | 1.86 | ||
| 31 | 2.53 x10⁻² | 47.5 x10⁻² | 0.281 | 0.263 | 2.37 | 0,994 | 2.47 | ||
| SNH | 16 | 1.503 x10⁻² | 0.707 | 0.849 | 0.0783 | 1.48 | 0.988 | 1.37 | |
| 22 | 11.2 x10⁻² | 1.66 | 0.981 | 0.246 | 1.87 | 0.998 | 1.88 | ||
| 31 | 3.33 x10⁻² | 0.0846 | 0.999 | 0.416 | 2.002 | 0.998 | 1.91 | ||
| STH | 15 | 20.3 x10⁻² | 0.404 | 0.999 | 0.974 | 1.39 | 0.999 | 1.34 | |
| 19 | 2.81 x10⁻² | 0.204 | 0.943 | 0.254 | 1.82 | 0.999 | 1.53 | ||
| 30 | 1.41 x10⁻² | 0.749 | 0.997 | 0.469 | 2.71 | 0.999 | 2.71 | ||
(1) R1 = Correlation coefficients of pseudo-first-order model; (2) R2= Correlation coefficients of pseudo-second-order model; k2 is the rate constant of the pseudo-second order kinetics (g mg–1 min–1); qe is the amount of dye adsorbed at equilibrium (mg g–1).
3.4. Adsorption Isotherms
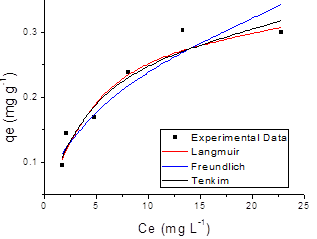
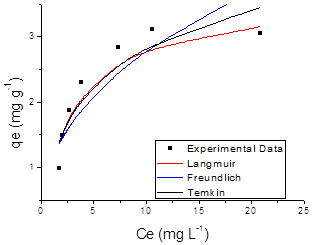
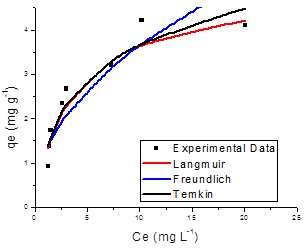
The adsorption results obtained in this study were fitted to the Langmuir, Freundlich and Temkin isotherm models. Figures 7 and 8 shows the adsorption isotherm of SN, ST and its hydrolysed forms onto ZMF and ZMB samples at 25 ºC, were the experimental values and curves achieved from the values estimated by Langmuir, Freundlich and Temkin models are presented.
Giles et al. [52] state that isotherm shapes are largely determined by the adsorption mechanism, and thus can be used to explain the nature of adsorption. The adsorption isotherm for solution may be classified into four main classes relating to their shapes termed S, L, H and C and subgroups 1, 2, 3, 4 or max. The shape of the curve of the isotherms demonstrated that all the systems studied showed favourable to adsorption process (FIG. 7 and 8). Listed in Table 4 are the isotherms of adsorbate/adsorbent systems tested in this study which are classified according to Giles et al. [52].
The isotherms of type L2 and L4 indicate the formation of a saturated monolayer of solute molecules on the surface of the adsorbent and the adsorption affinity increases with increasing concentration of the adsorbate until saturation [52]. It has initial curvature down due to decreased availability of active sites [53]. The curve L2 occurs, probably, in most cases of adsorption in diluted solution. This classification is typical of a high affinity between the adsorbate and the adsorbent. In isotherms class S (sigmoidal shape), the initial slope is convex to the axis of concentration, and is often broken by a point of inflection leading to the characteristic shape S. increases in concentration are parallel to those of Class L. The isotherms of type S have two causes. First, solute-solute attractive forces on the surface can cause cooperative adsorption that takes the form S. Second, the adsorption of a solute can be inhibited by a competing reaction within the solution as a complexation reaction [53].
The parameters obtained by linear regression of the linearized models of the Langmuir, Freundlich and Temkin isotherms for SN, ST dyes and their hydrolysed form are shown in Table 5, which also presents the correlation coefficient (R2) and the value of Chi-square test,(χ2), calculated from Equation 9.
(a)
(b)
Figure 7. Adsorption isotherm of Solophenyl Navy (a) and Solophenyl Turquoise (b) onto surfactant-modified zeolite (ZMF).

(a)
(b)
Figure 8. Adsorption isotherm of Solophenyl Navy Hydrolysed (a) and Solophenyl Turquoise Hydrolysed (b) onto surfactant-modified zeolite (ZMF).
Table 4. Classification of isotherms of Solophenyl Navy (SN), Solophenyl Turquoise (ST) and its hydrolysed forms Solophenyl Navy Hydrolysed (SNH) and Solophenyl Turquoise Hydrolysed (STH) dyes onto ZMF.
| Dye/ZMF system | Giles et al. (1960) classification |
| SN | L4 |
| ST | L2 |
| SNH | S4 |
| STH | L2 |
Table 5. Adsorption isotherm models for Solophnyl Navy (SN), Solophenyl Turquoise (ST) and its hydrolysed forms Solophnyl Navy Hydrolysed (SNH) and Solophenyl Turquoise Hydrolysed (STH) by surfactant-modified zeolite (ZMF).
| Adsorbent | Langmuir | ||||
| Qoa | bb | R2 | χ2 | ||
| SN | 3.26 | 0.237 | 0.991 | 0.0103 | |
| SNH | 2.91 | 0.131 | 0.942 | 0.318 | |
| ST | 3.57 | 0.366 | 0.998 | 0.202 | |
| STH | 4.93 | 0.295 | 0.984 | 0.398 | |
| Freundlich | |||||
| Kfc | n | R2 | χ2 | ||
| SN | 0.0903 | 2.34 | 0.958 | 0.0162 | |
| SNH | 0.972 | 4.45 | 0.823 | 0.710 | |
| ST | 1.09 | 2.44 | 0.882 | 0.454 | |
| STH | 1.24 | 2.11 | 0.909 | 0.439 | |
| Temkin | |||||
| btd | Bt | Kte | R2 | χ2 | |
| SN | 306 | 0,811 | 2.22 | 0.970 | 0.0104 |
| SNH | 695 | 0,365 | 12.4 | 0.786 | 0.330 |
| ST | 298 | 0,830 | 1.12 | 0.932 | 0.251 |
| STH | 218 | 1,13 | 2.65 | 0.961 | 0.864 |
(a) mg g-1; (b) L mg-1; (c) [(mg g-1)(L mg-1)1/n]; (d) J mol-1; (e) L g-1
The R2 in the Langmuir isotherm model was higher than in the other fitted models, showing that the experimental equilibrium data for all the systems were better explained by the Langmuir equation. This finding supports the assumption that the ST and SN dyes are adsorbed as a homogeneous monolayer onto ZMF particles sites and have a free-energy change for all adsorption sites [33]. The values of regression coefficients, R2 and the linear error functions, χ2, are co-related. The lower value of χ2 confirmed statistically a better fit to the Langmuir isotherm for all the systems studied. The constant values n (2 <n <10) indicated that the adsorption process was favourable to the ranges of concentrations of the dyes studied [54].
The STH dye showed a higher value of maximum adsorption capacity relative to their non-hydrolysed form onto ZMF. This could be due to the fact that after hydrolysis process of both dye the molecular weight decreases, making the adsorption be more efficient.
The adsorption of SN, ST dyes and their hydrolyzed forms by surfactant-modified zeolite was attributed to the loaded HDTMA. Previous studies showed the formation of an incomplete bilayer of modified zeolite with 1.8 mmol L-1 of HDTMA-Br and results of zeta potential indicated that the surfactant-modified zeolite had negative charge [14,18]. The same conclusions were found in this study.
It is proposed that multiple mechanisms are involved in the adsorption of SN and ST dyes on the ZMF due to the wide variety of functional groups that the dyes molecules have and the properties surfaces of the zeolite modified.
Zeolite modified materials have negative charge in water, as demonstrated by the pHPCZ (Table 2), indicating the formation of an incomplete bilayer of HTDMA on the surface of the zeolite.
The dyes used in this study contain sulfonated groups (-SO3) and are therefore anionic dye in aqueous solution. Thus, the partitioning of their molecule inside the group "tail" hydrophobic of the molecule of the surfactant adsorbed on the surface of modified zeolites (ZMF) should be the primary mechanism involved in adsorption.
The SN dye has the OH- group in its structure, and thus, the oxygen donor of electron can connect to "head" group of the surfactant positively charged present on the surface of the zeolite constituting the other adsorption mechanism. Regarding the dyes after hydrolysis, with the possible formation of a compound OH-, as an end product, the same mechanism described for SN could be considered for hydrolysed forms SNH and STH.
3.5. Acute Toxicity Tests with C. dubia and Identification of Toxicity in the Leached of ZMF
In the present study, toxicity was evaluated for the leached of ZMF in concentrations of 6.25-100% to determine EC50 ranges for C. dubia. The results indicate the EC50 of water treated with ZMF was 35.2% (27.1-45.6%, 95%) for C. dubia. Regarding the TIE procedures, the results can be observed in Table 6.
Table 6. Toxicity Identification Evaluation for leached of ZMF before and after manipulation with ethylenediaminetetraacetic acid (EDTA) and solid-phase extraction (SPE). Standard error value for 4 replicates are showed in parenthesis.
| ZMF (raw) | ZMF + EDTA | ZMF + SPE | |
| n. of alive | |||
| Control | 10 (0) | 10 (0) | 10 (0) |
| 100% | 0 (0) | 9 (0.957) | 9 (0.577) |
| 50% | 0 (1.41) | 9 (0.816) | 9 (0.577) |
| 25% | 2 (0.577) | 10 (0.433) | 10 (0.5) |
The samples chosen for TIE application showed relevant toxicity in the raw form. The results show that both treatments were able to eliminate the toxicity in the samples tested (Table 6). These results suggested that the toxicity of the leached of ZMF was influenced by EDTA and SPE manipulation, suggesting that the toxicants are metals and non-polar organic compounds, respectively. In order to identify the toxicity (showed in Table 6) due to metals, it was verified, by chemical analysis, that the concentration of As (Table 7) is capable of cause acute effects to C. dubia
Table 7. Major elements found in the leached of surfactant-modified zeolite from fly ash without dilutions or purification. EC50 values are showed together for comparison.
| Element | Cl- | Br- | Na | As | B | U |
| mg/L | 79 | 4 | 119 | 0.95 | 2.5 | 0.11 |
| EC50A | NA | 0.18 | NA | 0.5 | 56 | 0.39 |
A – values found in literature; NA – not applicable
One possible reason for this toxicity after contact with water could be due to the presence of residual surfactant in the effluent. The leached could contain HDTMA+ cations. It has been postulated that the toxicity of a surfactant is highly specific for the organism tested [55]. They showed that the EC50 value for D. magna of 0.38 mg L-1 for HDTMA-Br. According to Sandback et al. [56], daphnia are particularly susceptible to cationic surfactants such as the hexadecyltrimethylammonium bromide. Similar results for toxicity of HDTMA onto C. dubia were also found in the literature [57,55].
Chlorine and sodium are present in culturing media for C. dubia promoting all the necessary nutrients for good growth. The value found for Br- is above the EC50 values found in literature (0.18 mgL-1 24 h, for Daphnia magna) [58], however, the results of chemical analysis on cultivation water of C. dubia showed high values of Br- after 48 h test (3.8 mg L-1) which did not cause toxicity.
According to Fikirdesici et al. [59] the Ec50 values for daphnids is 0.5 mg L-1 for Arsenic (As). The values found in the sample for As was 0.95 mgL-1. The toxicity of As to aquatic organisms is somewhat complicated by the existence of two different inorganic As species, As (III) and As (V), which may can both be found in this study. A further complication results when As (III) is slowly oxidized to As (V) under the oxygen-rich conditions generally employed in aquatic toxicity tests. It is generally accepted that As (III) is more toxic than As (V), an assumption substantiated by at least studies with freshwater invertebrate [60,61,62]. Therefore, it is possible that As caused the observed toxicity in this study.
Regarding TIE tests, EDTA, used in manipulated samples, is a chelating agent that forms non-toxic complexes with the metals Al3+, Ba2+, Cd2+, Co2+, Cu2+, Fe2+, Pb2+, Mn2+, Ni2+, Se2+ and Zn2+. The chelation is dependent on the pH, the type of metal, the presence of other ligands in the solution, and the affinity of the metal with the EDTA [39]. Selenides, chromates and hydrochromates are not chelated by EDTA, while As and Hg form weak chelates with EDTA [63]. For the metals Zn2+, Pb2+ and Cu2+, the pH (average of 8.08) of the tests carried out in this study would explain the EDTA chelation capacity [63]. We believe after treatment with EDTA and potential chelation, As was not toxic to C. dubia.
After the treatment with SPE, the toxicity for the leached of ZMF was eliminated (Table 6). The process of SPE retained non-polar organic species, such as HDTMA+, in the cartridge resulting in reduced toxicity in the sample tested.
The observed toxicity in the present study could be due to the mixture of low concentrations of Cd, Cr, Cu, Pb, Zn, U and Mn. It has been reported that the joint action of the metals, individually at concentrations close to their NOECs, could be toxic to aquatic organisms [61,64].
Acute tests with metals mixed at multiples of the LC50 indicated that the joint action of the metals, e.g. Cu, As, Cd, Zn, Ag, U, was more than additive for fathead minnows and nearly strictly additive for daphnids, based on toxic units calculated from the individual components of the mixture. Acute tests showed that the joint action was less than additive for fathead minnows but nearly strictly additive for daphnids, indicating that metal interactions may be different in fish than in lower invertebrates. We recommend further chronic studies using mixtures of metals below their LC50 values in Daphnia to better understand the interaction of the toxicants and the scope of their effects, as well as the identification of organic compounds found in the samples.
4. Conclusion
The present study shows that organomodified nano-zeolite from coal fly ash (ZMF) could be used as an adsorbent to remove Solophenyl Navy and Solophenyl Turquoise dyes and their hydrolysed forms from simulated textile effluent. The dye removal efficiency was in the range of 66-78% for SN and STH and 85-91% for ST and STH, respectively. The pseudo-second order kinetic model agrees with the dynamic behaviour for the adsorption of ST and SN and it hydrolysed forms onto ZMF. The adsorption isotherms could be fitted well by the Langmuir model for all the systems studied. The ecotoxicity studies showed that the wastewater treated by ZMF should not be discarded directly into water bodies, but can be reused as non-potable water for industrial purposes. The EC50 of effluent of ZMF was 35.2% for C. dubia. This toxicity could be due to the residual surfactant found in the aqueous solution after the treatment with ZMF plus metals. The toxicity was substantially reduced after treatment with both, SPE and TIE, suggesting that the toxicants could be a mixture of metals and organic compounds. The use of the coal fly ash for production of modified zeolite could be an alternative and environmental friendly use of this material.
Acknowledgements
The authors thank the National Council for Scientific and Technological Development (CNPq), Brazil for the financial support, Nuclear and Energy Research Institute (IPEN/USP), Brazil, Commonwealth Scientific and Industrial Research Organization (CSIRO), Australia for providing technical assistance and Carbonífera do Cambuí Ltda. for supplying the coal ash samples.
References
- Kant R. Textile dyeing industry an environmental hazard. Natual Sci. 2012, 4(1), 22-26.
- Carneiro P. A., Pupo N.R.F., Zanoni, M.V.B. Homogeneous photodegradation of C.I. Reactive Blue 4 using a photo-Fenton process under artificial and solar irradiation.Dye. Pigment. 2007 74(1), 127-132.
- Melo C. Remoção de cor de efluente de tinturaria em leito poroso.Dissertation. State University of Campinas, 2007.
- Schimmel D., Fagnani K.C., Oliveira dos Santos J.B., Barros M.A.S.D., Silva, A.E. Adsorption of turquoise blue QG reactive dye on commercial activated carbon in batch reactor: Kinetics and equilibrium studies. Braz. J. Chem. Eng. 2010, 27(2), 289-298.
- Perkins WS. Textile coloration and finishing. Durham, North Carolina: Carolina Academic Press; 1996.
- Shore J. Cellulosic dyeing. Society of Dyes and Colourist, United Kingdom, 1995.
- Bae J-S., Harold S., Freeman H.S. Aquatic toxicity evaluation of cooper-complexed direct dyes to the Daphnia magna. Dyes Pigm. 2007, 73, 126-132.
- Chattopadhyay S.N, Pan N.C., Day A. Reuse of reactive dyes for dyeing of jute fabric. Bioresour. Technol. 2006, 97(1), 77–83.
- Gupta V.K., Carrott P.J.M., Ribeiro C., Suhas M.M.L. Low-Cost Adsorbents: Growing Approach to Wastewater Treatment - A Review. Crit. Rev. Env. Sci. Technol. 2009, 39(10), 783-842.
- Bhatnagar A., Sillanpää M.. Utilization of agro-industrial and municipal waste material as potential adsorbents for water treatment: A review. Chem. Eng. J. 2010, 144(2), 227-296.
- Kyzas G.Z., Lazaridis, N.K. Reactive and basic dyes removal by sorption onto chitosan derivatives. J. Colloid Interface Sci. 2013, 331(1), 32–39.
- Querol X., Moreno N., Umanã J.C., Alastuey A., Hernandez E., López-Soler A. Plana, F. Synthesis of zeolites from coal fly ash: an overview. Int. J. Coal Geol. 2002, 50(1-4), 413-423.
- Rayalu S.S., Bansiwal A.K., Mesheram S.U., Labhsetwar N., Devotta S. Fly ash based zeolite analogues: versatile materials for energy and environmental conservation. Catal. Sur. Asia. 2006, 10(2), 74-88.
- Bertolini T.C.R., Izidoro J.C., Magdalena C.P., Fungaro D.A. Adsorption of Cristal violet dye from aqueous solution onto zeolites from coal fly and bottom ashes. Orbital. 2013, 5(3), 179-191.
- Fungaro D.A., Magdalena C.P. Adsorption of reactive red 198 from aqueous solution by organozeolite from fly ash: Kinetics and equilibrium studies. In. J. Chen. Environ. Eng. Sis. 2012, 3(3), 74-38.
- Fungaro D.A., Borrely S.I., Carvalho T.E.M. Surfactant modified zeolite from cyclone ash as adsorbent for removal of reactive orange 16 from aqueous solution.Am. J. Environ. Prot. 2013, 1(1), 1-9.
- Cunico P., Fungaro D.A., Magdalena C.P. Adsorção do reativo preto 5 de solução aquosa por zeólita de cinzas de carvão: estudos cinéticos e de equilíbrio. Periódico Tche Chímica. 2011, 8 (16), 17-24.
- Fungaro D.A., Borrely S.I. Síntese e caracterização de zeólita de cinzas de carvão modificada por surfactante catiônico.Cerâmica. 2012, 58(345), 77-83.
- Guan H., Bestland E., Zhu C., Zhu H., Albertsdottir D., Hutson J., Simmons C.T., Ginic Markovic M., Tao X., Ellis A.V. Variation in performance of surfactant loading and resulting nitrate removal among four selected natural zeolites, J. Hazard. Mater. 2010, 183(1-3), 616-621.
- Li Z.H. Sorption kinetics of hexadecyltrimethylammonium on natural clinoptilolite. Langmuir. 1999, 15(19), 6438-6445.
- Li Z.H., Bowman R.S. Sorption of perchloroethylene by surfactant-modified zeolite as controlled by surfactant loading. Environ. Sci. Technol. 1998, 32(15), 2278-2282.
- Rozic M., Sipusic D.I., Sekovanic L., Miljanic S., Curkovic L., Hrenovic J. Sorption phenomena of modification of clinoptilolite tuffs by surfactant cations. J. Colloid. Interface. Sci. 2009, 331(2), 295-3019.
- Haggerly G.M., Bowman R.S. Sorption of chromate and other inorganic anions by organo-zeolite. Environ. Sci. Technol. 1994, 28(3), 452-458
- Bowman R.S. Applications of surfactant-modified zeolites to environmental remediation.Micropor. Mesopor. Mat. 2003, 61(1-3), 43-56.
- Silva G.L., Silva V.L., Vieira M. G.A., Silva M.G.C. Solophenyl navy blue dye removal by smectite clay in a porous bed column. Adsorpt. Sci. Technol. 2009, 27(9), 861-875.
- Pinheiro A. S. Avaliação da toxicidade e genotoxicidade dos corantes azo reativos Remazol Preto B e Remazol Alaranjado 3R e da eficiência da radiação com feixe de elétrons na redução da cor e efeitos tóxicos. Thesis, University of São Paulo, 2011.
- Henmi T. Synthesis of hydroxi-sodalite ("zeolite") from waste coal ash. Soil Sci. Plant Nutr. 1987, 33(3), 517-521.
- Blanchard G., Maunaye M., G. Martin. Removal of heavy metals from waters by means of natural zeolites. Water Res. 1984, 18(12), 1501–1507.
- Ho Y.S., McKay G.Sorption of dye from aqueous solution by peat. Chem. Eng. J. 1998, 70(2), 115-124.
- Ho Y.S., McKay G. Pseudo-second order model for sorption processes. Process. Biochem. 1999, 34(5), 451-465.
- Langmuir I. Adsorption of gases on plane surfaces of glass, mica and platinum. J. Am. Chem. Soc. 1918, 40(9), 1361 – 1403.
- Freundlich H. Adsorption in solution. Phys. Chemie. 1906, 57, 384 – 420.
- Tempkin M.I., Pyzhev V. Kinetics of ammonia synthesis on promoted iron catalyst. Acta Phys. Chim. USSR. 1940, 12, 327-356.
- Ho Y-S. Selection of optimum sorption isotherm. Carbon, 2004, 42(10), 2115-2116.
- Querol X., Moreno N., Umaña J.C., Alastuey A., Hernandez E., Lopez-Soler A., Plana F. Synthesis of zeolites from coal fly ash: an overview, Int. J. Coal. Geol. 2002, 50, 413–423.
- Wang S., Wu H. Environmental-benign utilisation of fly ash as low-cost adsorbents, J. Hazard. Mat. 2006, B136, 482–501.
- USEPA. Methods for measuring the acute toxicity of effluents and receiving water to freshwater and marine organisms. Environmental Protection Agency, USA, 2002.
- Hamilton M.A., Russo R.C., Thurson, R.V. Trimmed Spearman-Karber method for estimating median lethal concentrations in toxicity bioassays. Environ. Sci. Technol. 1997, 11(7), 714-719.
- USEPA. Methods for Aquatic Toxicity Identification Evaluation, Phase I Toxicity Characterization Procedures. Environmental Protection Agency, USA, 1997.
- Montero N., Belzunce-Segarra M.J., Gonzalez J-L., Menchaca I., Garmendia J.M., Etxebarria, N., Nieto O., Franco J. Application of Toxicity Identification Evaluation (TIE) procedures for characterization and management of dredged harbor sediments. Mar. Pollut. Bull. 2013, 71, 259-268.
- Lin J., Zhan Y., Zhu Z., Xing Y. Adsorption of tannic acid from aqueous solution onto surfactant-modified zeolite. J. Hazard. Mater. 2011, 193, 102-111.
- Murayama N., Yamamoto H., Shibata J. Mechanism of zeolite synthesis from fly ash by alkali hydrothermal reaction. Int. J. Min. Met. Mater. 2002, 64(1), 1-17.
- Izidoro J.C., Fungaro D.A., dos Santos F.S., Wang S. Characteristics of Brazilian coal fly ashes and their synthesized zeolites. Fuel Process. Technol. 2012, 97(1), 38-44 (a).
- Izidoro J.C., Fungaro D.A., Wang S. Zeolite synthesis from Brasilian coal fly ash and removal of Zn2+ and Cd2+ from water. Adv. Mat. Reserch. 2012, 356-360, 1900-1908 (b).
- Paprocki, A. Zeolite synthesis from coal ash targeting its use in acid drainage decontamination mine.Dissertation, Pontifical Catholic University of Rio Grande do Sul, 2009.
- Sijakova-Ivanova T., Panov Z., Blazev K., Zajkova-Paneva V. Investigation of fly ash havy metals content and physic chemical properties from thermal power plant. Int. J. Eng. Sci. Technol. 2011, 3(12), 8219-8225.
- Depoi F.S. Desenvolvimento de métodos analíticos para a caracterização dos carvões brasileiros e suas cinzas.Dissertation, Federal University of Rio Grande do Sul, 2007.
- Cardoso A.M. Síntese integrada em condições brandas de zeólita 4A e NaP1, a partir de cinzas de carvão, para uso em detergente e descontaminação ambiental.Thesis. Catolic University of Rio Grande do Sul, 2012.
- Leyva-Ramos R., Jacobo-Azuara A., Dias-Flores P.E., Guerreiro-Coronado R.M., Mendonza-Barron J., Berber-Mendonza M.S. Adsorption of chromium (VI) from an aqueous solution on a surfactant-modified zeolite. Colloids Surf. A. 2008, 330(1), 35-41.
- Gottilieb A., Shaw C., Smith A., Wheatley A., Forsythe S. The toxicity of textile reactive azo dyes after hydrolysis and decolourization. J. Biotechnol. 2003, 101(1), 49-53.
- Azizian S. Kinetic models of sorption: a theoretical analysis J. Colloid Interface Sci. 2004, 276(1), 47-52.
- Giles C.H., Macewan T.H., Nakhua S.N., Smith D. Studies in adsorption. A system of classification of solution adsorption isotherms, and its use in diagnosis of adsorption mechanisms and in measumrement of specific surface areas of solids. J. Chem. Soc. London. 1960, 3973-3993.
- Giles C.H., Smith D., Huitson A.A general treatment and classification of the solute adsorption isotherm. I. Theoretical. J. Colloid Interface Sci. 1974, 47(3), 755–765.
- Carvalho T.E.M., Fungaro D.A., Izidoro J.C. Adsorption of reactive dyes Orange 16 from aqueous solution onto synthetic zeolite. Quim. Nova. 2011, 33(2), 358-363.
- Garcia M.T., Ribosa I., Guindulain T., Sanches-Leal J., Vives-Rego J. Fate and effect of monoalkyl quaternary ammonium surfactants in the aquatic environment. Environ. Pollut. 2007, 111(1), 169-175.
- Sandbacka M., Christianson I., Isomaa B. The acute toxicity of surfactants on fish cells, Daphnia magna and fish—a comparative study.Toxicol. In Vitro. 2000, 14(1), 61–68.
- Mark U., Soilbé J. Analysis of the ecetoc aquatic toxicity (EAT) database V: The relevance of Daphnia magna as a representative test species.Chemosphere. 1998, 36(1), 155-166.
- Montgomery J.H. Groundwater chemicals desk reference. CRS Press, New York, 1955.
- Fikirdesici S., Altinddag A., Ozdemir E. Invertigation of acute toxicity of cadmium-arsenic mixtures do Daphnia magna with toxic unit approach. Turk J. Zoll. 2010, 36(4), 543-550.
- Borgmann U., Cove R., Loveridge C. Effect of metals on the biomass production kinetics of freshwater copepods. Can. J. Fish. Aquat. Sci. 1980, 37, 567–575.
- Spehar R.L., Fiandt J.T. Acute and chronic effects of water quality criteria-based metal mixtures on three aquatic species. Environ. Toxicol. Chem. 1986, 5(10), 917-931.
- Golding L.A., Timperly M.H., Evans C.W. Non-lethal responses of the freshwater snail Potamopyrgus ntipodarum to dissolved arsenic. Environ. Monit. Assess. 1997, 47(3) 239–254.
- USEPA, Methods for Aquatic Toxicity Identification Evaluation, Phase I Toxicity Characterization Procedures, Environmental Protection Agency, USA, 1991.
- Cooper N.L., Bidwell J.R., Kumar A. Toxicity of copper, lead and zinc mixtures to Ceriodaphnia dubia and Daphnia carinata. Ecol. Environ.Sci. 2009, 72(5), 1523-1528.
- Holleman, A.F., Wiberg, E. Inorganic Chemistry. New York: Academic Press, 2001.


