
Journal of Nanoscience and Nanoengineering, Vol. 1, No. 2, August 2015 Publish Date: Aug. 7, 2015 Pages: 66-73
Simulation of Graphene Nanoribbon Based Gas Sensor
G. R. Ahmed Jamal1, *, Mokter M. Chowdhury2, Fahrin Rahman1, M. Aminur Rahman1, Sharika Shabnaz1, Umma Habiba1
1Department of Electrical and Electronic Engineering, University of Asia Pacific, Dhaka, Bangladesh
2Department of Electrical and Electronic Engineering, Bangaldesh University of Engineering and Technology, Dhaka, Bangladesh
Abstract
Potential of Graphene nanoribbon (GNR) as a gas sensor is investigated in this work through a simulation based on semi empirical computations. The interactions between GNR (both pristine and defective) and three gas molecules (Ammonia, Mithane and Water) are deeply studied. A summary of some recent studies is presented so as to show that all GNRs, especially all sub-10 nm GNRs, exhibit semiconducting behavior with finite bandgap which is good to be used as a sensor. A sub-10 nm armchair-edged GNR is selected here to be used as sensing element for these three gases. All three gas molecules showed much stronger adsorption on the defective GNR than that on the pristine GNR. The change in density of state DOS diagram of pristine GNR before and after contacting gas molecules was found to be almost negligible near Fermi level. Change in GNR band feature due to donor type gas molecules was observed to be completely opposite of that for acceptor type gas molecules. The simulation result was compared with previous theoretical and experimental works so as to confirm that the observations from this work are consistent with relevant earlier works. Effect of distance and number of interacting gas molecules on Density of states of GNR was also shown. This work reveals that GNR can be a better sensor than graphene and the sensitivity of GNR-based chemical gas sensors could be drastically improved by introducing the appropriate defect.
Keywords
Graphene, GNR, Armchair, Adsorption, Gas Molecule, Density of States
Received: July 9, 2015
Accepted: July 26, 2015
Published online: August 8, 2015
@ 2015 The Authors. Published by American Institute of Science. This Open Access article is under the CC BY-NC license. http://creativecommons.org/licenses/by-nc/4.0/
1. Introduction
Graphene, a two-dimensional (2D) monolayer honeycomb structure of carbon, has attracted a great deal of interest since its successful preparation in 2004 [1]. Due to its unique mechanical, structural, and electronic properties, graphene has potential in the applications of nanoelectronics.
Graphene nanoribbons (GNRs) are strips of graphene with ultra-thin width on the order of nanometers up to tens of nanometers. The nanoribbons can have arbitrarily long length and, as a result of their high aspect ratio, they are considered quasi-one dimensional (1D) nanomaterials. GNRs are a relatively new class of nanomaterials that can have metallic or semiconducting character, and are currently being investigated for their interesting electrical, optical, mechanical, thermal, and quantum-mechanical properties [2].
There are two types of ideal GNR, which are called armchair GNRs (aGNRs) and zigzag GNRs (zGNRs). The GNR has an armchair cross-section at the edges, while the zGNR has a zigzag cross-section. In addition, the GNRs are also labeled by the number of armchair or zigzag chains present in the width direction of the aGNR and zGNR respectively. If Na be the number of armchair chains and Nz the number of zigzag chains, then the nanoribbon can be conveniently denoted as Na-aGNR and Nz-zGNR respectively. The three types of aGNR are determined from whether Na = 3p or Na = 3p + 1 or Na = 3p+2, where p is a positive integer.
Earlier theoretical studies, mainly based on simple tight-binding (TB) approximations, predicted that GNRs can be either metallic or semiconducting depending on GNR types. As per TB calculations, zigzag-edged GNRs are all metallic regardless of their widths, and armchair-edged Na-aGNR is metallic if Na = 3p + 2 (where p is a positive integer) otherwise, it is semiconducting [3-7].
Recently, both theoretical [7–10] and experimental [11–14] works have shown that quantum confinement and edge effects introduce a band gap in narrow GNRs independent of their chirality. According to first-principles calculations there are no metallic nanoribbons [7]. Density functional theory (DFT) calculation clearly showed that all zigzag-edged and armchair-edged GNRs have a finite band gap [10] and this energy gap depends strongly on the width of the channel for GNRs [14]. Sub-10 nm GNRs with smooth edges were obtained recently and demonstrated to be semiconductors with band gap inversely proportional to w [11]. All the sub-10-nm GNRs were found semiconducting with adequate band gap [12,15].
A gas sensor is a device which detects the presence of various gases within an area, often as part of a safety system. Sensing gas molecules is critical to environmental monitoring, control of chemical processes, space missions, agricultural and medical applications. The sensor property is based on changes in the resistivity due to molecules adsorbed on the sensing elements like carbon nanotube, graphene or graphene nanoribbon. It was reported that semiconducting CNTs (carbon nanotubes) could be used to detect small concentration of Ammonia (NH3), Nitrogen di-oxide (NO2), and Oxygen (O2) with high sensitivity by measuring changes of the CNTs conductance upon exposure to the gases at room temperature. Gas sensors have been demonstrated using carbon nanotubes [16-20], graphene [21-27] and semiconductor nanowires [28,29] which allow detection of toxic gases in concentrations as small as 1 part per billion (p.p.b.).
As Graphene is a planar allotrope of carbon where all the carbon atoms form covalent bonds in a single plane, its two-dimensional crystal with only a surface and no volume maximizes the effect of surface dopants. The ultimate aim of any detection method is to achieve such a level of sensitivity that individual quanta of a measured entity can be resolved. In the case of chemical sensors, the quantum is one atom or molecule. Such resolution has so far been beyond the reach of any detection technique, including solid-state gas sensors. Nano sensors made from graphene are capable of detecting individual events when a gas molecule attaches to or detaches from graphene’s surface. The adsorbed molecules change the local carrier concentration in graphene one by one electron, which leads to step-like changes in resistance. The achieved sensitivity is due to the fact that graphene is an exceptionally low-noise material electronically, which makes it a promising candidate for chemical detectors [18].
Though potential of graphene as a chemical sensor has been demonstrated in a number of theoretical and experimental works [21-27], the potential of GNR for the same purpose has not been explored much. Graphene is a zero band gap semiconductor whereas all types of GNRs have some finite bandgap as discussed above. Thus, it is expected that gas molecule adsorption will have a higher effect on modifying the electronic properties of GNRs then graphene. This predicts that GNR will be more sensitive to gases and will work as a better sensor than graphene.
The fundamental objective of this work is to conduct a simulation in order to explore the potential of GNR as a gas sensor and to investigate whether it is possible to increase the sensitivity of GNR based gas sensors by introducing defect. This work will study whether it is possible to detect some common gas molecules, namely Ammonia (NH3), Methane (CH4), and water vapor (H2O) by GNR, and effect of distance of gas molecule from the GNR layer and the effect of number of gas molecule on GNR.
2. Method
In our simulation, we selected armchair-edged GNR to be used as gas sensor. Width (ω) of the Na-aGNRs can be expressed in terms of the number of lateral chains [30]:
![]() (1)
(1)
Where, a=0.246 nm is the graphene lattice constant. Bandgap (Eg) of a-GNRs depends inversely on the width and, additionally, have a dependence on the number of armchair chains. A useful first-order semi-empirical equation to express this relation [30]:
![]() (2)
(2)
Where, ω is the width of a-GNR, ωo ≈ 1.5 nm and α ranges from 0.2 to 1.5 ev-nm [14,30].
We are not going to propose any specific device structure here. Instead we will use GNR alone to observe the effect on its Density of States (DOS) due to different gas adsorption. The corresponding change in DOS can be realized in a device through external circuit. The change in the DOS, especially the area near the Fermi level, is expected to bring about obvious changes in the corresponding electronic properties [7].
For our simulation, we used QuantumWise version of the Atomistix ToolKit, ATK 13.8.2. ATK is a set of atomic-scale simulators that can calculate properties of nano-scale systems [31-34]. ATK-Semi-Empirical (ATK-SE) can model the electronic properties of molecules, crystals and devices using both self-consistent and non-self-consistent tight-binding models, based on the Slater-Koster model and the extended Hückel model. ATK-DFT can model the electronic properties of closed and open quantum systems based on density-functional theory (DFT) using numerical basis sets [31-34].
In this work, we used ATK-SE. Virtual Nano Lab (VNL) is the GUI of ATK which has a specific GNR builder tool. At first an armchair GNR was built in VNL with 5 armchair chains (Na=5) with hydrogen passivation of the edges, as shown in Fig. 1. First principle calculations showed that the edge effects play a crucial role and force the (3p + 2)-aGNRs (predicted to be metallic by TB model) to be semiconductors [7].
The next job is to form the necessary gas molecules in simulator that we want to be sensed by GNR. In this work, we want to test sensing property of GNR for three most
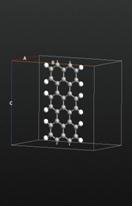
Figure 1. A 5 chain armchair-edged GNR built in Virtual Nano Lab.
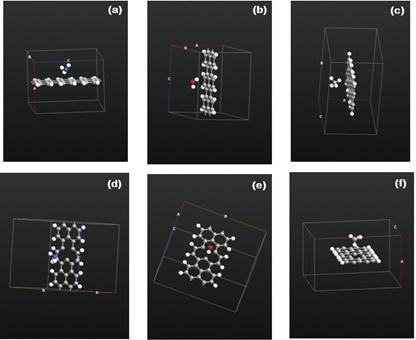
Figure 2. Single molecule of NH3, H2O, and CH4 gases were brought close to an armchair-edged ‘defect free’ GNR in (a), (b) and (c), respectively, and ‘with defect’ GNR in (d), (e) and (f), respectively, maintaining minimum equilibrium distance.
common gases around us, namely NH3, CH4, and H2O. Also, in industries, these three gases need to be sensed for various reasons. Gas molecules of NH3, CH4, and H2O were formed in the simulator using their known atomic structure and bond distance. Then these gas molecules were brought to close contact of GNR, as shown in Fig. 2. The equilibrium distances of GNR to different gas molecules were taken from the work of Zhang et al [22] who provided equilibrium graphene–molecule distance, defined as the center-to-center distance of nearest atoms between graphene and small molecules. Rest other parameters are adjusted as per the requirement of the simulator in order to conduct GNR based simulation. Then Band structure and Density of States (DOS) is generated by simulation considering both ‘with defect’ and ‘without defect’ armchair-edged GNR with gases and without gases.
3. Results
After the simulation is completed, band structure and density of states (DOS) of different combinations of ‘with defect’ and ‘without defect’ armchair-edged GNR with gases and without gases were obtained from the output of the simulator.
As a quick check of the validity of generated output, at first we will calculate bandgap of the aGNR from simulated DOS in Fig. 3 and will then compare it with predicted bandgap for this specific 5-aGNR. The calculated bandgap from DOS is ~0.13 ev. Now, using Eqn (1), width of the specific 5-aGNR used here is,
![]()
Hence, from Eqn (2), Bandgap of this a-GNR [30],
![]()
This gives the value of α to be 0.26 so as to match with calculated bandgap. This value of α is valid as α ranges from 0.2 to 1.5 [14,30].
This result clearly proves that simulated DOS conforms to predicted structure, at least near Fermi level.
3.1. Observations on Interaction of GNR with Different Gas Molecules
This section will give precise observations on simulated results. Figure 4 shows the Density of states of defect free aGNR before and after contacting different gas molecules. Fig, 4(a) gives the DOS of defect free aGNR before contacting any gas molecule, 4(b) gives the DOS of defect free aGNR after contacting a single molecule of NH3 gas. Similarly, 4(c) and 4(d) shows DOS of defect free aGNR after contacting single molecule of CH4 and H2O gases, respectively. After observing the DOS diagram in all of these figures, it can be clearly noticed that there is no significant changes in DOS of defect free GNR before and after contacting any of the three gas molecules under consideration. From this observation, it can be said that defect free GNR is not suitable to be used as a gas sensor.
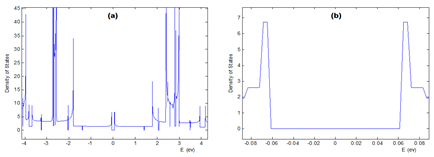
Figure 3. (a) Density of state diagram of a defect free aGNR, (b) Enlarged portion of the DOS near Fermi level to measure the bandgap of this aGNR.
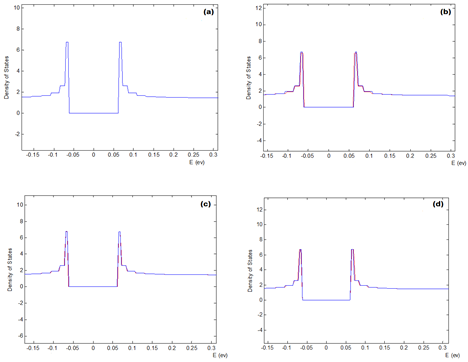
Figure 4. Density of state of defect free aGNR before and after contacting different gas molecules. (a) DOS of defect free aGNR before contacting any gas molecule (blue). (b), (c) and (d) shows DOS of defect free aGNR after contacting single molecule of NH3, CH4 and H2O gases (red), respectively.
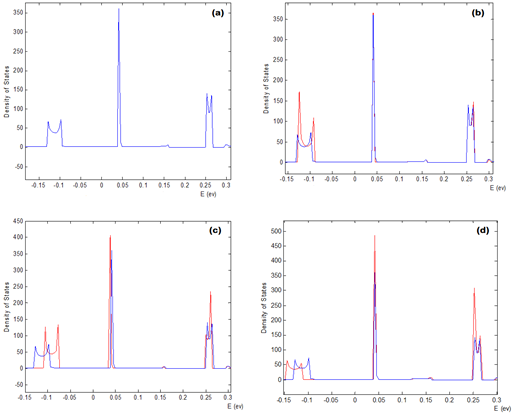
Figure 5. Density of state of aGNR with defect before and after contacting different gas molecules. (a) DOS of aGNR with defect before contacting any gas molecule (blue). (b), (c) and (d) shows DOS of aGNR with defect after contacting single molecule of NH3, CH4 and H2O gases(red), respectively.
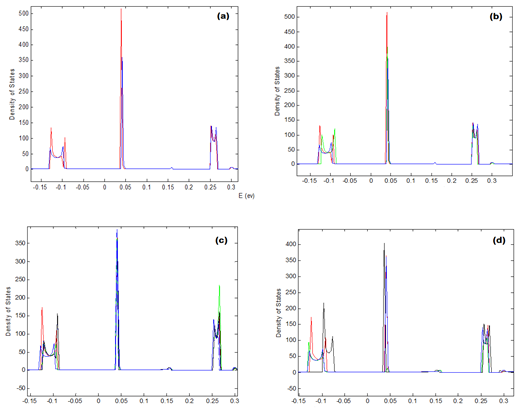
Figure 6. Effect of number and distance of different gas molecules on Density of state of aGNR with defect. (a) DOS of aGNR with defect when contacted a CH4 molecule from a minimum (blue) and relatively far (red) distance, (b) for contacting two CH4 molecules (green), (c) for contacting two NH3 molecules (green) and (d) for contacting single NH3 molecule from three different distances.
Figure 5 shows the Density of states of GNR with defect before and after contacting different gas molecules. Fig, 6(a) gives the DOS of GNR with defect before contacting any gas molecule, 5(b) gives the DOS of GNR with defect after contacting a single molecule of NH3 gas. Similarly, 5(c) and 5(d) shows DOS of GNR with defect after contacting single molecule of CH4 and H2O gases, respectively. After observing the DOS diagram in Fig. 5(a), we noticed that DOS of GNR with defect is significantly different from defect free GNR with additional spikes near Fermi level. When we observe the DOS in Fig 5(b), (c) and (d), it can be clearly noticed that DOS of GNR with defect varies significantly after contacting gas molecules under consideration and the nature of this variation is different for different gases. For NH3 and CH4 molecules, the band feature and corresponding Fermi level shifted towards right (to higher energy). This right shifting is more for CH4 molecule than NH3 molecule. On the other hand, for H2O molecule, the band feature and corresponding Fermi level shifted towards left (to lower energy). We will check the validity of these results in the later part of this article after comparing them with previous reports on relevant work.
Figure 6 shows the Effect of number and distance of different gas molecules on Density of state of aGNR with defect. In Fig. 6(a), DOS of aGNR with defect when contacted a CH4 molecule from a relatively far (red) distance is shown. It is noticed that band feature slightly shifted to right because of distant CH4 molecule in compared to same molecule from minimum equilibrium distance. Fig. 6(b) shown the change in DOS (green) when more than one CH4 molecules approach the GNR, shifting the band feature to further right direction in compared to the band feature due to single CH4 molecule. Fig. 6(c) shows the DOS of GNR when two NH3 molecules contacted it (green). The nature of change in DOS is little bit ambiguous in this case. Fig. 6(d) shows the changes in DOS when single NH3 molecule contacted GNR from three different distances. It can be observed that band feature of GNR with defect shifted towards right with increasing distance of NH3 molecule.
3.2. Comparison and Verification of the Results from Relevant Previous Works
Table I. Nature of charge carrier doping in graphene by different common chemicals.
| Species | Doping |
| Ethanol | Electron |
| CO | Electron |
| NH3 | Electron |
| NO2 | Hole |
| H2O | Hole |
| O2 | Hole |
In this work, we used NH3, H2O and CH4 gases. Table-I, taken from [21,23,27] says, NH3 is donor and H2O is acceptor for graphene. CH4 is not mentioned here, so, effect of CH4 on graphene is unknown.
Now, Zhang et al. [22] reported that the adsorption of CO onto the D-graphene (i.e. Graphene with defect) causes the major band features to move towards higher energy; in other words, the Fermi level shifted towards lower energy. As CO and NH3 both are donor to GNR, so, similar behavior is expected from NH3, i.e. shifting of band feature to higher energy. We observed right shift of band feature in DOS for NH3 with D-graphene in our simulation as shown in Fig. 5b, i.e. shifting of band feature to higher energy. This can be considered as a support to our result for donor type gas.
Hasan et al. [24] reported from their first principle calculation that band features moves towards lower energy for NO2 which is an acceptor. So, similar behavior is expected from H2O which too is acceptor. We observed left shift of band feature (opposite to that for donor type) in our simulated DOS shown in Fig. 5d due to H2O molecule with D-graphene, i.e. shifting of band feature to lower energy. This can be considered as a support to our result for acceptor type gas.
Schedin et al. [21] reported from their experiment that the gas-induced changes in resistivity had different magnitudes for different gases and the sign of the change indicated whether the gas was an electron acceptor (e.g., NO2, H2O, and O2) or an electron donor (e.g., CO, ethanol, and NH3), as shown in Fig. 7. Our simulated result for GNR, where we observed opposite changes in band structure (and Fermi level) of GNR due to donor and acceptor type gases, goes in line with their observation. So, their work can be taken as another support for our result.
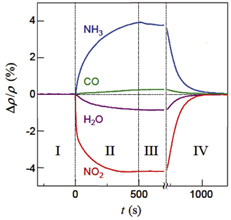
Figure 7. Change in resistivity due to exposure of graphene device to different gases, as reported in [21]. Positive change in resistivity indicates electron doping whereas, negative change in resistivity indicates hole doping in graphene.
Finally, about CH4, it was not readily known to us whether it is acceptor or donor for GNR as sensing CH4 by graphene or GNR is not reported in previous works. But, the nature of the DOS from our simulation, as shown in Fig. 5c, matches with that of a donor for GNR (like NH3). So, we conclude that CH4 is donor for GNR.
However, Lu et al. [18] reported CH4 to be donor with Carbon nanotube. Being a quasi one-dimensional nanomaterial with finite band gap, interaction of GNR with CH4 is expected to be similar with CNT. So, their report can be considered as an indirect support for our conclusion regarding CH4.
Now, we will discuss the observation on our simulated results shown in Fig. 6 that represent the effect of number as well as distance of different gas molecules on Density of states of aGNR with defect. Unfortunately, we did not find any significant previous report to compare this portion of our results. But, we can try to explain our observation logically.
Figure 6b shows the change in DOS (green) when more than one CH4 molecules approach the GNR, shifting the band feature to further right direction in compared to the band feature due to single CH4 molecule. This is quite logical because increased number of donor gas molecules means stronger interaction between GNR and corresponding gas molecules that shifted the band structure towards more right direction in compared to a single molecule of same gas. Fig. 6c shows the DOS of GNR when two NH3 molecules contacted it (green). The nature of change in DOS is little bit ambiguous in this case. Thus, we cannot provide any logical conclusion from this figure.
Finally, Fig 6a and Fig 6d show the effect of varying distances of gas molecules. Band feature of GNR in Fig 6a slightly shifted to right because of a relatively distant CH4 molecule in compared to same molecule from equilibrium distance. Figure 6d shows the changes in DOS when single NH3 molecule contacted GNR from three different distances shifting the band feature towards more right with increasing distances. As we have already shown above that both NH3 and CH4 are expected to be donor type for GNR, so, the observed shift of GNR band feature towards same direction (right) due to increasing distance of both gases are logical. However, future study is needed to explain why band feature shifted to more right due to increased distance of donor molecules.
4. Conclusions
In this work, we discussed the potential of graphene nanoribbon as gas sensor. We have conducted a simulation through which we demonstrated the effect of three most common gases, namely NH3, CH4 and H2O gases, on DOS of armchair-edged GNR with defect and without defect. We observed that opposite changes occur in band feature of aGNR for donor and acceptor type gases. For donor type gas molecule like NH3, the band feature shifted towards higher energy whereas, for acceptor type gas molecule like H2O, the band feature shifted towards lower energy. We have also shown how DOS of a-GNR changes due to the effect of distance of different gas molecules as well as due to more than one gas molecule. We compared our simulation result with previous theoretical and experimental works and verified that our observations are consistent with relevant earlier works. Regarding the interaction of CH4with GNR, we reported that CH4behaves like a donor for GNR because it shifted the band feature of GNR towards the same direction like donor type NH3 gas molecule.
As further work in future, the observed changes in DOS of a-GNR can be sensed through an external circuit through proper device structure. A suitable device structure can be proposed to implement the sensor. Through the simulation of such device with external biasing, I-V curve as well as change in conductance due to changing DOS can be found which in turn can detect different types of gases. More gases can be tested following the same procedure so that their relative effect can be compared and uniqueness can be found. A DFT based simulation can be carried out to get more accurate result, though it will take more processor time. However, the work that we carried out here is enough to conclude that Graphene nanoribbon will be very effective as Gas sensor and will show better sensitivity to various gases than graphene.
References
- Novoselov K S, Geim A K, Morozov S V, et al., "Electric field effect in atomically thin carbon films", Science, 306:666, 2004.
- A. K. Geim and K. S. Novoselov, "The Rise of Graphene", Nat. Mater., 6, pp.183–9, 2007.
- Brey, L.; et al. Edge states and the quantized Hall effect in graphene. Phys. Rev. B, 73, 195408, 2006.
- Brey, L.; et al. Electronic states of graphene nanoribbons studied with the Dirac equation. Phys. Rev. B, 73, 235411, 2006.
- V. Barone, O. Hod, and G. E. Scuseria, "Electronic Structure and Stability of Semiconducting Graphene Nanoribbons", Nano Lett. 6, pp.2748-2754, 2006.
- K. Nakada, M. Fujita, G. Dresselhaus, M. S. Dresselhaus, Phys. Rev. B 54, 17954, 1996.
- Son, Y. W., Cohen, M. L. & Louie, S. G., "Energy gaps in graphene nanoribbons", Phys. Rev. Lett. 97, 216803, 2006.
- Nakada, K., Fujita, M., Dresselhaus, G. & Dresselhaus, M. S. Edge state in graphene ribbons: nanometer size effect and edge shape dependence. Phys. Rev. B 54, pp. 17954–17961, 1996.
- Barone, V., Hod, O. & Scuseria, G. E., "Electronic structure and stability of semiconducting graphene nanoribbons", Nano Lett. 6, 2748–2754, 2006.
- Yang, L. et al., "Quasiparticle energies and band gaps in graphene nanoribbons", Phys. Rev. Lett. 99, 186801, 2007.
- Li, X. L. et al. Chemically derived, ultrasmooth graphene nanoribbon semiconductors. Science 319, 1229–1232, 2008.
- Wang, X. R. et al., "Room-temperature all-semiconducting sub-10-nm graphene nanoribbon field-effect transistors", Phys. Rev. Lett. 100, 206803, 2008.
- Chen, Z. H., Lin, Y. M., Rooks, M. J. & Avouris, P., "Graphene nano-ribbon electronics", Physica E (Amsterdam) 40, 228–232, 2007.
- Han, M. Y., Ozyilmaz, B., Zhang, Y. B. & Kim, P., "Energy band-gap engineering of graphene nanoribbons", Phys. Rev. Lett. 98, 206805, 2007.
- Y. C. Chen et al., "Tuning the Band Gap of Graphene Nanoribbons Synthesized from Molecular Precursors", ACS Nano, Vol. 7’ No. 7, pp.6123–6128, 2013.
- Kong J, Franklin NR, Zhou C, Chapline MG, Peng S, Cho K, Dai H., "Nanotube molecular wires as chemical sensors", Science, 287(5453), pp.622-5. 2000.
- Collins PG, Bradley K, Ishigami M, Zettl A., "Extreme oxygen sensitivity of electronic properties of carbon nanotubes", Science, 287(5459), pp.1801-4, 2000.
- Lu, Y.; Li, J.; Han, J.; Ng, H T.; Binder, C.; Partridge, C.; Meyyappan, M. "Room temperature methane detection using palladium loaded single-walled carbon nanotube sensors. Chem. Phys. Lett. 2004, 391, 344–348.
- J Liu and G Li, "A Remote Sensor for Detecting Methane Based on Palladium-Decorated Single wall carbon nanotube", Sensors, 13, pp.8814-8826, 2013.
- J G Aguilar,I M García,A B Murcia,D C Amoros, "Single wall carbon nanotubes loaded with Pd and NiPd nanoparticles for H2 sensing at room temperature",Carbon,Volume 66, pp.599–611, 2014.
- F. Schedin, A. K. Geim, S. V. Morozov, E. W. Hill, P. Blake, M. I. Katsnelson & K. S. Novoselov, "Detection of individual gas molecules adsorbed on graphene", Nature Materials 6, pp. 652 – 655, 2007.
- Y. Zhang, Y. Chen, K. Zhou, C. Liu, J. Zeng, H. Zhangand Y. Peng,"Improving gas sensing properties of graphene by introducing dopants and defects: a first principles study", Nanotechnology 20, 185504, 2009.
- K. R. Amin, A. Bid, "Graphene as a sensor", Current Science, vol. 107, no. 430 3, August 2014.
- A Hasan, "Ab Initio Simulations of Graphene-based Nanosensor for Detecting NO2 and Li", M.Sc thesis, Department of Mechanical and Material Engineering, Ohio State University, 2009.
- H J Yoon, D H Jun, J H Yang, Z Zhou, S S Yang, M M Cheng, "Carbon dioxide gas sensor using a graphene sheet", Sensors and Actuators B 157, pp. 310– 313, 2011.
- R. Pearce, T. Iakimov, M. Andersson, L. Hultman, A. L. Spetz and R. Yakimova, "Epitaxially grown graphene based gas sensors for ultra sensitive NO2 detection", Sensors and actuators. B, Chemical, (155), 2, pp.451-455, 2011.
- E. W. Hill, A. Vijayaragahvan, and K. Novoselov, "Graphene Sensors", IEEE Sensors Journal, Vol. 11, No. 12, 2011.
- M. Law, H. Kind, B. Messer, F. Kim, and P. Yang, "Photochemical Sensing of NO2 with SnO2Nanoribbon Nanosensors at RoomTemperature", Angew. Chem. Int. Ed.,41, No. 13,2002.
- Capone, S., et al. "Solid state gas sensors: state of the art and future activities", J. Optoelect. Adv. Mater. 5, 1335-1348, 2003.
- H. S. Philip Wong, Deji Akiwande, Carbon Nanotube and Graphene Device Physics, Published by: Cambridge University Press, 2011, page 69.
- Atomistix ToolKit version 13.8, QuantumWise A/S (www.quantumwise.com)
- M. Brandbyge, J.-L. Mozos, P. Ordejón, J. Taylor, and K. Stokbro, Phys. Rev. B 65, 165401, 2002.
- J. M. Soler, E. Artacho, J. D. Gale, A. García, J. Junquera, P. Ordejón, and D. Sánchez-Portal, J. Phys. Condens. Matter 14, 2745, 2002.
- K. Stokbro, D. E. Petersen, S. Smidstrup, A. Blom, M. Ipsen and K. Kaasbjerg, Phys. Rev. B 82, 075420, 2010.


