
Journal of Nanoscience and Nanoengineering, Vol. 1, No. 3, October 2015 Publish Date: Aug. 26, 2015 Pages: 129-141
Problems in Datasets Evaluation and Visualization: Methods and Implications
Clara Sitrino, Alferino Chasinar*
Department of Computer Engineering, the University of Nigeria, Nsukka, Nigeria
Abstract
Two separate depictions of the recurrent ANN dependency graph Networks such as the previous one are commonly called feedforward, because their graph is a directed acyclic graph. Networks with cycles are commonly called recurrent. Such networks are commonly depicted in the manner shown at the top of the figure, where f is shown as being dependent upon itself. However, an implied temporal dependence is not shown. In thus study, we present a study of ANN and used a Fuzzy ANN to cluster biological dataset.
Keywords
ANN, Fuzzy Clustering, HBV Sequence, SNIP, Wild Type
Received: June 11, 2015
Accepted: August 15, 2015
Published online: August 26, 2015
@ 2015 The Authors. Published by American Institute of Science. This Open Access article is under the CC BY-NC license. http://creativecommons.org/licenses/by-nc/4.0/
Contents
1. Introduction 2. Model 2.1. Network Function 2.2. ANN Dependency Graph 2.3. Learning 2.4. Choosing a Cost Function 2.5. Learning Paradigms 2.6. Unsupervised Learning 2.7. Reinforcement Learning 2.8. Learning Algorithms 3. Process 3.1. Pre-Processing 3.2. Data Mining 3.3. Results Validation 4. Clustering and Classification Methods 4.1. Connectivity Based Clustering 4.2. Centroid-Based Clustering 4.3. Distribution-Based Clustering 4.4. Density-Based Clustering 5. Application 5.1. Science and Engineering 5.2. Human Rights 5.3. Medical Data Mining 5.4. Spatial Data Mining 5.5. Sensor Data Mining 5.6. Visual Data Mining 5.7 Music Data Mining 5.8. Surveillance 5.9. Pattern Mining 5.10. Subject-Based Data Mining 5.11. Knowledge Grid 6. Privacy Concerns and Ethics 7. Conclusion
1. Introduction
Examinations of the human's central nervous system inspired the concept of neural networks. In an Artificial Neural Network, simple artificial nodes, known as "neurons", "neurodes", "processing elements" or "units", are connected together to form a network which mimics a biological neural network.
Data mining is the process of applying these methods with the intention of uncovering hidden patterns1-10 in large data sets. It bridges the gap from applied statistics and artificial intelligence (which usually provide the mathematical background) to database management by exploiting the way data is stored and indexed in databases to execute the actual learning and discovery algorithms more efficiently, allowing such methods to be applied to ever larger data sets.
The term is a misnomer, because the goal is the extraction of patterns and knowledge from large amount of data, not the extraction of data itself.1-12 It also is a buzzword 13 and is also frequently applied to any form of large-scale data or information processing (collection, extraction, warehousing, analysis, and statistics) as well as any application of computer decision support system, including artificial intelligence, machine learning, and business intelligence. The popular book "Data mining: Practical machine learning tools and techniques with Java14 (which covers mostly machine learning material) was originally to be named just "Practical machine learning", and the term "data mining" was only added for marketing reasons.15, 16, 32-39 Often the more general terms "(large scale) data analysis", or "analytics" or when referring to actual methods, artificial intelligence and machine learning-are more appropriate.
The actual data mining task is the automatic or semi-automatic analysis of large quantities of data to extract previously unknown interesting patterns such as groups of data records (cluster analysis), unusual records (anomaly detection) and dependencies (association rule mining). This usually involves using database techniques such as spatial indices. These patterns can then be seen as a kind of summary of the input data, and may be used in further analysis or, for example, in machine learning and predictive analytics. For example, the data mining step might identify multiple groups in the data, which can then be used to obtain more accurate prediction results by a decision support system. Neither the data collection, data preparation, nor the result interpretation and reporting are part of the data mining step, but do belong to the overall KDD process as additional steps.
The related terms data dredging, data fishing, and data snooping refer to the use of data mining methods to sample parts of a larger population data set that are (or may be) too small for reliable statistical inferences to be made about the validity of any patterns discovered. These methods can, however, be used in creating new hypotheses to test against the larger data populations.
For the research and evolution, the premier professional body in the field is the association for Computing Machinery's (ACM) Special Interest Group (SIG) on Knowledge Discovery and Data Mining (SIGKDD)11, 12 Since 1989 this ACM SIG has hosted an annual international conference and published its proceedings,13 and since 1999 it has published a biannual academic journal titled "SIGKDD Explorations".17- 22
2. Model
Neural network models in artificial intelligence are usually referred to as artificial neural networks (ANNs); these are essentially simple mathematical models defining a function f: X + Y, but sometimes models are also intimately associated with a particular learning algorithm or learning rule. A common use of the phrase ANN model really means the definition of a class of such functions (where members of the class are obtained by varying parameters, connection weights, or specifics of the architecture such as the number of neurons or their connectivity.
2.1. Network Function
The word network in the term 'artificial neural network' refers to the inter–connections between the neurons in the different layers of each system. An example system has three layers. The first layer has input neurons which send data via synapses to the second layer of neurons, and then via more synapses to the third layer of output neurons. More complex systems will have more layers of neurons with some having increased layers of input neurons and output neurons. The synapses store parameters called "weights" that manipulate the data in the calculations.
An ANN is typically defined by three types of parameters:
The interconnection pattern between the different layers of neurons the learning process for updating the weights of the interconnections. The activation function that converts a neuron's weighted input to its output activation.
2.2. ANN Dependency Graph
The first view is the functional view: the input x is transformed into a 3-dimensional vector h, which is then transformed into a 2-dimensional vector g, which is finally transformed into f. This view is most commonly encountered in the context of optimization.
The second view is the probabilistic view: the random variable F = f(G) depends upon the random variable G = g(H), which depends upon H=h(X), which depends upon the random variable X. This view is most commonly encountered in the context of graphical models.
The two views are largely equivalent. In either case, for this particular network architecture, the components of individual layers are independent of each other (e.g., the components of g are independent of each other given their input h). This naturally enables a degree of parallelism in the implementation.
Two separate depictions of the recurrent ANN dependency graph Networks such as the previous one are commonly called feedforward, because their graph is a directed acyclic graph. Networks with cycles are commonly called recurrent. Such networks are commonly depicted in the manner shown at the top of the figure, where f is shown as being dependent upon itself. However, an implied temporal dependence is not shown.
2.3. Learning
What has attracted the most interest in neural networks is the possibility of learning. Given a specific task to solve, and a class of functions F, learning means using a set of observations to find f^{*} \in F which solves the task in some optimal sense.
This entails defining a cost function C: F {R} such that, for the optimal solution f^* + C (f^*) C(f) f in F – i.e., no solution has a cost less than the cost of the optimal solution (see Mathematical optimization The cost function C is an important concept in learning, as it is a measure of how far away a particular solution is from an optimal solution to the problem to be solved. Learning algorithms search through the solution space to find a function that has the smallest possible cost.
For applications where the solution is dependent on some data, the cost must necessarily be a function of the observations, otherwise we would not be modelling anything related to the data. It is frequently defined as a statistic to which only approximations can be made. When N some form of online machine learning must be used, where the cost is partially minimized as each new example is seen. While online machine learning is often used when {D} is fixed, it is most useful in the case where the distribution changes slowly over time. In neural network methods, some form of online machine learning is frequently used for finite datasets.
2.4. Choosing a Cost Function
While it is possible to define some arbitrary ad hoc cost function, frequently a particular cost will be used, either because it has desirable properties (such as convexity) or because it arises naturally from a particular formulation of the problem (e.g., in a probabilistic formulation the posterior probability of the model can be used as an inverse cost). Ultimately, the cost function will depend on the desired task. An overview of the three main categories of learning tasks is provided below:
2.5. Learning Paradigms
There are three major learning paradigms, each corresponding to a particular abstract learning task. These are supervised learning, unsupervised learning and reinforcement learning.
In other words, we wish to infer the mapping implied by the data; the cost function is related to the mismatch between our mapping and the data and it implicitly contains prior knowledge about the problem domain 80-95.
A commonly used cost is the mean-squared error, which tries to minimize the average squared error between the network's output, f(x), and the target value y over all the example pairs. When one tries to minimize this cost using gradient descent for the class of neural networks called multilayer perceptrons, one obtains the common and well-known backpropagation algorithm for training neural networks.
Tasks that fall within the paradigm of supervised learning are pattern recognition (also known as classification) and regression (also known as function approximation). The supervised learning paradigm is also applicable to sequential data (e.g., for speech and gesture recognition). This can be thought of as learning with a "teacher," in the form of a function that provides continuous feedback on the quality of solutions obtained thus far.
2.6. Unsupervised Learning
In unsupervised learning, some data x is given and the cost function to be minimized, that can be any function of the data x and the network's output, f.
The cost function is dependent on the task (what we are trying to model) and our a priori assumptions (the implicit properties of our model, its parameters and the observed variables.
As a trivial example, consider the model f(x) = a where a is a constant and the cost C=E[(x - f(x))^2]. Minimizing this cost will give us a value of that is equal to the mean of the data. The cost function can be much more complicated. Its form depends on the application: for example, in compression it could be related to the mutual information between x and f(x), whereas in statistical modeling, it could be related to the posterior probability of the model given the data. (Note that in both of those examples those quantities would be maximized rather than minimized).
Tasks that fall within the paradigm of unsupervised learning are in general estimation problems; the applications include clustering, the estimation of statistical distributions, compression and filtering.
2.7. Reinforcement Learning
In reinforcement learning, data x are usually not given, but generated by an agent's interactions with the environment. At each point in time t, the agent performs an action and the environment generates an observation and an instantaneous cost, according to some (usually unknown) dynamics. The aim is to discover a policy for selecting actions that minimizes some measure of a long-term cost; i.e., the expected cumulative cost. The environment's dynamics and the long-term cost for each policy are usually unknown, but can be estimated 96-121.
Tasks that fall within the paradigm of reinforcement learning are control problems, games and other sequential decision making tasks.
2.8. Learning Algorithms
Training a neural network model essentially means selecting one model from the set of allowed models (or, in a Bayesian framework, determining a distribution over the set of allowed models) that minimizes the cost criterion. There are numerous algorithms available for training neural network models; most of them can be viewed as a straightforward application of optimization theory and statistical estimation.
Most of the algorithms used in training artificial neural networks employ some form of gradient descent, using backpropagation to compute the actual gradients. This is done by simply taking the derivative of the cost function with respect to the network parameters and then changing those parameters in a gradient-related direction.
3. Process
Polls conducted in 2002, 2004, and 2007 show that the CRISP-DM methodology is the leading methodology used by data miners.15, 16, 17, 23-29 The only other data mining standard named in these polls was SEMMA. However, 3-4 times as many people reported using CRISP-DM. Several teams of researchers have published reviews of data mining process models18-32 and Azevedo and Santos conducted a comparison of CRISP-DM and SEMMA in 2008.20, 76-83, 89
3.1. Pre-Processing
Before data mining algorithms can be used, a target data set must be assembled. As data mining can only uncover patterns actually present in the data, the target data set must be large enough to contain these patterns while remaining concise enough to be mined within an acceptable time limit. A common source for data is a data mart or data warehouse. Pre-processing is essential to analyze the multivariate data sets before data mining. The target set is then cleaned. Data cleaning removes the observations containing noise and those with missing data.
3.2. Data Mining
Data mining involves six common classes of tasks:11
Anomaly detection (Outlier/change/deviation detection) – The identification of unusual data records, that might be interesting or data errors that require further investigation.
Association rule learning (Dependency modelling) – Searches for relationships between variables. For example a supermarket might gather data on customer purchasing habits. Using association rule learning, the supermarket can determine which products are frequently bought together and use this information for marketing purposes. This is sometimes referred to as market basket analysis.
Regression–attempts to find a function which models the data with the least error.
Summarization–providing a more compact representation of the data set, including visualization and report generation.
3.3. Results Validation
Data mining can unintentionally be misused, and can then produce results which appear to be significant; but which do not actually predict future behavior and cannot be reproduced on a new sample of data and bear little use. Often this results from investigating too many hypotheses and not performing proper statistical hypothesis testing. A simple version of this problem in machine learning is known as overfitting, but the same problem can arise at different phases of the process and thus a train/test split - when applicable at all - may not be sufficient to prevent this from happening.60-71
4. Clustering and Classification Methods
Clustering algorithms can be categorized based on their cluster model, as listed above. The following overview will only list the most prominent examples of clustering algorithms, as there are possibly over 100 published clustering algorithms. Not all provide models for their clusters and can thus not easily be categorized. An overview of algorithms explained in Wikipedia can be found in the list of statistics algorithms 122-143.
There is no objectively "correct" clustering algorithm, but as it was noted, "clustering is in the eye of the beholder.25-32The most appropriate clustering algorithm for a particular problem often needs to be chosen experimentally, unless there is a mathematical reason to prefer one cluster model over another. It should be noted that an algorithm that is designed for one kind of model has no chance on a data set that contains a radically different kind of model4, 5, 7 For example, k-means cannot find non-convex clusters25, 39, 43, 45, 58, 65
4.1. Connectivity Based Clustering
Connectivity based clustering, also known as hierarchical clustering, is based on the core idea of objects being more related to nearby objects than to objects farther away. These algorithms connect "objects" to form "clusters" based on their distance. A cluster can be described largely by the maximum distance needed to connect parts of the cluster. At different distances, different clusters will form, which can be represented using a dendrogram, which explains where the common name "hierarchical clustering" comes from: these algorithms do not provide a single partitioning of the data set, but instead provide an extensive hierarchy of clusters that merge with each other at certain distances. In a dendrogram, the y-axis marks the distance at which the clusters merge, while the objects are placed along the x-axis such that the clusters don't mix.
These methods will not produce a unique partitioning of the data set, but a hierarchy from which the user still needs to choose appropriate clusters. They are not very robust towards outliers, which will either show up as additional clusters or even cause other clusters to merge (known as "chaining phenomenon", in particular with single-linkage clustering). In the general case, the complexity is which makes them too slow for large data sets. For some special cases, optimal efficient methods (of complexity) are known: SLINK34 for single-linkage and CLINK 33, 49-59 for complete-linkage clustering. In the data mining community these methods are recognized as a theoretical foundation of cluster analysis, but often considered obsolete. They did however provide inspiration for many later methods such as density based clustering (figure 1).
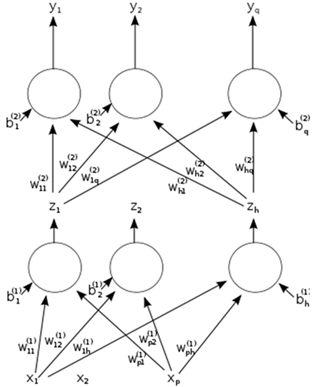
Figure 1. Single-linkage on density-based clusters.
20 clusters extracted, most of which contain single elements, since linkage clustering does not have a notion of "noise". Many people used this method on the different application.56, 72, 74, 78,-81
4.2. Centroid-Based Clustering
In centroid-based clustering, clusters are represented by a central vector, which may not necessarily be a member of the data set. When the number of clusters is fixed to k, k-means clustering gives a formal definition as an optimization problem: find the k cluster centers and assign the objects to the nearest cluster center, such that the squared distances from the cluster are minimized.34-39
The optimization problem itself is known to be NP-hard, and thus the common approach is to search only for approximate solutions. A particularly well known approximative method is Lloyd's algorithm7, 24- 27, 40-47 often actually referred to as "k-means algorithm". It does however only find a local optimum, and is commonly run multiple times with different random initializations. Variations of k-means often include such optimizations as choosing the best of multiple runs, but also restricting the centroids to members of the data set (k-medoids), choosing medians (k-medians clustering), choosing the initial centers less randomly (K-means++) or allowing a fuzzy cluster assignment (Fuzzy c-mean.
Most k-means-type algorithms require the number of clusters - k - to be specified in advance, which is considered to be one of the biggest drawbacks of these algorithms. Furthermore, the algorithms prefer clusters of approximately similar size, as they will always assign an object to the nearest centroid. This often leads to incorrectly cut borders in between of clusters (which is not surprising, as the algorithm optimized cluster centers, not cluster borders.
K-means has a number of interesting theoretical properties. On the one hand, it partitions the data space into a structure known as a Voronoi diagram. On the other hand, it is conceptually close to nearest neighbor classification, and as such is popular in machine learning. Third, it can be seen as a variation of model based classification, and Lloyd's algorithm as a variation of the Expectation-maximization algorithm for this model discussed below
4.3. Distribution-Based Clustering
The clustering model most closely related to statistics is based on distribution models. Clusters can then easily be defined as objects belonging most likely to the same distribution. A convenient property of this approach is that this closely resembles the way artificial data sets are generated: by sampling random objects from a distribution.
While the theoretical foundation of these methods is excellent, they suffer from one key problem known as overfitting, unless constraints are put on the model complexity. A more complex model will usually be able to explain the data better, which makes choosing the appropriate model complexity inherently difficult.
One prominent method is known as Gaussian mixture models (using the expectation-maximization algorithm). Here, the data set is usually modelled with a fixed (to avoid overfitting) number of Gaussian distributions that are initialized randomly and whose parameters are iteratively optimized to fit better to the data set. This will converge to a local optimum, so multiple runs may produce different results. In order to obtain a hard clustering, objects are often then assigned to the Gaussian distribution they most likely belong to; for soft clusterings, this is not necessary.
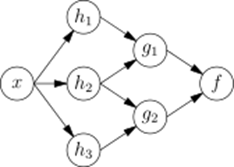
Figure 2. On Gaussian-distributed data, EM works well, since it uses Gaussians for modelling clusters.
Distribution-based clustering produces complex models for clusters that can capture correlation and dependence between attributes. However, these algorithms put an extra burden on the user: for many real data sets, there may be no concisely defined mathematical model (figure 2). Many people used this method on the different application 34- 40.
4.4. Density-Based Clustering
In density-based clustering 8, 41, 42, 43 clusters are defined as areas of higher density than the remainder of the data set. Objects in these sparse areas - that are required to separate clusters - are usually considered to be noise and border points.
The most popular9, 44-49 density based clustering method is DBSCAN.10 In contrast to many newer methods, it features a well-defined cluster model called "density-reachability". Similar to linkage based clustering,it is based on connecting points within certain distance thresholds. However, it only connects points that satisfy a density criterion, in the original variant defined as a minimum number of other objects within this radius. A cluster consists of all density-connected objects (which can form a cluster of an arbitrary shape, in contrast to many other methods) plus all objects that are within these objects' range. Another interesting property of DBSCAN is that its complexity is fairly low - it requires a linear number of range queries on the database - and that it will discover essentially the same results (it is deterministic for core and noise points, but not for border points) in each run, therefore there is no need to run it multiple times. OPTICS11, 50, 51 is a generalization of DBSCAN that removes the need to choose an appropriate value for the range parameter \varepsilon, and produces a hierarchical result related to that of linkage clustering. DeLi-Clu12, 52, 53 Density-Link-Clustering combines ideas from single-linkage clustering and OPTICS, eliminating the varepsilon parameter entirely and offering performance improvements over OPTICS by using an R-tree index.
The key drawback of DBSCAN and OPTICS is that they expect some kind of density drop to detect cluster borders. Moreover, they cannot detect intrinsic cluster structures which are prevalent in the majority of real life data. A variation of DBSCAN, EnDBSCAN13, 54, 55 efficiently detects such kinds of structures. On data sets with, for example, overlapping Gaussian distributions - a common use case in artificial data - the cluster borders produced by these algorithms will often look arbitrary, because the cluster density decreases continuously. On a data set consisting of mixtures of Gaussians, these algorithms are nearly always outperformed by methods such as EM clustering that are able to precisely model this kind of data.
Mean-shift is a clustering approach where each object is moved to the densest area in its vicinity, based on kernel density estimation. Eventually, objects converge to local maxima of density. Similar to k-means clustering, these "density attractors" can serve as representatives for the data set, but mean-shift can detect arbitrary-shaped clusters similar to DBSCAN. Due to the expensive iterative procedure and density estimation, mean-shift is usually slower than DBSCAN or k-Means (figure 3).
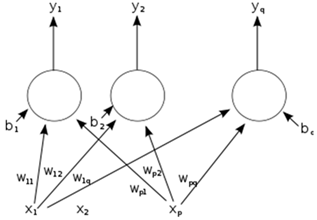
Figure 3. Density-based clustering for ANN.
5. Application
In business, data mining is the analysis of historical business activities, stored as static data in data warehouse databases. The goal is to reveal hidden patterns and trends. Data mining software uses advanced pattern recognition algorithms to sift through large amounts of data to assist in discovering previously unknown strategic business information. Examples of what businesses use data mining for include performing market analysis to identify new product bundles, finding the root cause of manufacturing problems, to prevent customer attrition and acquire new customers, cross-sell to existing customers, and profile customers with more accuracy 22, 44-51.
5.1. Science and Engineering
In recent years, data mining has been used widely in the areas of science and engineering, such as bioinformatics, genetics, medicine, education and electrical power engineering.
In the study of human genetics, sequence mining helps address the important goal of understanding the mapping relationship between the inter-individual variations in human DNA sequence and the variability in disease susceptibility. In simple terms, it aims to find out how the changes in an individual's DNA sequence affects the risks of developing common diseases such as cancer, which is of great importance to improving methods of diagnosing, preventing, and treating these diseases. One data mining method that is used to perform this task is known as multifactor dimensionality reduction.33
5.2. Human Rights
Data mining of government records – particularly records of the justice system (i.e., courts, prisons) – enables the discovery of systemic human rights violations in connection to generation and publication of invalid or fraudulent legal records by various government agencies.42, 43, 52-57
5.3. Medical Data Mining
In 2011, the case of Sorrell v. IMS Health, Inc., decided by the Supreme Court of the United States, ruled that pharmacies may share information with outside companies. This practice was authorized under the 1st Amendment of the Constitution, protecting the "freedom of speech."44 However, the passage of the Health Information Technology for Economic and Clinical Health Act (HITECH Act) helped to initiate the adoption of the electronic health record (EHR) and supporting technology in the United States.45 The HITECH Act was signed into law on February 17, 2009 as part of the American Recovery and Reinvestment Act (ARRA) and helped to open the door to medical data mining.46 Prior to the signing of this law, estimates of only 20% of United States based physician were utilizing electronic patient records.45SørenBrunak notes that "the patient record becomes as information-rich as possible" and thereby "maximizes the data mining opportunities."45 Hence, electronic patient records further expands the possibilities regarding medical data mining thereby opening the door to a vast source of medical data analysis.
5.4. Spatial Data Mining
Spatial data mining is the application of data mining methods to spatial data. The end objective of spatial data mining is to find patterns in data with respect to geography. So far, data mining and Geographic Information Systems (GIS) have existed as two separate technologies, each with its own methods, traditions, and approaches to visualization and data analysis. Particularly, most contemporary GIS have only very basic spatial analysis functionality. The immense explosion in geographically referenced data occasioned by developments in IT, digital mapping, remote sensing, and the global diffusion of GIS emphasizes the importance of developing data-driven inductive approaches to geographical analysis and modeling.81- 89
Data mining offers great potential benefits for GIS-based applied decision-making. Recently, the task of integrating these two technologies has become of critical importance, especially as various public and private sector organizations possessing huge databases with thematic and geographically referenced data begin to realize the huge potential of the information contained therein.
5.5. Sensor Data Mining
Wireless sensor networks can be used for facilitating the collection of data for spatial data mining for a variety of applications such as air pollution monitoring.50A characteristic of such networks is that nearby sensor nodes monitoring an environmental feature typically register similar values. This kind of data redundancy due to the spatial correlation between sensor observations inspires the techniques for in-network data aggregation and mining. By measuring the spatial correlation between data sampled by different sensors, a wide class of specialized algorithms can be developed to develop more efficient spatial data mining algorithms.51, 58- 62
5.6. Visual Data Mining
In the process of turning from analogical into digital, large data sets have been generated, collected, and stored discovering statistical patterns, trends and information which is hidden in data, in order to build predictive patterns. Studies suggest visual data mining is faster and much more intuitive than is traditional data mining.52, 53, 54 See also Computer vision.
5.7 Music Data Mining
Data mining techniques, and in particular co-occurrence analysis, has been used to discover relevant similarities among music corpora (radio lists, CD databases) for purposes including classifying music into genres in a more objective manner.55
5.8. Surveillance
Data mining has been used by the U.S. government. Programs include the Total Information Awareness (TIA) program, Secure Flight (formerly known as Computer-Assisted Passenger Prescreening System (CAPPS II)), Analysis, Dissemination, Visualization, Insight, Semantic Enhancement (ADVISE),56and the Multi-state Anti-Terrorism Information Exchange (MATRIX).57These programs have been discontinued due to controversy over whether they violate the 4th Amendment to the United States Constitution, although many programs that were formed under them continue to be funded by different organizations or under different names.58, 63-67
In the context of combating terrorism, two particularly plausible methods of data mining are "pattern mining" and "subject-based data mining".
5.9. Pattern Mining
In the context of pattern mining as a tool to identify terrorist activity, the National Research Council provides the following definition: "Pattern-based data mining looks for patterns (including anomalous data patterns) that might be associated with terrorist activity — these patterns might be regarded as small signals in a large ocean of noise.59, 60, 61Pattern Mining includes new areas such a Music Information Retrieval (MIR) where patterns seen both in the temporal and non-temporal domains are imported to classical knowledge discovery search methods.
5.10. Subject-Based Data Mining
In the context of combating terrorism, the National Research Council provides the following definition: "Subject-based data mining uses an initiating individual or other datum that is considered, based on other information, to be of high interest, and the goal is to determine what other persons or financial transactions or movements, etc., are related to that initiating datum.60
5.11. Knowledge Grid
Knowledge discovery "On the Grid" generally refers to conducting knowledge discovery in an open environment using grid computing concepts, allowing users to integrate data from various online data sources, as well make use of remote resources, for executing their data mining tasks. The earliest example was the Discovery Net,62, 63 developed at Imperial College London, which won the "Most Innovative Data-Intensive Application Award" at the ACM SC02 (Supercomputing 2002) conference and exhibition, based on a demonstration of a fully interactive distributed knowledge discovery application for a bioinformatics application 141-149. Other examples include work conducted by researchers at the University of Calabria, who developed a knowledge Grid architecture for distributed knowledge discovery, based on grid computing64, 65.
6. Privacy Concerns and Ethics
While the term "data mining" itself has no ethical implications, it is often associated with the mining of information in relation to peoples' behavior (ethical and otherwise) 66, 68, 69, 70, 71.
The ways in which data mining can be used can in some cases and contexts raise questions regarding privacy, legality, and ethics.67 In particular, data mining government or commercial data sets for national security or law enforcement purposes, such as in the Total Information Awareness Program or in ADVISE, has raised privacy concerns.68, 69-79
Data mining requires data preparation which can uncover information or patterns which may compromise confidentiality and privacy obligations. A common way for this to occur is through data aggregation. Data aggregation involves combining data together (possibly from various sources) in a way that facilitates analysis (but that also might make identification of private, individual-level data deducible or otherwise apparent).70, 77, 78, 79, 80this is not data mining per se, but a result of the preparation of data before – and for the purposes of – the analysis. The threat to an individual's privacy comes into play when the data, once compiled, cause the data miner, or anyone who has access to the newly compiled data set, to be able to identify specific individuals, especially when the data were originally anonymous.71, 72, 73
7. Conclusion
Artificial neural networks are generally presented as systems of interconnected "neurons" which can compute values from inputs, and are capable of machine learning as well as pattern recognition thanks to their adaptive nature. For example, a neural network for handwriting recognition is defined by a set of input neurons which may be activated by the pixels of an input image. After being weighted and transformed by a function (determined by the network's designer), the activations of these neurons are then passed on to other neurons. This process is repeated until finally, an output neuron is activated. This determines which character was read. We proposed a fuzzy ANN for Data Mining, which applied on several applications. Our results showed that our proposed method is better than current methods.
References
- K. G. Parthiban and S. Vijayachitra, Spike Detection from Electroencephalogram Signals with Aid of Hybrid Genetic Algorithm-ParticleSwarm Optimization, J. Med. Imaging Health Inf. 5, 936-944 (2015).
- I. Barwal and S. C. Yadav, Rebaudioside A Loaded Poly-D,L-Lactide-Nanoparticles as an Anti-Diabetic Nanomedicine, J. Bionanosci. 8, 137-140 (2014).
- M. A. Khanday and A. Najar, Maclaurin's Series Approach for the Analytical Solution of Oxygen Transport to the Biological Tissues Through Capillary Bed, J. Med. Imaging Health Inf. 5, 959-963 (2015).
- H. Huang and F. Yang, An Interpretation of Erlang into Value-passing Calculus, Journal of Networks, 8(7), 1504-1513 (2013).
- H. B. Kekre and T. K. Sarode, Vector Quantized Codebook Optimization Using Modified Genetic Algorithm, IETE Journal of Research, 56(5), 257-264 (2010).
- G. Nakamura, Y. Tanaka, Y. Niidome, and N. Nakashima, J. Nanci. Nanotol. 10, 3815 (2010).
- M. A. Randhawa, Nipp. Ishiin. Gakkai. Zasi. 49, 125 (2008).
- M. Gera, R. Kumar, V. K. Jain, Fabrication of a Pocket Friendly, Reusable Water Purifier Using Silver Nano Embedded Porous Concrete Pebbles Based on Green Technology, J. Bionanosci. 8, 10-15 (2014).
- M. S. Kumar and S. N. Devi, Sparse Code Shrinkage Based ECG De-Noising in Empirical Mode Decomposition Domain, J. Med. Imaging Health Inf. 5, 1053-1058 (2015).
- M. Mokhtari, H. Alinejad-Rokny, and H. Jalalifar, Selection of the Best Well Control System by Using Fuzzy Multiple-Attribute Decision-Making Methods. Journal of Applied Statistics 41, 1105 (2014).
- C. Zhou, Y. Li, Q. Zhang and B. Wang, An Improved Genetic Algorithm for DNA Motif Discovery with Gibbs Sampling Algorithm, J. Bionanosci. 8, 219-225 (2014).
- R. Bhadada and K. L. Sharma, Evaluation and Analysis of Buffer Requirements for Streamed Video Data in Video on Demand Applications, IETE Journal of Research, 56(5), 242-248 (2010).
- M. Kurhekar and U. Deshpande, Deterministic Modeling of Biological Systems with Geometry with an Application to Modeling of Intestinal Crypts, J. Med. Imaging Health Inf. 5, 1116-1120 (2015).
- S. Prabhadevi and Dr. A.M. Natarajan, A Comparative Study on Digital Signatures Based on Elliptic Curves in High Speed Ad Hoc Networks, Australian Journal of Basic and Applied Sciences, 8(2), 1-6 (2014).
- X. Jin and Y. Wang, Research on Social Network Structure and Public Opinions Dissemination of Micro-blog Based on Complex Network Analysis, Journal of Networks, 8(7), 1543-1550 (2013).
- R. Sathyavathi, M. B. Krishna, S. V. Rao, R. Saritha, and D. N. Rao, Adv. Sci. Lett. 3, 144 (2010).
- O. G. Avrunin, M. Alkhorayef, H. F. I. Saied, and M. Y. Tymkovych, The Surgical Navigation System with Optical Position Determination Technology and Sources of Errors, J. Med. Imaging Health Inf. 5, 689-696 (2015).
- R. Zhang, Y. Bai, C. Wang and W. Ma, Surfactant-Dispersed Multi-Walled Carbon Nanotubes: Interaction and Antibacterial Activity, J. Bionanosci. 8, 176-182 (2014).
- P. Mukherjee, R. Bhattacharya and D. Mukhopadhyay, J. Biomed. Nanotechnol. 1, 224 (2005).
- B. K. Singh, Generalized Semi-bent and Partially Bent Boolean Functions, Math. Sci. Lett. 3(1), 21-29 (2014).
- S. K. Singla and V. Singh, Design of a Microcontroller Based Temperature and Humidity Controller for Infant Incubator, J. Med. Imaging Health Inf. 5, 704-708 (2015).
- N. Barnthip and A. Muakngam, Preparation of Cellulose Acetate Nanofibers Containing Centella Asiatica Extract by Electrospinning Process as the Prototype of Wound-Healing Materials,J. Bionanosci. 8, 313-318 (2014).
- R. Jac Fredo, G. Kavitha and S. Ramakrishnan, Segmentation and Analysis of Corpus Callosum in Autistic MR Brain Images Using Reaction Diffusion Level Sets, J. Med. Imaging Health Inf. 5, 737-741 (2015).
- Wang, B. Zhu, An Improved Algorithm of the Node Localization in Ad Hoc Network, Journal of Networks, 9(3), 549-557 (2014).
- T. Buvaneswari and A. A. Iruthayaraj, Secure Discovery Scheme and Minimum Span Verification of Neighbor Locations in Mobile Ad-hoc Networks, Australian Journal of Basic and Applied Sciences, 8(2), 30-36 (2014).
- Y. Zhang, Z. Wang and Z. Hu, Nonlinear Electroencephalogram Analysis of Neural Mass Model, J. Med. Imaging Health Inf. 5, 783-788 (2015).
- S. Panwar and N. Nain, A Novel Segmentation Methodology for Cursive Handwritten Documents, IETE Journal of Research, 60(6), 432-439 (2014).
- E. Hasanzadeh, M. Poyan, and H. Alinejad-Rokny, Text Clustering on Latent Semantic Indexing with Particle Swarm Optimization (PSO) Algorithm, International Journal of Physical Sciences, 7, 116 (2012).
- H. Mao, On Applications of Matroids in Class-oriented Concept Lattices, Math. Sci. Lett. 3(1), 35-41 (2014).
- D. Kumar, K. Singh, V. Verma and H. S. Bhatti, Synthesis and Characterization of Carbon Quantum Dots from Orange Juice, J. Bionanosci. 8, 274-279 (2014).
- V. Kumutha and S. Palaniammal, Enhanced Validity for Fuzzy Clustering Using Microarray data, Australian Journal of Basic and Applied Sciences, 8(3), 7-15 (2014).
- Y. Wang, C. Yang and J. Yu, Visualization Study on Cardiac Mapping: Analysis of Isopotential Map and Isochron Map, J. Med. Imaging Health Inf. 5, 814-818 (2015).
- R. Su, Identification Method of Sports Throwing Force Based on Fuzzy Neural Network, Journal of Networks, 8(7), 1574-1581 (2013).
- J. Davda and V. Labhasetwar, J. Biomed. Nanotechnol. 1, 74 (2005).
- L. Feng, W. Zhiqi and L. Ming, The Auto-Detection and Diagnose of the Mobile Electrocardiogram, J. Med. Imaging Health Inf. 5, 841-847 (2015).
- D. Deepa, C. Poongodi, A. Bharathi, Satellite Image Enhancement using Discrete Wavelet Transform and Morphological Filtering for Remote Monitoring, Australian Journal of Basic and Applied Sciences, 8(3), 27-34, (2014).
- R. Sarma, J. M. Rao and S. S. Rao, Fixed Point Theorems in Dislocated Quasi-Metric Spaces, Math. Sci. Lett. 3(1), 49-52 (2014).
- T.Gopalakrishnan and P. Sengottvelan, Discovering user profiles for web personalization using EM with Bayesian Classification, Australian Journal of Basic and Applied Sciences, 8(3), 53-60 (2014).
- H. Jianfeng, M. Zhendong and W. Ping, Multi-Feature Authentication System Based on Event Evoked Electroencephalogram, J. Med. Imaging Health Inf. 5, 862-870 (2015).
- R. Kumar and I. Saini, Empirical Wavelet Transform Based ECG Signal Compression, IETE Journal of Research, 60(6), 423-431 (2014).
- N. Shukla, P. Varma and M. S. Tiwari,Kinetic Alfven wave in the presence of parallel electric field with general loss-cone distribution function: A kinetic approach, International Journal of Physical Sciences, 7(6), 893-900 (2012).
- F. Siddiqui, Gigabit Wireless Networking with IEEE 802.11ac: Technical Overview and Challenges, Journal of Networks, 10(3), 164-171 (2015).
- M. Rahimi, S. Kilaru, G. E. H. Sleiman, A. Saleh, D. Rudkevich, and K. Nguyen, J. Biomed. Nanotechnol. 4, 482 (2008).
- N. Gedik, Breast Cancer Diagnosis System via Contourlet Transform with Sharp Frequency Localization and Least Squares Support Vector Machines, J. Med. Imaging Health Inf. 5, 497-505 (2015).
- R. Bruck, H. Aeed, H. Shirin, Z. Matas, L. Zaidel, Y. Avni, and Z. Halpern, J. Hepatol. 31, 27 (1999).
- N. Lalithamani and M. Sabrigiriraj , Dual Encryption Algorithm to Improve Security in Hand Vein and Palm Vein-Based Biometric Recognition, J. Med. Imaging Health Inf. 5, 545-551 (2015).
- M. Khan and R. Jehangir,Fuzzy resolvability modulo fuzzy ideals, International Journal of the Physical Sciences, 7(6), 953- 956 (2012).
- M. Ravichandran and A.Shanmugam, Amalgamation of Opportunistic Subspace & Estimated Clustering on High Dimensional Data, Australian Journal of Basic and Applied Sciences, 8(3), 88-97, (2014).
- M. Zhang, Optimization of Inter-network Bandwidth Resources for Large-Scale Data Transmission, Journal of Networks, 9(3), 689-694 (2014).
- O. O. E. Ajibola, O. Ibidapo-Obe, and V. O. S. OIunloyo, A Model for the Management of Gait Syndrome in Huntington's Disease Patient, J. Bioinf. Intell. Control, 3, 15-22 (2014).
- L. Z. Pei, T. Wei, N. Lin and Z. Y. Cai, Electrochemical Sensing of Histidine Based on the Copper Germanate Nanowires Modified Electrode, J. Bionanosci. 9, 161-165 (2015).
- M. K. Elboree, Explicit Analytic Solution for the Nonlinear Evolution Equations using the Simplest Equation Method, Math. Sci. Lett. 3(1), 59-63 (2014).
- R. Yousef and T. Almarabeh, An enhanced requirements elicitation framework based on business process models, Scientific Research and Essays, 10(7), 279-286 (2015).
- K. Manimekalai and M.S. Vijaya, Taxonomic Classification of Plant Species Using Support Vector Machine, J. Bioinf. Intell. Control 3, 65-71 (2014).
- S. Rajalaxmi and S. Nirmala, Automated Endo Fitting Curve for Initialization of Segmentation Based on Chan Vese Model, J. Med. Imaging Health Inf. 5, 572-580 (2015).
- T. Mahmood and K. Hayat, Characterizations of Hemi-Rings by their Bipolar-Valued Fuzzy h-Ideals, Inf. Sci. Lett. 4(2), 51-59 (2015).
- Agarwal and N. Mittal, Semantic Feature Clustering for Sentiment Analysis of English Reviews, IETE Journal of Research, 60(6), 414-422 (2014).
- S. Radharani and M. L.Valarmathi, Content Based Watermarking Techniques using HSV and Fractal Dimension in Transform Domain, Australian Journal of Basic and Applied Sciences, 8(3), 112-119 (2014).
- H. W. and W. Wang, An Improved Artificial Bee Colony Algorithm and Its Application on Production Scheduling, J. Bioinf. Intell. Control, 3, 153-159 (2014).
- H. Alinejad Rokny, M.M. Pedram, and H. Shirgahi,Discovered motifs with using parallel Mprefixspan method. Scientific Research and Essays 6, 4220 (2011).
- L. Gupta,Effect of orientation of lunar apse on earthquakes, International Journal of the Physical Sciences, 7(6), 974-981 (2012).
- S. Iftikhar, F. Ahmad and K. Fatima, A Semantic Methodology for Customized Healthcare Information Provision, Inf. Sci. Lett. 1(1), 49-59 (2012).
- P. D. Sia, Analytical Nano-Modelling for Neuroscience and Cognitive Science, J. Bioinf. Intell. Control 3, 268-272 (2014).
- G. Cengiz, Production of particleboards from licorice (Glycyrrhiza glabra) and European black pine (Pinus Nigra Arnold) wood particles, Scientific Research and Essays, 10(7), 273-278 (2015).
- Z. Chen and J. Hu, Learning Algorithm of Neural Networks on Spherical Cap, Journal of Networks, 10(3), 152-158 (2015).
- W. Lu, Parameters of Network Traffic Prediction Model Jointly Optimized by Genetic Algorithm, Journal of Networks, 9(3), 695-702 (2014).
- K. Boubaker,An attempt to solve neutron transport equation inside supercritical water nuclear reactors using the Boubaker Polynomials Expansion Scheme, International Journal of the Physical Sciences, 7(19), 2730-2734 (2012).
- K. Abd-Rabou, Fixed Point Results in G-Metric Space, Math. Sci. Lett. 3(3), 141-146 (2014).
- Binu and M. Selvi, BFC: Bat Algorithm Based Fuzzy Classifier for Medical Data Classification, J. Med. Imaging Health Inf. 5, 599-606 (2015).
- C. Kamath, Analysis of Electroencephalogram Background Activity in Epileptic Patients and Healthy Subjects Using Dispersion Entropy, J. Neurosci. Neuroeng. 3, 101-110 (2014).
- G. Kaur and E. M. Bharti, Securing Multimedia on Hybrid Architecture with Extended Role-Based Access Control, J. Bioinf. Intell. Control 3, 229-233 (2014).
- M. Ramalingam and D. Rana, Impact of Nanotechnology in Induced Pluripotent Stem Cells-driven Tissue Engineering and Regenerative Medicine, J. Bionanosci. 9, 13-21 (2015).
- R. Javanmard, K. Jeddisaravi, and H. Alinejad-Rokny, Proposed a New Method for Rules Extraction Using Artificial Neural Network and Artificial Immune System in Cancer Diagnosis. Journal of Bionanoscience 7, 665 (2013).
- S. Downes, New Technology Supporting Informal Learning, Journal of Emerging Technologies in Web Intelligence, 2(1), 27-33 (2010).
- R. Periyasamy, T. K. Gandhi, S. R. Das, A. C. Ammini and S. Anand, A Screening Computational Tool for Detection of Diabetic Neuropathy and Non-Neuropathy in Type-2 Diabetes Subjects, J. Med. Imaging Health Inf. 2, 222-229 (2012).
- Y. Qin, F. Wang and C. Zhou, A Distributed UWB-based Localization System in Underground Mines, Journal of Networks, 10(3), 134-140 (2015).
- P. Saxena and C. Ghosh,A review of assessment of benzene, toluene, ethylbenzene and xylene (BTEX) concentration in urban atmosphere of Delhi, International Journal of the Physical Sciences, 7(6), 850-860 (2012).
- J. Hu, Z. Zhou and M. Teng, The Spatiotemporal Variation of Ecological Risk in the Lijiang River Basin Based on Land Use Change, J. Bionanosci. 9, 153-160 (2015).
- N. Saleem, M. Ahmad, S. A. Wani, R. Vashnavi and Z. A. Dar,Genotype-environment interaction and stability analysis in Wheat (Triticum aestivum L.) for protein and gluten contents, Scientific Research and Essays, 10(7), 260-265 (2015).
- R. A. Rashwan and S. M. Saleh, A Coupled Fixed Point Theorem for Three Pairs of w-Compatible Mappings in G-metric spaces, Math. Sci. Lett. 3(1), 17-20 (2014).
- S. P. Singh and B. K. Konwar, Carbon Nanotube Assisted Drug Delivery of the Anti-Malarial Drug Artemesinin and Its Derivatives-A Theoretical Nanotechnology Approach, J. Bionanosci. 7, 630-636 (2013).
- R. Dinasarapu and S. Gupta, Biological Data Integration and Dissemination on Semantic Web-A Perspective, J. Bioinf. Intell. Control 3, 273-277 (2014).
- W. Qiaonong, X. Shuang, and W. Suiren, Sparse Regularized Biomedical Image Deconvolution Method Based on Dictionary Learning, J. Bionanosci. 9, 145-152 (2015).
- C. Prema and D. Manimegalai, Adaptive Color Image Steganography Using Intra Color Pixel Value Differencing, Australian Journal of Basic and Applied Sciences, 8(3), 161-167 (2014).
- R. Adollah, M. Y. Mashor, H. Rosline, and N. H. Harun, Multilevel Thresholding as a Simple Segmentation Technique in Acute Leukemia Images, J. Med. Imaging Health Inf. 2, 285-288 (2012).
- H. Uppili, Proton-Induced Synaptic Transistors: Simulation and Experimental Study, J. Neurosci. Neuroeng. 3, 117-129 (2014).
- Di Salvo,Deep inelastic processes and the equations of motion,International Journal of Physical Sciences, 7(6), 867-892 (2012).
- H. Alinejad-Rokny, Proposing on Optimized Homolographic Motif Mining Strategy based on Parallel Computing for Complex Biological Networks, Journal of Medical Imaging and Health Informatics, 7, (2015).
- A. M. Arafa, S. Z. Rida and H. Mohamed, An Application of the Homotopy Analysis Method to the Transient Behavior of a Biochemical Reaction Model, Inf. Sci. Lett. 3(1), 29-33 (2014).
- V. M. Somsikov, A. B. Andreyev and A. I. Mokhnatkin,Relation between classical mechanics and physics of condensed medium, International Journal of Physical Sciences, 10(3), 112-122 (2015).
- C. Krishnamoorthy, K. Rajamani, S. Mekala and S. Rameshkumar,Fertigation through trickle and micro sprinkler on flowering characters in cocoa (Theobroma cacao L.), Scientific Research and Essays, 10(7), 266-272 (2015).
- J. Peng, A New Model of Data Protection on Cloud Storage, Journal of Networks, 9(3), 666-671 (2014).
- S. Nageswari and V. Suresh Kumar, VCMIPWM Scheme to Reduce the Neutral-Point Voltage Variations in Three-Level NPC Inverter, IETE Journal of Research, 60(6),396-405 (2014).
- X. Ochoa, Connexions: A Social and Successful Anomaly among Learning Object Repositories, Journal of Emerging Technologies in Web Intelligence, 2(1), 11-22 (2010).
- K. V. Balakin, Y. A. Ivanenkov, A. V. Skorenko, Y. V. Nikolsky, N. P. Savchuk, and A. A. Ivashchenko, J. Biomol. Screen 9, 22 (2004).
- Y.S. Chiu, What Can Signed Languages Tell Us About Brain?, J. Neurosci. Neuroeng. 1, 54-60 (2012).
- K. Rezgui, H. Mhiri and K. Ghédira, Theoretical Formulas of Semantic Measure: A Survey, Journal of Emerging Technologies in Web Intelligence, 5(4), 333-342 (2013).
- K. Parwez and S. V. Budihal, Carbon Nanotubes Reinforced Hydroxyapatite Composite for Biomedical Application, J. Bionanosci. 8, 61-65 (2014).
- H. El-Owaidy, A. Abdeldaim and A. A. El-Deeb, On Some New Retarded Nonlinear Integral Inequalities and Their Applications, Math. Sci. Lett. 3(3), 157-164 (2014).
- H. Zheng, J. Jie and Y. Zheng, Multi-Swarm Chaotic Particle Swarm Optimization for Protein Folding, J. Bionanosci. 7, 643-648 (2013).
- S. V. Sathyanarayana and K. N. Hari Bhat, Novel Scheme for Storage and Transmission of Medical Images with Patient Information Using Elliptic Curve Based Image Encryption Schemes with LSB Based Steganographic Technique, J. Med. Imaging Health Inf. 2, 15-24 (2012).
- Satyendra Sharma and Brahmjit Singh, Field Measurements for Cellular Network Planning, J. Bioinf. Intell. Control 2, 112-118 (2013).
- Y. Wang, An Approximate Algorithm for TSP with Four Vertices and Three Lines Inequality, Inf. Sci. Lett. 3(2), 41-44 (2014).
- S. P. Singh and B. K. Konwar, Insilico Proteomics and Genomics Studies on ThyX of Mycobacterium Tuberculosis, J. Bioinf. Intell. Control 2, 11-18 (2013).
- K. Kumar, A. K. Verma and R. B. Patel, Framework for Key Management Scheme in Heterogeneous Wireless Sensor Networks, Journal of Emerging Technologies in Web Intelligence, 3(4), 286-296 (2011).
- R. Bruck, H. Aeed, H. Shirin, Z. Matas, L. Zaidel, Y. Avni, and Z. Halpern, J. Hepatol. 31, 27 (1999).
- Alinejad-Rokny, A Method to Avoid Gapped Sequential Patterns in Biological Sequences: Case Study: HIV
and Cancer Sequences, Journal of Neuroscience and Neuroengineering, 4, (2015). - V. Gupta, A Survey of Text Summarizers for Indian Languages and Comparison of their Performance, Journal of Emerging Technologies in Web Intelligence, 5(4), 361-366 (2013).
- M. Kaczmarek, A. Bujnowski, J. Wtorek, and A. Polinski, Multimodal Platform for Continuous Monitoring of the Elderly and Disabled, J. Med. Imaging Health Inf. 2, 56-63 (2012).
- H. Chemani, Correlation between milling time, particle size for stabilizing rheological parameters of clay suspensions in ceramic tiles manufacture, International Journal of Physical Sciences, 10(1), 46-53 (2015).
- S. Nadeem and S. Saleem, Theoretical Investigation of MHD Nanofluid Flow Over a Rotating Cone: An Optimal Solutions, Inf. Sci. Lett. 3(2), 55-62 (2014).
- M. Zamoum, M. Kessal,Analysis of cavitating flow through a venture, Scientific Research and Essays, 10(11), 383-391 (2015).
- H. Morad, GPS Talking For Blind People, Journal of Emerging Technologies in Web Intelligence, 2(3), 239-243 (2010).
- M. MirnabiBaboli, S. RashidiBajgan, and H. Alinejad-Rokny,Inf. Sci. Lett. 4, 1 (2015).
- Deepak Rawtani and Y. K. Agrawal, Study the Interaction of DNA with Halloysite Nanotube-Gold Nanoparticle Based Composite, J. Bionanosci. 6, 95-98 (2012).
- V. Karthick and K. Ramanathan, Investigation of Peramivir-Resistant R292K Mutation in A (H1N9) Influenza Virus by Molecular Dynamics Simulation Approach, J. Bioinf. Intell. Control 2, 29-33 (2013).
- M. Colucci, F. Maione, M. C. Bonito, A. Piscopo, A. Di Giannuario, and S. Pieretti, Pharmacol Res.(2008).
- R. Uthayakumar and A. Gowrisankar, Generalized Fractal Dimensions in Image Thresholding Technique, Inf. Sci. Lett. 3(3), 125-134 (2014).
- B. Ould Bilal, D. Nourou, C. M. F Kébé, V. Sambou, P. A. Ndiaye and M. Ndongo,Multi-objective optimization of hybrid PV/wind/diesel/battery systems for decentralized application by minimizing the levelized cost of energy and the CO2 emissions, International Journal of Physical Sciences, 10(5), 192-203 (2015).
- A. Maqbool, H. U. Dar, M. Ahmad, G. N. Malik, G. Zaffar, S. A. Mir and M. A. Mir, Comparative performance of some bivoltine silkworm (Bombyx mori L.) genotypes during different seasons, Scientific Research and Essays, 10(12), 407-410 (2015).
- MN. Seyedaghaee, S. Amirgholipour, H. Alinejad-Rokny and F. Rouhi, Strategic Planning Formulation by Using Reinforcement Learning, Research Journal of Applied Sciences, Engineering and Technology, 4(11), 1448-1454 (2012).
- S. Y. Li, C. Chen, H. Q. Zhang, H. Y. Guo, H. Wang, L. Wang, X. Zhang, S. N. Hua, J. Yu, P. G. Xiao, R. S. Li, and X. Tan, Antiviral. Res. 67, 18 (2005).
- R. B. Little,A theory of the relativistic fermionic spinrevorbital, International Journal of Physical Sciences, 10(1), 1-37 (2015).
- Z. Chen, F. Wang and Li Zhu, The Effects of Hypoxia on Uptake of Positively Charged Nanoparticles by Tumor Cells, J. Bionanosci. 7, 601-605 (2013).
- A.Kaur and V. Gupta, A Survey on Sentiment Analysis and Opinion Mining Techniques, Journal of Emerging Technologies in Web Intelligence, 5(4), 367-371 (2013).
- P. Saxena and M. Agarwal, Finite Element Analysis of Convective Flow through Porous Medium with Variable Suction, Inf. Sci. Lett. 3(3), 97-101 (2014).
- J. G. Bruno, Electrophoretic Characterization of DNA Oligonucleotide-PAMAM Dendrimer Covalent and Noncovalent Conjugates, J. Bionanosci. 9, 203-208 (2015).
- K. K. Tanaeva, Yu. V. Dobryakova, and V. A. Dubynin, Maternal Behavior: A Novel Experimental Approach and Detailed Statistical Analysis, J. Neurosci. Neuroeng. 3, 52-61 (2014).
- Zaitseva and M. Rusin, Healthcare System Representation and Estimation Based on Viewpoint of Reliability Analysis, J. Med. Imaging Health Inf. 2, 80-86 (2012).
- R. Ahirwar, P. Devi and R. Gupta, Seasonal incidence of major insect-pests and their biocontrol agents of soybean crop (Glycine max L. Merrill), Scientific Research and Essays, 10(12), 402-406 (2015).
- Boussak, H. Chemani and A. Serier,Characterization of porcelain tableware formulation containing bentonite clay, International Journal of Physical Sciences, 10(1), 38-45 (2015).
- L. Esmaeili, B. Minaei-Bidgoli and H. Alinejad-Rokny, A Hybrid Recommender System for Joining Virtual Communities, Research Journal of Applied Sciences Engineering and Technology, 4(5), 500-509 (2012).
- Q. Xiaohong, and Q. Xiaohui, An Evolutionary Particle Swarm Optimizer Based on Fractal Brownian Motion. Journal of Computational Intelligence and Electronic Systems, 1, 138 (2012).
- Minhas and M. Kumar, LSI Based Relevance Computation for Topical Web Crawler, Journal of Emerging Technologies in Web Intelligence, 5(4), 401-406 (2013).
- H. Alinejad-Rokny, H. Pourshaban, A. Goran, M. MirnabiBaboli,Network Motifs Detection Strategies and Using for Bioinformatic Networks, Journal of Bionanoscience, 8, 353 (2014).
- Y. Shang, Efficient strategies for attack via partial information in scale-free networks, Inf. Sci. Lett. 1(1), 1-5 (2012).
- M. Ahmadinia, H. Alinejad-Rokny, and H. Ahangarikiasari, Journal of Networks 9(10), 2567-2573 (2014).
- I.Rathore and J. C. Tarafdar, Perspectives of Biosynthesized Magnesium Nanoparticles in Foliar Application of Wheat Plant.J. Bionanosci. 9, 209-214 (2015).
- Hui Yan and Haiyan Hu, Research and Realization of ISIC-CDIO Teaching Experimental System Based on RFID Technology of Web of Things, J. Bionanosci. 7, 696-702 (2013).
- R. Teles, B. Barroso, A. Guimaraes and H. Macedo, Automatic Generation of Human-like Route Descriptions: A Corpus-driven Approach, Journal of Emerging Technologies in Web Intelligence, 5(4), 413-423 (2013).
- E. S. Hui, Diffusion Magnetic Resonance Imaging of Ischemic Stroke, J. Neurosci. Neuroeng. 1, 48-53 (2012).
- O. E. Emam, M. El-Araby and M. A. Belal, On Rough Multi-Level Linear Programming Problem, Inf. Sci. Lett. 4(1), 41-49 (2015).
- B. Prasad, D.C. Dimri and L. Bora,Effect of pre-harvest foliar spray of calcium and potassium on fruit quality of Pear cv. Pathernakh, Scientific Research and Essays, 10(11), 392-396 (2015).
- L. Xu, A. Y. Hui, E. Albanis, M. J. Arthur, S. M. O'Byrne, W. S. Blaner, P. Mukherjee, S. L. Friedman, and F. J. Eng, Gut. 54, 142 (2005).
- H. Parvin, H. Alinejad-Rokny and M. Asadi, An Ensemble Based Approach for Feature Selection, Australian Journal of Basic and Applied Sciences Research, 7(9), 33-43 (2011).
- G. Singh, Optimization of Spectrum Management Issues for Cognitive Radio, Journal of Emerging Technologies in Web Intelligence, 3(4), 263-267 (2011).
- D. Madhuri, Linear Fractional Time Minimizing Transportation Problem with Impurities, Inf. Sci. Lett. 1(1), 7-19 (2012).
- A. D. Dele,Oscilating magnetic field an anti-malaria therapy, International Journal of Physical Sciences, 10(10), 329-334 (2015).
- Mayevsky, J. Sonn and E. Barbiro-Michaely, Physiological Mapping of Brain Functions In Vivo: Surface Monitoring of Hemodynamic Metabolic Ionic and Electrical Activities in Real-Time, J. Neurosci. Neuroeng. 2, 150-177 (2013).


