
Journal of Nanoscience and Nanoengineering, Vol. 1, No. 2, August 2015 Publish Date: Jul. 20, 2015 Pages: 18-22
Surface Statistical Topographical Properties of ZnO:N Thin Films Deposited by MOCVD
U. S. Mbamara1, *, B. Olofinjana2, C. Lorenzo-Martin3, O. O. Ajayi3, E. I. Obiajunwa4, E. O. B. Ajayi2
1Department of Physics, Federal University of Technology, Owerri, Nigeria
2Department of Physics, Obafemi Awolowo University, Ile-Ife, Nigeria
3Tribology Section, Argonne National Laboratory, Argonne, IL, USA
4Centre for Energy Research and Development, Obafemi Awolowo University, Ile-Ife, Nigeria
Abstract
The surface statistical properties of ZnO:N thin films deposited by metalorganic chemical vapour deposition (MOCVD) with different precursor dopant mixtures were investigated. The precursor was of single solid-sources, consisting of physical mixtures of zinc acetate and ammonium acetate in four separate ratios of 9:1, 8:2, 7:3 and 6:4 respectively. The examination of the thin films was carried out by Rutherford Backscattering Spectroscopy (RBS), Optical Microscopy and Optical Profilometry techniques. The thin film compositions gave a consistent Zn:O:N stoichiometry of 5:4:1, despite the varied precursor compositions used in preparing them. Their surfaces exhibited properties which are likely to support visible light attenuation in fibre optics, photoconductivity, electron transport, gas sensing and load-bearing capabilities. The key statistical parameters, Ra, Rq, Rt, Rz, Sq/Sa, Ssk and Sku, showed trends with respect to the precursor dopant concentrations. The fractal dimensions calculated also exhibited some trend. The values of Rq/Ra and Sq/Sa closely depicted Gaussian distribution of asperities on the surfaces, with the values also predicting useful applications in tribology.
Keywords
MOCVD, Zinc Acetate-Ammonium Acetate Precursors, Nitrogen-Doped Zinc Oxide Thin Films, Surface Colours, Surface Topographies
Received: May 27, 2015
Accepted: June 19, 2015
Published online: July 16, 2015
@ 2015 The Authors. Published by American Institute of Science. This Open Access article is under the CC BY-NC license. http://creativecommons.org/licenses/by-nc/4.0/
1. Introduction
Zinc oxide is a widely used material in diverse fields, and its use continues to expand, particularly in the frontiers of technological applications. Doped zinc oxide thin films in particular are being consistently explored, synthesized and characterized for even wider and targeted applications [1]. Despite its very familiar properties, the morphology and topography of the thin film surface substantially depict the piezoelectric, spintronic, tribological and gas-sensing properties of the material [2-4]. As a matter of fact the study of the surface topography of thin films has not been deeply delved into as at today; hence the exploitation of its benefits in emerging technologies are still empirical.
Several methods exist for deposition of thin films [5]. Such methods are often broadly classified as physical, chemical and sputtering methods, and their sub-classifications. But the deposition technique used will largely depend on the availability of set ups, forms of precursor or input materials, relative advantages of the method over others, and the envisaged influence of the deposition technique on the properties of the thin films produced. In the present work, the method of metalorganic chemical vapour deposition, MOCVD, under chemical deposition (and chemical vapour deposition, CVD, sub-) methods was used. This is because of its cheapness, simplicity, ease of replication and ability to produce high profile and epitaxial thin films.
The work involved the synthesis of nitrogen-doped zinc oxide thin films using different ratios of a precursor mixture consisting of zinc acetate and ammonium acetate. The elemental components of the thin films were subsequently identified, their surface topographies extensively analyzed to define their properties, and their applicabilities inferred.
2. Experimental Procedure
Precursor mixtures comprising zinc acetate and ammonium acetate were produced in four ratios of 9:1, 8:2, 7:3 and 6:4 by weight of the zinc acetate and ammonium acetate components respectively. The precursor mixtures were in turn used to deposit nitrogen-doped zinc oxide thin films on soda lime glass and AISI304L stainless steel substrates by MOCVD process. The deposition temperature was 420ºC at atmospheric pressure; compressed air was used as the carrier gas for each precursor at a flow rate of 2.5 dm3min-1, and the deposition time was 2 hours for the precursor involved. The thin films produced with the precursor mixtures were thereafter designated as X1, X2, X3 and X4 respectively.
The thin films deposited on glass substrate were used for the investigation of the elemental compositions of the thin films by Rutherford Backscattering Spectroscopy (RBS). The thin films on stainless steel substrates were used to investigate their surface profiles. The RBS measurements involved the use of a 1.7 MeV Tandem Accelerator to determine the elemental composition of the thin films. The surface profiles were investigated with Olympus BH-2 Optical Microscope and ADE Phase Shift MicroXam Optical Surface Profiler in both 2D and 3D phases.
3. Results and discussion
3.1. Results
The RBS examinations revealed the presence of the elements Zn, O and N, and with an approximately consistent Zn:O:N ratio of 5:4:1 for the thin films, despite the different dopant percentages of the precursors used.
The optical microscopy images of the thin films are shown in Fig. 1. Figure 2 shows the optical profilometry images in 2 dimensions (2D), while Fig. 3 shows the profilometry images in 3 dimensions (3D). The images in Figs. 1 and 3 show some characteristic colours for the thin film surfaces. The profilometry measurements also gave the statistical parameters of the film surfaces, including the average roughness (Ra, Sa), root mean square (rms) roughness (Rq, Sq), (ten-point) valley-to-peak height (Rz, Sz), (ten-point) peak-to-valley (pit) height (Rt, St), skewness of the contour (Rsk, Ssk), and the kurtosis (Rku, Sku).
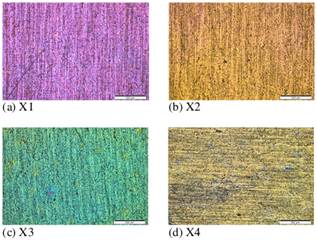
Figure 1. Optical microscopy image of the thin films, exhibiting characteristic colours in response to the probing light.
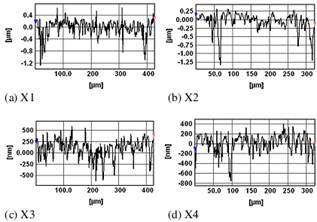
Figure 2. Optical profilometry images of the thin films in 2D, clearly depicting the contour heights and valleys (pits).
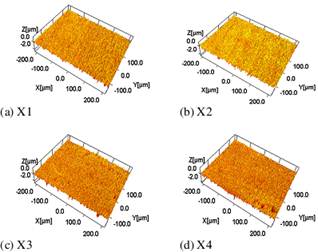
Figure 3. Optical profilometry images of the thin films in 3D, exhibiting characteristic colours in response to the probing light.
The precursor compositions, thin film surface colours and their statistical roughness parameters are shown in Table 1.
3.2. Discussion
The constancy of the elemental ratios in all the thin films suggests a threshold of combination values which were reached in all the samples during the film deposition, notwithstanding the different dopant concentrations in their precursors. Ordinarily the combination ratio of ZnO is 1:1; thus the combination ratio of 5:4:1 in ZnO:N suggests a usual combination ratio of 5:5 for ZnO, but in which only one of the atoms of oxygen in five could be replaced by a nitrogen atom to effect the nitrogen doping. A combination with a very minimal (minority) doping with nitrogen is very likely to require the dopant concentration in the precursor to be much smaller than the ratios used in this work.
The colours of the sample surfaces were indicative of their optical attenuation properties in the visible spectrum [6]. Each one could hence be used as a selective optical filter, say in optical fibres, based on its peculiar colour irradiance.
The surface roughness values Ra, Sa, Rq and Sq of the thin films show that they were polycrystalline, as they are relatively high. This condition was possibly patterned by desirable nanostructures of the surfaces vis-à-vis the surface (defect) states, and will likely support gas detection, photoconductivity and electric transport properties. The roughness states are also envisaged to enhance the film reflectivities, scattering and tribological capabilities. The Rq and Sq values in particular are most relevant here, since they highlight the statistical differences involved in Rz, Rt and Sz, St more realistically than the Ra and Sa values respectively. Of course the Rq and Sq values were also involved in the determination of the other key statistical parameters of Rsk, Rku and Ssk, Sku respectively [7-9]. Rz and Rt or Sz and St values are respectively similar because they were defined here to mean the same thing in two different ways (height and pit), although other definition choices do exist [8,9].
That all the Rsk and Ssk values obtained were negative indicate that the thin film surfaces possess good load-bearing capacity. On the other hand, the values of Rku and Sku obtained are all >3, and this shows that spiky asperity, which is prerequisite for a good gas sensing surface, is predominant in the samples. The doped thin films should therefore serve effectively as good tribological coatings as well as good gas sensing elements [8-12].
The ratios Rq/Ra and Sq/Sa were calculated and incorporated into Table 1. Either ratio has some vital relevance in the topological description of a surface. For one, a Gaussian distribution of asperity height requires that such a ratio should have a value of 1.25, while some other specification
requires the Gaussian distribution of a good tribological surface to have the ratio up to a value of 1.31 [13,14]. With the values of either ratio obtained for the thin films being equal to or close to these values, it becomes more substantiated that the thin films should be very tribologically relevant, say in either ‘touch’ electronics or other mechanical set ups that may incorporate them, together with their confirmation as prospective gas sensors.
Table 1. Precursor Compositions, Colours and Statistical Parameters of the Thin Film Surfaces.
| Properties | X1 | X2 | X3 | X4 | |
| Precursor dopant level | 10% | 20% | 30% | 40% | |
| Surface colour | Microscopy | Purple | Apricot | Green | Yellow |
| Profilometry | Apricot | Yellow | Apricot | Apricot | |
| 2D | Ra (nm) | 203.949 | 164.142 | 145.762 | 121.917 |
| Rq (nm) | 284.357 | 207.182 | 185.379 | 155.969 | |
| Rq/Ra | 1.39 | 1.26 | 1.27 | 1.28 | |
| Rt (nm) | 2086.18 | 1212.11 | 1134.26 | 969.761 | |
| Rz (nm) | 2086.18 | 1212.11 | 1134.26 | 969.761 | |
| Rsk | -1.53597 | -0.90398 | -0.23134 | -0.85339 | |
| Rku | 6.15930 | 3.63991 | 3.33821 | 3.79548 | |
| D1 (µm2) | 2.22 | 2.02 | 2.03 | 2.05 | |
| 3D | Sa (nm) | 196.986 | 157.525 | 200.910 | 162.847 |
| Sq (nm) | 264.901 | 216.856 | 282.539 | 238.277 | |
| Sq/Sa | 1.25 | 1.38 | 1.41 | 1.46 | |
| St (nm) | 4143.57 | 3370.39 | 4286.96 | 3685.60 | |
| Sz (nm) | 4143.57 | 3370.39 | 4286.96 | 3685.60 | |
| Ssk | -1.36015 | -1.55015 | -1.82161 | -2.21571 | |
| Sku | 7.58238 | 8.51203 | 10.2906 | 11.9661 | |
| D2 (µm2) | 2.00 | 2.21 | 2.26 | 2.34 | |
| Df (µm2) | (D1+D2)/2 | 2.11 | 2.12 | 2.15 | 2.20 |
Furthermore, fractal dimension, D (unit = µm2), is an essential parameter in the classification of surface roughness. A fractal is formed by the successive fragmentation of a geometric shape, such that each fragment depicts the entire shape. The fractal dimension exceeds the topological dimension, but remains smaller than the Euclidean dimension of the space bearing the fractal [15,16]. By a backward integration approach, the fractal dimension, D, of a surface with a Gaussian distribution of asperities could be well estimated by either pair of the ratios of the roughness parameters Ra and Rq, or Sa and Sq, according to the expression
D = 1.6Rq/Ra µm2 (1)
Or,
D = 1.6Sq/Sa µm2 (2)
Respectively in 2D and 3D, as the case may be [12-14,17].
Such estimation of D was made for the thin films using the respective parameters from their 2D and 3D measurements with the expressions
D1 = 1.6Rq/Ra µm2 (3)
And,
D2 = 1.6Sq/Sa µm2 (4)
An average value of the fractal dimension, Df, was then calculated for each thin film surface from their respective values of D1 and D2 as
Df = (D1 + D2)/2 (5)
The results obtained from these calculations are included in Table 1. These results all fall within the predicted values (2≤ Df ≤3) for the parameter. In particular, that the values are all within the lower half (< 2.5) of the range is an indication that the thin films had relatively smooth surfaces and could serve as good tribological materials [3,7,10,13].
A further look at Table 1 shows that some statistical parameters and calculations appear to have been affected by the precursor dopant concentrations of the thin films. In 2D the parameters which show some trend with the dopant concentration include Ra, Rq, Rt and Rz, which each respectively decreased with increasing dopant concentration. In 3D the parameters involved include Sq/Sa, Ssk, Sku and D2, which each respectively increased (Ssk negatively) with increasing dopant concentration. While the quantities in the first group (2D) consist solely of all the fundamental parameters in the group, those in the second group (3D) consist solely of all the derived parameters in that group. Since the 2D profile highlights only the vertical variations in the topography while the 3D profile includes both the lateral and vertical variations, it means that what is missed out in one orientation is captured in the other orientation, and vice versa (a seeming mutual or compensative moderation). Similarly, the final calculation of the fractal dimensions of the thin films shows a positive trend with the precursor dopant concentration. Therefore on the whole, one can categorically state that the topographies of the nitrogen-doped zinc oxide thin films were moderated by the precursor dopant concentration. The trends highlighted are shown in Fig. 4.
So, while the thin film surfaces became smoother with increasing precursor dopant concentrations, as evidenced by the trends in Ra, Rq, Rt and Rz respectively, the qualities that make for useful application of the materials increased with increasing precursor dopant concentrations, as evidenced by the trends in Sq/Sa, Ssk, Sku and Df respectively. Optimum topological properties of the doped thin films are therefore obtainable with precursors with optimum dopant concentrations.
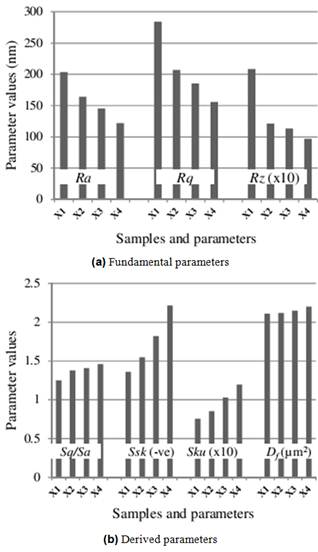
Figure 4. Parameters of the thin film topographies which (a) decreased, and (b) increased, with increasing precursor dopant concentration.
4. Conclusion
The composition and surface topography of nitrogen-doped zinc oxide thin films prepared by MOCVD were investigated in this work. The analyses revealed that the stoichiometric ratio of the elements in the thin films was constant, despite the varied precursor compositions used, but that the dopant concentrations of the precursors moderated the topography of the surfaces of the thin films. The statistical analyses of the topographical parameters of the surfaces showed that they exhibited characteristics which should make the thin films useful in nano-transport phenomena, gas sensors and tribological coatings. Thin films with higher dopant concentrations in their precursors gave surfaces with better applicable properties than those with lower precursor dopant concentrations.
Acknowledgements
The authors are thankful to the Department of Physics, Obafemi Awolowo University, Ile-Ife, Nigeria, for allowing the use of their MOCVD facilities, Centre for Energy Research and Development, Obafemi Awolowo University, Ile-Ife, Nigeria, for the RBS analyses, Argonne National Laboratory, Illinois, USA, for the microscopy and profilometry analyses, and the Federal University of Technology, Owerri, Nigeria, for all-round support.
References
- C. Klingshin, ZnO: Materials, Physics and Applications, ChemPhysChem 8(6), 782-803 (2007).
- S.V. Prasad, S.D. Walck and J.S. Zabinski, Microstructural Evolution in Lubricious ZnO Films Grown by Pulsed Laser Deposition, Thin Solid Films 360(1-2), 107-117 (2000).
- D. Raoufi, Fractal Analysis of ITO Thin Films: A Study Based on Power Spectral Density, Physica B 405, 451-455 (2010).
- H. Mohseni, B.A. Mensah, N. Gupta, S.G. Srinivasan and T.G. Scharf, On Tailoring the Nanocrystalline Structure of ZnO to Achieve Low Friction, Tribology and Lubrication 1, 17-19 (2012).
- M. Hamid, A.A. Tahir, M. Mazhar, F. Ahmad, K.C. Molloy; and G. K.-Kohn. Deposition and characterization of ZnO Thin Films from a Novel Hexanuclear Zinc Precursor. Inorganica Chimica Acta 361(1), 188-194 (2008).
- F. Toadere and N. Tosa, Spectral Characterization of the Rhodamine 6G Thin Films Effect on the Colour Image, AIP Conference Proceedings 1565(1), 263-268 (2013).
- H.D. Espinosa, Introduction to AFM and Dip-Pen Nanolithography (Northwestern University Press Evanston, 2003). pp25-31.
- B.R. Kumar and T.B. Rao, AFM Studies of Surface Morphology, Topography and Texture of Nanostructured Zinc Aluminum Oxide Thin Films, Digest Journal of Nanomaterials and Biostructures 7(4), 1881-1889 (2012).
- S. Talu, S. Stach, A. Mahajan, D. Pathak, T. Wagner, A. Kumar, R.K. Bedi and M. Talu, Multifractal Characterization of Water Soluble Copper Phthalocyanine-Based Film Surfaces, Electronic Materials Letters 10(4), 719-730 (2014).
- Y.R. Jeng, P.C. Tsai and T.H. Fang, Nanomeasurement and Fractal Analysis of PZT Ferroelectric Thin Films by Atomic Force Microscopy, Microelectronic Engineering 65, 406-415 (2003).
- A.L. Gal, X. Yang and M. Kluppel, Evauation of Sliding Friction and Contact Mechanics of Elastomers Based on Dynamic-Mechanical Analysis, American Institute of Physics, Journal of Chemical Physics 123(014704), 1-11 (2005).
- N. Kaneva, A. Ponomareva, L. Krasteva, D. Dimitrov, A. Bojinova, K. Papazova, G. Suchaneck and V. Moshnikov, Surface and Photocatalytic Properties of Nanostructural ZnO Thin Films Doped with Iron, Bulgarian Chemical Communications 45(4), 635-643 (2013).
- T.H. Fang, S.R. Jian and D.S. Chuu, Nanotribology and Fractal Analysis of ZnO Thin Films using Scanning Probe Microscopy, Journal of Physics D: Applied Physics 36, 878-883 (2003).
- M. Mirzaee, A. Zendehnam and S. Miri, Surface Statistical Properties of ZnO Thin Films Produced by Magnetron Sputtering at Different Rates, Scientia Iranica F 20(3), 1071-1075 (2013).
- Microsoft, Encarta Dictionaries, (Microsoft Corporation, 2009) (Retrieved from the CD Microsoft Encarta 2009).
- Oxford, Dictionary of Physics (Oxford University Press, New York, 2009). p193.
- N.I. Cho and H.G. Nam, Variations of Fractal Dimension During the Phase Transformation to the Silicide Nucleation in Thin Film Systems, Materials Research Society, Mat. Res. Soc. Symp. Proc. 311, 347-352 (1993).


