
Public Health and Preventive Medicine, Vol. 1, No. 3, August 2015 Publish Date: Jun. 2, 2015 Pages: 86-93
Developing Statistical Diagnosis Model by Discovering Principal Parameters for Type 2 Diabetes Mellitus: A Case for Korea
Jae Hyun Nam1, Jongseong Kim2, Hoo-Gon Choi2, *
1Friendoctor Clinic, Seoul, Republic of Korea
2Department of Systems Management Engineering, Suwon, Republic of Korea
Abstract
Objective: To determine the principal parameters for type 2 diabetes mellitus and develop a statistical diagnostic model to ensure more reliable diagnosis based on laboratory test results. Design: The use of fasting glucose levels as the only parameter is insufficient for making an accurate diagnosis of type 2 diabetes mellitus. Sample data were collected from a specialized diabetes mellitus clinic (Friendoctor Clinic®) located in Korea. Statistical analyses including the t-test were used to select the principal parameters, and a decision tree and clustering methods including expectation maximization were used to investigate the relationships among the principal parameters. Setting: This study was conducted at the Department of Industrial Engineering at Sungkyunkwan University, Suwon, Republic of Korea, and Friendoctor Clinic®, Seoul, Republic of Korea, between March 2010 and February 2011. Subjects: The total number of subjects was 953, including 692 patients and 261 non-patients (797 men, 156 women; age range, 19-81 years). Results: Among 32 laboratory test parameters, 10 statistically principal parameters were obtained. The entire subjects were divided into four groups on the basis of the obtained principal parameters: the patient group (PG), high-probability group (HG), low-probability group (LG), and normal group (NG). Although the fasting glucose level is important for the diagnosis of diabetes mellitus, six additional parameters such as age, GPT, A/G ratio, fasting glucose, MCHC and globulin were important for ensuring a more reliable diagnosis in the four groups. These results were confirmed by the classifier attribute selection method. Conclusion: A large number of laboratory test results were investigated comprehensively and intensively. Cases in patients belonging to each class (i.e., PG, HG, LG, or NG) can be diagnosed and treated differently on the basis of the principal parameters and diagnostic model used. However, more in-depth discussions about important risk factors such as high body mass index, genetic predisposition , lack of exercise, eating habits, pregnancy, weight changes, poor socioeconomic conditions, smoking habits, kinds of drugs, and sex hormone levels are required for the generalization of our results. This study’s findings will be a useful resource for diabetes research in Korea.
Keywords
Type 2 Diabetes Mellitus, Laboratory Test, Principal Parameters, Diagnosis Model, Critical Parameters
Received: April 3, 2015
Accepted: May 3, 2015
Published online: May 28, 2015
@ 2015 The Authors. Published by American Institute of Science. This Open Access article is under the CC BY-NC license. http://creativecommons.org/licenses/by-nc/4.0/
Contents
1. Introduction 2. Data Collection and Analysis Methods 2.1. Collecting and Preprocessing Data 2.2. Analysis Methods 3. Principal Parameters 3.1. Normalization vs. Non-Normalization 3.2. T-Test Analysis 3.3. Correlation Analysis 3.4. Principal Parameter Selection 4. Diagnosis Model 5. Conclusions and Discussion Acknowledgement
1. Introduction
The number of patients with type 2 diabetes in Korea has rapidly increased over the past three decades. The percentage of patients 20–70 years of age was 8.6% and is expected to increase 11.6% in the year 2025.1 Type 2 diabetes mellitus must be managed by an effective governmental health care program due to its significant social and economic losses.2 However, accurate disease etiology and pathogenesis remain under investigation in various research areas. Therefore, it is difficult to establish correct diagnostic or pathogenic criteria for diagnosing this disease. The most common method has been a laboratory test to collect various types of data related with liver function, hematology, urine, blood sugar levels, kidney profile, and lipid profile from subjects. In Korea, if a patient’s fasting glucose level is >120 mg/dL, they are considered to have type 2 diabetes mellitus.3 However, a level of fasting glucose can be affected by other factors and it can vary on daily basis. The use of fasting glucose as the only parameter is insufficient for an accurate diagnosis of type 2 diabetes mellitus.4,5
The purpose of this study is to find the principal parameters for type 2 diabetes mellitus and develop a diagnosis model to ensure more reliable diagnosis. Typical statistical methods and machine learning algorithms are utilized for this purpose. Both correlation analysis and t-tests are utilized as statistical methods to determine the significance of the statistical difference between patients and normal subjects and the relationships among laboratory test parameters. Decision tree classification,6 linear discriminant analysis (LDA),7 support vector machine (SVM),8 radial basis function (RBF) network,9 Naïve Bayes,10 and multilayer perceptron (MLP) 11 algorithms are used to obtain the principal parameters. These algorithms have presented their novel performances for classification in several recent studies related to type 2 diabetes mellitus.12-16 In this study, the expectation maximization (EM) clustering method17 is also used to divide the entire subject into a more detailed patient and normal groups: absolute patient group (PG), high-probability group (HG), low-probability group (LG), and normal group (NG). These groups were compared in an effort to identify the more critical parameters among the principal parameters.
2. Data Collection and Analysis Methods
2.1. Collecting and Preprocessing Data
In this study, laboratory test data from 953 medical subjects tested in 2005–2009 were collected in a specialized diabetes mellitus clinic located in Korea. A total number of 47 laboratory test parameters were examined. Among these parameters, those related to liver function, hematology, urine, blood sugar levels, kidney profile, and lipid profile were selected. The parameters with either identical values or many missing values were removed regardless of gender. A total of 32 parameters including gender type were selected for analysis. Furthermore, the test values located outside of the upper and lower limits were removed for each parameter regardless of subjects using the box-plot method.18 This preprocess can reduce the possible measurement errors of the laboratory tests. Table 1 shows the descriptive statistics of data of all 32 parameters. There are 159 subjects who were still diagnosed with type 2 diabetes mellitus even though the level was <120 mg/dL. This finding leads us to consider other parameters as possible factors for the diagnosis of type 2 diabetes mellitus along with the fasting glucose parameter.
Table 1. Descriptive statistics of all data.
| Parameter | Min | Max | Mean | Std. Dev. | Parameter | Min | Max | Mean | Std. Dev. | |
| Age | 19 | 81 | 52.6 | 11.731 | Hb (g/dL) | 6.8 | 18.6 | 14.053 | 1.6274 | |
| GOT (IU/L) | 9 | 98 | 26.16 | 12.374 | Hct (%) | 20.3 | 93.1 | 42.761 | 5.2585 | |
| GPT (IU/L) | 3 | 139 | 28.87 | 18.745 | MCV (fL) | 72.6 | 113.8 | 94.246 | 5.2943 | |
| ALP (IU/L) | 52 | 765 | 150.53 | 71.139 | MCH (pg) | 20.6 | 38.4 | 31.093 | 2.289 | |
| T.bilirubin (mg/dL) | 0.2 | 1.8 | 0.692 | 0.2445 | MCHC (g/dL) | 21.1 | 42.1 | 32.964 | 1.589 | |
| T.protein (g/dL) | 0.6 | 9.6 | 7.249 | 0.4965 | RDW (%) | 9.9 | 24.9 | 13.243 | 1.4359 | |
| Albumin (g/dL) | 2.9 | 7.1 | 4.499 | 0.3292 | Platelet (K/uL) | 43 | 599 | 238.56 | 63.955 | |
| Globulin (g/dL) | 1.4 | 4.4 | 2.761 | 0.3942 | MPV (fL) | 6.2 | 14.3 | 8.712 | 0.9861 | |
| A-G_ratio | 0.8 | 3.6 | 1.673 | 0.307 | Pct (%) | 0.048 | 0.441 | 0.206 | 0.0473 | |
| Fasting glucose (mg/dL) | 56 | 629 | 168.13 | 82.302 | PDW (%) | 11.6 | 62 | 16.196 | 1.7459 | |
| Creatinine (mg/dL) | 0.2 | 13 | 1.021 | 0.4419 | Neutrophil.seg (%) | 9 | 88.7 | 54.558 | 11.0293 | |
| T.cholesterol (mg/dL) | 102 | 360 | 186.74 | 38.784 | Lymphocyte (%) | 1 | 83 | 32.589 | 9.2602 | |
| Triglyceride (mg/dL) | 20 | 959 | 173.51 | 124.12 | pH | 5 | 8.5 | 5.637 | 0.8508 | |
| HDL (mg/dL) | 25 | 121 | 52.49 | 12.705 | S.G | 1.005 | 1.1 | 1.023 | 0.007 | |
| LDL (mg/dL) | 3 | 229 | 98.81 | 33.851 | Gender | Patients | Normal | |||
| WBC (K/uL) | 2.4 | 16.5 | 6.433 | 1.8321 | Male: | Female: | Male: | Female: | ||
| RBC (M/uL) | 2.35 | 5.84 | 4.529 | 0.5051 | 590 | 102 | 207 | 54 |
2.2. Analysis Methods
It is hard to simultaneously analyze 32 parameters and statistically obtain significant parameters since the laboratory test results in a complex data set that consists of various relationships among the parameters. The predictive power is reduced when the number of dimensions is increased using a fixed number of training samples.19 Therefore, this study first tried to find the principal parameters using basic statistical methods such as t-tests and correlation analyses. The t-test results were used to check whether differences between mean parameter values were statistically significant, while the correlation analysis was used to determine the linearity relationship between the paired parameters. The higher the correlation between two parameters, the stronger the linearity between them. The test results provide the parameters to be eliminated from further analyses. Denote by ![]() a set of
a set of ![]() parameters of subject
parameters of subject ![]() (
(![]() ), which may include the subject’s age, gender, GOT, GPT, etc. Furthermore, let
), which may include the subject’s age, gender, GOT, GPT, etc. Furthermore, let ![]() denote the collected dataset from
denote the collected dataset from ![]() subjects, where
subjects, where ![]() is either patient or normal. Note that
is either patient or normal. Note that ![]() and
and![]() . In this study, the number of parameters from
. In this study, the number of parameters from ![]() to
to ![]() (
(![]() ) is reduced by the T-test and correlation analysis and
) is reduced by the T-test and correlation analysis and ![]() is subdivided into HG, LG, and NG by EM clustering method so that
is subdivided into HG, LG, and NG by EM clustering method so that![]() . Building a diagnosis model is to find the classifier
. Building a diagnosis model is to find the classifier ![]() where
where ![]() indicates the chosen
indicates the chosen ![]() parameters. The model
parameters. The model ![]() can be used for the diagnosis of a new subject.
can be used for the diagnosis of a new subject.
Various methods such as the decision tree classifier, LDA, SVM, RBF network, Naïve Bayes, and MLP were then applied to group the laboratory test data. Except for the LDA, these methods are supervised machine learning algorithms that are used to classify large-scale data into an appropriate number of groups. The LDA method is a statistical method that is used for the same purpose as the machine learning algorithms. Finally, the EM clustering method automatically provides optimal numbers of clusters, i.e., PG and NG, along with the principal parameters. After the principal parameters were selected and the subject grouping into the separate clusters was finalized, the critical parameters among the principal parameters were finally determined by cluster comparison using classifier attribute selection via the decision tree, SVM, and RBF network methods.
3. Principal Parameters
3.1. Normalization vs. Non-Normalization
Before the principal parameters were searched among the 32 total parameters, we checked whether the test data were required to be normalized since normalization affects parameter selection accuracy. In this paper, principal parameter selection was made using the decision tree classifier, SVM, and RBF Network methods. Three ways of checking the accuracy were adapted: the accuracy of each classifier after normalizing for the corresponding number of data sampled randomly from the entire test data, the accuracy after normalization of the entire data and then application of each classifier only to the corresponding number of data, and the accuracy without normalization. The accuracy is the mean value obtained from sampling 10-fold cross-validation 100 times. As a result, the accuracy of each classifier is inconsistent and the accuracy changes depend heavily on sample size. These findings suggest that the normalization process is not necessary. Therefore, all of the test data in this paper were processed for further classification without normalization.
3.2. T-Test Analysis
T-test analysis was used to find the mean difference for each pair of parameters in either the patient subject group or the normal subject group determined using the laboratory test results. The test is performed using IBM’s SPSS®. As the test results show, two different p-values were obtained using Levene’s test: the first p-value was used to evaluate the equivalency of the variances of the two groups, while the second p-value was used to test the equivalency of the means between each pair of parameters. If the first p-value is <0.05, there are no differences in the sample variances of the two groups based on random sampling. The second p-value is divided into two cases depending on equal or different variances. If that value is <0.05, the means of the parameters are different between the patient subject group and the normal subject group. The t-test results showed a total of sixteen parameters – age, glutamic-oxaloacetic transaminase (GOT), glutamic pyruvic transaminase (GPT), alkaline phosphatase (ALP), total bilirubin, globulin, albumin/globulin (A/G) ratio, fasting glucose, triglycerides, HDL, LDL, white blood cells (WBC), red blood cells (RBC), hematocrit (Hct), mean cell hemoglobin (MCH), and mean corpuscular hemoglobin concentration (MCHC) – had different mean values between the PG and the NG.
3.3. Correlation Analysis
From the t-test results, sixteen parameters, such as the correlation analysis, among the 32 were selected for further analysis. The correlation analysis is used to find the linearity for each pair of parameters and to determine the linear relationship between fasting glucose and a parameter in either the PG or the NG. Although many methods are available for calculating correlation coefficient, including the Pearson, Spearman, and Kendall, the Pearson method was selected in this study because the linearity between parameters is found under the assumption of a normal distribution. Figure 1 shows the correlation of each pair of parameters. The darker the gray level between two parameters, the higher a positive or negative correlation exists. The {RBC, Hct}, {GPT, GOT}, and {MCH, MCHC} sets had a strong positive correlation, while the {globulin, A/G ratio} set had strong negative correlations.
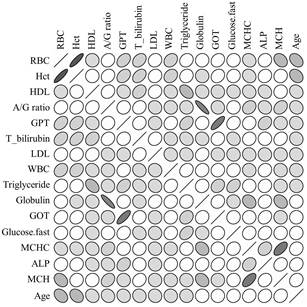
Fig. 1. The correlation between 16 parameters.
3.4. Principal Parameter Selection
In the correlation analysis, if a strong relationship exists between two parameters, one of the parameters can be neglected in further analyses.20 Table 2 shows eight different groups of parameters: Group #0 has all sixteen parameters, and other groups. All sixteen parameters were first used to select the best classifier among decision tree, LDA, SVM, RBF network, Naïve Bayes, and Artificial Neural Network. The decision tree classifier has the highest accuracy, 0.9169. The same classifier is applied to other groups which have only the parameters remaining after one parameter is omitted from each pair of strong correlation such as {RBC, Hct}, {GPT, GOT}, {MCH, MCHC}, and {globulin, A/G ratio} to obtain the groups that have the best accuracies. The set of parameters included in such groups can then be the principal parameters for diagnosing type 2 diabetes mellitus using laboratory tests. The decision tree classifier still presented higher accuracies in all groups except the group having all sixteen parameters compared to other classifiers. As a result, thirteen principal parameters – age, GPT, ALP, total bilirubin, globulin, A/G ratio, fasting glucose, triglyceride, HDL, LDL, WBC, RBC, and MCHC – were identified. The decision tree classifier was utilized in further analyses because it performed consistently with the highest accuracy of all classifiers.
Table 2. Grouping 16 parameters for classification.
| Group | Parameters |
| #0 | Age, GOT, GPT, ALP, T.bilirubin, Globulin, A/G ratio, Fasting glucose, Triglyceride, HDL, LDL, WBC, RBC, Hct, MCH, MCHC |
| #1 | Age, GOT, ALP, T.bilirubin, Globulin, A/G ratio, Fasting glucose, Triglyceride, HDL, LDL, WBC, RBC, MCH |
| #2 | Age, GOT, ALP, T.bilirubin, Globulin, A/G ratio, Fasting glucose, Triglyceride, HDL, LDL, WBC, RBC, MCHC |
| #3 | Age, GOT, ALP, T.bilirubin, Globulin, A/G ratio, Fasting glucose, Triglyceride, HDL, LDL, WBC, Hct, MCH |
| #4 | Age, GOT, ALP, T.bilirubin, Globulin, A/G ratio, Fasting glucose, Triglyceride, HDL, LDL, WBC, Hct, MCHC |
| #5 | Age, GPT, ALP, T.bilirubin, Globulin, A/G ratio, Fasting glucose, Triglyceride, HDL, LDL, WBC, RBC, MCH |
| #6 | Age, GPT, ALP, T.bilirubin, Globulin, A/G ratio, Fasting glucose, Triglyceride, HDL, LDL, WBC, RBC, MCHC |
| #7 | Age, GPT, ALP, T.bilirubin, Globulin, A/G ratio, Fasting glucose, Triglyceride, HDL, LDL, WBC, Hct, MCH |
| #8 | Age, GPT, ALP, T.bilirubin, Globulin, A/G ratio, Fasting glucose, Triglyceride, HDL, LDL, WBC, Hct, MCHC |
Figure 2 presents the decision tree classification results for the principal parameters with the following classification conditions:
- maximum depth = 30
- minimum number of splits = 10
- pruning confidence = 0.25
"Split" refers to the number of subjects required to separate the subjects into two independent groups, the PG and the NG. Decision tree classification results are obtained using 10-fold cross-validation in which the entire data set is divided into ten different sets for testing, training, and validating. As shown in Figure 2, each branch shows the parameter values, and each box contains the number of subjects classified by either the PG (1) or the NG (0). Fasting glucose is the most critical parameter affecting classification accuracy. Additionally, nine parameters – age, GPT, total bilirubin, globulin, A/G ratio, HDL, LDL, RBC, and MCHC – also affect classification accuracy, while parameters including ALP, triglyceride, and WBC are removed from the principal parameters.
Finally, the wrapper method was utilized to confirm the ten principal parameters obtained using the decision tree classifier. This method has been considered the best classification performer unless the computing time is constrained since a set of parameters are wrapped together in accuracy evaluation.21 In this paper, the linear forward selection algorithm was applied to wrap the parameters and determining the number of folds. This algorithm involves starting with no parameters in the model, testing the parameters one by one, and including parameters that are statistically significant. Squared correlation is eventually used to measure the statistical significance and a linear regression model is used to determine the fit. Furthermore, this algorithm shows better performance in terms of computation time when both the best-first search algorithm22 and the sequential floating forward selection algorithm23 are added to it24. As a result, the parameters except for ALP, triglyceride, and WBC, which have lower numbers of folds, are considered the final principal parameters in the creation of a diagnostic model on the basis of class. These three parameters show either one or no folds.
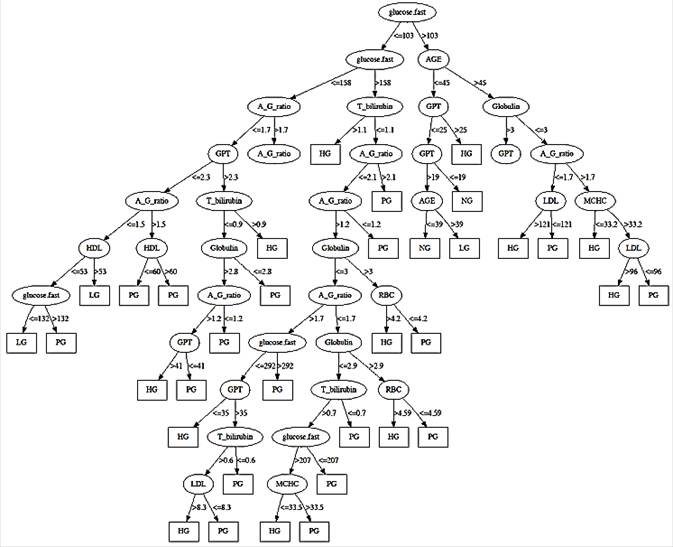
Fig. 2. Decision Tree model for PG, HG, LG and NG.
4. Diagnosis Model
Although it is important that the subjects be classified in either the PG or the NG on the basis of their laboratory test results, more detailed information obtained from the classification results would be helpful for diagnosing type 2 diabetes mellitus. Various patients have different progress patterns or different parameter values under different laboratory testing times. In this paper, all subjects are clustered further into subgroups using the final principal parameters. The EM algorithm is used to cluster through the Waikato Environment for Knowledge Analysis (WEKA) workbench25 in this paper. As a result, twelve clusters or subgroups were generated as shown in Table 3, in which the subjects included in each cluster can be divided into two groups, the patient group and the normal group. Cluster #1 can be considered the normal subject cluster because it has the largest number of normal subjects compared to other clusters, even though it contains 4% patients. Such clusters that have higher numbers of patients than normal subjects can be grouped as follows:
· Diagnosis Group #1: The cluster set {#3, #4, #6, #7, #8, #12} can be classified as a PG with the probability > 90% if a subject has those principal parameter values.
· Diagnosis Group #2: The cluster set {#5, #9, #10} can be classified as an HG group with a probability > 80% and < 90% if a subject has those principal parameter values.
· Diagnosis Group #3: The cluster set {#2, #11} can be classified as an LG group with a probability < 80% if a subject has those principal parameter values.
· Diagnosis Group #4: The cluster set {#1} can be classified as an NG.
Each class has its own cluster accuracy. Accuracy can be determined using a combination of precision and recall rate during extraction of a specific class from raw data and is relatively more meaningful than other classes. The number of parameter values (observations) classified correctly by decision tree model affects both the precision and the recall rate of each class. Specifically, the precision and recall rate are defined by Eqs. (1) and (2), respectively. Both rates represent a portion of the correct diagnosis. The average classification accuracy and recall rate are 0.756 and 0.754, respectively, while the LG class results in the lowest accuracy.
![]() (1)
(1)
![]() (2)
(2)
where TP = the number of observations classified correctly as a class
FP = the number of observations classified wrongly as a class
FN = the number of observations classified wrongly as other classes
Table 3. Clustering results by 10 principal parameters.
| Parameters | Cluster # | 1 | 2 | 3 | 4 | 5 | 6 | 7 | 8 | 9 | 10 | 11 | 12 |
| Age | mean | 34.77 | 39.11 | 65.4 | 60.53 | 56.76 | 44.74 | 48.13 | 73.03 | 49.57 | 48.2 | 55.44 | 56.66 |
| std. dev. | 6.42 | 2.83 | 7.45 | 8.56 | 8.09 | 6.27 | 7.51 | 3.44 | 9.65 | 11.77 | 12.33 | 8.46 | |
| GPT | mean | 15.14 | 23.47 | 45.1 | 20.39 | 18.56 | 44.74 | 33.04 | 29.28 | 40.57 | 37.68 | 15.49 | 23.05 |
| std. dev. | 4.24 | 5.33 | 26.6 | 8.17 | 5.75 | 26.56 | 15.44 | 8.45 | 25.55 | 13.88 | 3.45 | 6.9 | |
| T_bilirubin | mean | 0.9 | 0.61 | 0.56 | 0.48 | 0.65 | 0.64 | 0.73 | 0.78 | 0.76 | 0.9 | 0.56 | 0.67 |
| std. dev. | 0.31 | 0.12 | 0.15 | 0.15 | 0.18 | 0.2 | 0.18 | 0.21 | 0.27 | 0.27 | 0.19 | 0.18 | |
| Globulin | mean | 2.85 | 2.67 | 3.61 | 2.79 | 2.4 | 2.63 | 2.13 | 2.82 | 3.15 | 2.62 | 3.05 | 2.76 |
| std. dev. | 0.21 | 0.37 | 0.32 | 0.24 | 0.13 | 0.15 | 0.25 | 0.63 | 0.17 | 0.17 | 0.25 | 0.14 | |
| A/G ratio | mean | 1.57 | 1.76 | 1.14 | 1.51 | 1.88 | 1.76 | 2.32 | 1.79 | 1.44 | 1.79 | 1.44 | 1.63 |
| std. dev. | 0.14 | 0.35 | 0.13 | 0.19 | 0.1 | 0.12 | 0.4 | 0.39 | 0.11 | 0.12 | 0.14 | 0.09 | |
| Fasting glucose | mean | 88.39 | 110.41 | 145.58 | 239.21 | 147.82 | 248.45 | 205.99 | 160.3 | 197.66 | 165.09 | 116.29 | 139.24 |
| std. dev. | 7.42 | 22.13 | 41.69 | 89.46 | 50.56 | 108.95 | 98.83 | 50.45 | 94 | 68.95 | 20.71 | 36.61 | |
| HDL | mean | 61.39 | 41.7 | 45.55 | 45.07 | 55.11 | 48.4 | 57.83 | 42.88 | 51.68 | 58.55 | 57.38 | 50.29 |
| std. dev. | 13.45 | 3.94 | 6.84 | 10.05 | 15.23 | 6.73 | 12.88 | 7.88 | 10.37 | 13.82 | 15.39 | 9.22 | |
| LDL | mean | 98.37 | 119.36 | 93.09 | 89.42 | 96.8 | 94.16 | 87.15 | 86.49 | 115.27 | 96.42 | 102.31 | 98.54 |
| std. dev. | 25.08 | 27.07 | 25.16 | 34.38 | 29.98 | 35.12 | 30.4 | 31.22 | 42.49 | 34.09 | 28.58 | 30.32 | |
| RBC | mean | 4.54 | 4.95 | 3.91 | 4.06 | 4.3 | 4.82 | 4.59 | 4.59 | 4.85 | 4.9 | 4.16 | 4.49 |
| std. dev. | 0.46 | 0.26 | 0.56 | 0.23 | 0.5 | 0.35 | 0.37 | 0.52 | 0.4 | 0.33 | 0.41 | 0.4 | |
| MCHC | mean | 32.67 | 33.14 | 32.93 | 33.39 | 33.06 | 32.61 | 33.75 | 33.6 | 32.14 | 33.37 | 32.11 | 33.37 |
| std. dev. | 1.01 | 0.37 | 2.03 | 1.05 | 1.42 | 2.08 | 0.94 | 0.77 | 2.18 | 1.13 | 1.74 | 1.01 |
Table 4. Ranks of principal parameters by mean values of classes.
| Parameters | PG (#3, 4, 6, 7, 8, 12) | HG (#5, 9,10) | LG (#2,11) | NG (#1) | ||||||||
| Mean | Std. Dev. | Rank | Mean | Std. Dev. | Rank | Mean | Std. Dev. | Rank | Mean | Std. Dev. | Rank | |
| Age | 58.08 | 10.6 | 1 | 51.51 | 4.6 | 2 | 47.28 | 11.55 | 3 | 34.77 | 6.42 | 4 |
| GPT | 32.6 | 10.54 | 1 | 32.3 | 11.96 | 2 | 19.48 | 5.64 | 3 | 15.14 | 4.24 | 4 |
| T_bilirubin | 0.64 | 0.11 | 3 | 0.77 | 0.13 | 2 | 0.59 | 0.04 | 4 | 0.9 | 0.31 | 1 |
| Globulin | 2.79 | 0.48 | 3 | 2.72 | 0.39 | 4 | 2.86 | 0.27 | 1 | 2.85 | 0.2 | 2 |
| A/G ratio | 1.69 | 0.39 | 2 | 1.7 | 0.23 | 1 | 1.6 | 0.23 | 3 | 1.57 | 0.14 | 4 |
| Fasting glucose | 189.8 | 48.01 | 1 | 170.19 | 25.31 | 2 | 113.35 | 4.16 | 3 | 88.39 | 7.42 | 4 |
| HDL | 48.34 | 5.33 | 4 | 55.11 | 3.44 | 2 | 49.54 | 11.09 | 3 | 61.39 | 13.45 | 1 |
| LDL | 91.48 | 4.64 | 4 | 102.83 | 10.78 | 2 | 110.84 | 12.06 | 1 | 98.37 | 25.08 | 3 |
| RBC | 4.41 | 0.35 | 4 | 4.68 | 0.33 | 1 | 4.56 | 0.56 | 2 | 4.54 | 0.46 | 3 |
| MCHC | 33.26 | 0.42 | 1 | 32.86 | 0.64 | 2 | 32.63 | 0.73 | 4 | 32.67 | 1.01 | 3 |
Through the parameter reduction process using statistical and classification analysis such as t-test and decision tree with correlation analysis, it was discovered that ten parameters among the 32 laboratory test parameters become meaningful principal parameters in the diagnosis of type 2 diabetes mellitus in Korea. Using clustering algorithms, the entire subject set is divided into four classes: PG, HG, LG, and NG. It would be helpful to figure out more critical or important parameters among the principal parameters to ensure a reliable diagnosis. The mean value of each parameter in a class is compared to those of the remaining classes presented in Table 4. As a result, both PG and HG have higher mean values than either LG or NG in parameters including age, GPT, A/G ratio, fasting glucose, and MCHC. On the other hand, LG and NG showed higher globulin values compared to PG and HG. Therefore, six parameters are critical or most important to the diagnosis of type 2 diabetes mellitus in Korea. Furthermore, parameters including age, GPT, and fasting glucose may be the major factors affecting patients with diabetes. This result was proven by the classifier attribute selection method25 that was applied to the decision tree, SVM, and RBF network classifiers.
5. Conclusions and Discussion
This study comprehensively and intensively investigated a large number of laboratory test results. Additionally, better methods such as the wrapper algorithm and the linear forward selection algorithm were adapted to reduce the computation time. Cases in patients belonging to each class (i.e., PG, HG, LG, or NG) can be diagnosed and treated differently on the basis of the principal parameters and diagnostic model used. As mentioned before, the use of fasting glucose levels as the only parameter is insufficient for making an accurate diagnosis of type 2 diabetes mellitus. This study identified other critical parameters such as age, GPT, A/G ratio, fasting glucose, MCHC, and globulin for ensuring a reliable diagnosis. The results were confirmed by the classifier attribute selection method25 that was applied to the decision tree, SVM, and RBF network classifiers. However, this study has several limitations that prohibit the generalization of its results. First, the laboratory test data were obtained from a specialized type 2 diabetes mellitus clinic in Korea and a limited amount of laboratory test data were utilized. As presented in the diagnostic model, the fraction of correct diagnoses is about 75%, which should be increased by collecting more test data using various diabetes mellitus measurement instruments. Second, more in-depth discussions about important risk factors such as high body mass index, genetic predisposition, lack of exercise, eating habits, pregnancy, weight changes, poor socioeconomic conditions, smoking habits, kinds of drugs, and sex hormone levels are required for the generalization of our results. Third, other outstanding performers in machine learning algorithms must be considered to increase performance accuracy. Finally, the normal subjects in the PG, HG, LG as well as the patient subjects in the NG could represent misdiagnosed cases due to either parameters not obtained from the laboratory test or unknown factors.
Acknowledgement
This study was supported by 2010 Samsung Research Fund (2010–0683–000), Sungkyunkwan University, Republic of Korea. Also, the authors thank for the valuable comments given by the reviewers.
References
- Kim SG,Choi DS.Epidemiology andcurrentstatus ofdiabetes in Korea.Hanyang Medical Reviews2009;29:122-9.
- Ryu J, Kim S, Park J, Lee J. Risk factors of impaired fasting glucose and type 2 diabetes mellitus - using data mining.Korean Journal of Epidemiology2006;28:138-51.
- ADA International Expert Committee.Report of theexpertcommittee on the diagnosis and classification of diabetes mellitus.Diabetes Care, 1997;20:1183-97.
- Kim JH, Han MA, Park CJ, Park IG, Shin JH, Kim SY, Ryu SY, Bae HY.Evaluation of Fasting Plasma Glucose as a Screening for Diabetes Mellitus in Middle-aged Adults of Naju County.Diabetes and Metabolism Journal2008;32:328-37.
- Son HS.Early diagnosis of diabetes mellitus. Journal of the Korean Medical Association 2008; 51: 813 – 17.
- Breiman L, Friedman JH, Olshen RA, Stone CJ. Classification and Regression Trees. Wadsworth & Brooks/Cole Advanced Books & Software, Monterey, USA; 1984.
- Fisher RA. The use of multiple measurements in taxonomic problems. Annals of Eugenics 1936; 7: 179–88.
- Cortes C, Vapnik V. Support-Vector networks. Machine Learning 1995; 20: 273-97.
- Moody J, Darken CJ. Fast learning in networks of locally tuned processing units. Neural Computation, 1986; 1: 281-94.
- Langley P, Iba W, Thompson K. An analysis of Bayesian classifiers. Proc. of the association for the advancement of artificial intelligence-92 1992.
- Rumelhart DE, Hinton GE, Williams RJ. Learning internal representations by error propagation. MIT Press, Cambridge, USA; 1986.
- Adhi Tama B, Rodiyatul FS, Hermansyah H. An early detection method of type-2 diabetes mellitus in public hospital. TELKOMNIKA, 2013; 9: 287-294.
- Kuma VP, Velide L. A data mining approach for predicted and treatment of diabetes disease. International Journal of Science Inventions Today, 2014; 3: 73-79.
- Aljumah AA, Ahamad MG, Siddiqui MK. Application of data mining: Diabetes health care in young and old patients. Journal of King Saud University-Computer and Information Science, 2013; 25: 127-136.
- Sarwar A, Sharma V. Comparative analysis of machine learning techniques in prognosis of type II diabetes. AI & Society, 2014; 29: 123-29.
- Jelinek HF, Yatsko A, Stranieri A, Venkatraman S. Novel data mining techniques for incomplete clinical data in diabetes management. British Journal of Applied Science & Technology, 2014; 4: 4591-4606.
- Ian HW, Eibe F. Data Mining: Practical Machine Learning Tools and Techniques. Elsevier, Burlington, USA; 2005.
- Williamson DF, Parker RA, Kendrick JS. The box plot: a simple visual method to interpret data. Annals of Internal Medicine 1989; 110: 916-21.
- Oommen T, Misra D, Twarakavi NKC, Prakash A, Sahoo B, Bandopadhyay S. An objective analysis of support vector machine based classification for remote sensing. Mathematical Geosciences 2008; 40: 409-24.
- Mark AH. Correlation-based feature selection for machine learning. Ph.D Dissertation, University of Waikato, Canada; 1999.
- Mark H, Geoffrey H. Benchmarking attribute selection techniques for discrete class data mining. IEEE Transactions on Knowledge and Data Engineering 2003; 15: 1436-47.
- KohaviR,JohnGH.Wrappers forfeaturesubsetselection.Artificial Intelligence1997;97:273-324.
- 23.PudilP, NovovicovaJ,KittlerJ.Floating search methods in feature selection.Pattern Recognition Letter1994;15:1119-25.
- GütleinM, FrankE, HallM,Karwath A.Large-scale attribute selection using wrappers.IEEE Symposium on Computational Intelligence and Data Mining2009.
- Mark H, Eibe F, Geoffrey H, Bernhard P, Peter R, Ian H. The WEKA Data Mining Software, An Update SIGKDD Explorations 11 2009.


