
International Journal of Preventive Medicine Research, Vol. 1, No. 4, October 2015 Publish Date: Aug. 3, 2015 Pages: 260-266
Statistical Analysis on Infectious Diseases 1995-2013 in Dubai, UAE
Khamis F. G.1, Hussain H. Y.2, *
1College of Business Administration, Al-Ain University of Science and Technology, Al Ain, UAE
2Primary Health Care, Dubai Health authority, Dubai, UAE
Abstract
The infectious diseases itself and its variation over time are a major concern for policy makers and public health researchers, especially when it comes to allocating critical resources relevant to the field of health and economic sectors. Therefore, in this study, we are among the first to examine the crude incidence rate (CIR) of many infectious diseases in Dubai, UAE. The study design is a time series analysis using polynomial regression model. The study seeks to assess the levels of infectious diseases during the period 1995-2013. The data were obtained from preventive services and communicable disease Section in Dubai. The existence and the variance of 21 infectious diseases were examined over 19 years using descriptive statistics and regression analysis. The CIR was used as a response variable and the time as explanatory variable. It was found that CIR of all diseases decreased remarkably from 1486.82 in 1995 to 307.43 in 2013. The highest and lowest means of CIR for all disease were found 84.89 and 14.64 in 1996 and 2013 respectively. The highest and lowest coefficients of variation were found 308.43 and 170.79 in 2004 and 2013 respectively. Correlation coefficient between the CIR for all diseases and the time was found 0.87. The coefficient of determination was found moderate to high in most estimated regression equations. The F-statistic was found moderate to high significant in most estimated regression equations. The forecasted values for CIR of all diseases in selected years, 2014, 2015, and 2016 were found 680.24, 803.78, and 944.16 respectively. It was concluded that the CIR of most infectious diseases were decreased remarkably in some past periods of time, but some of them are still exist and highly variant over the time period covered by this study. The Change in CIR of all diseases was decreased over the period 1995-2003 while increased over the period 2007-2013. However, the CIR of most diseases was decreased over the period 1995-2003 while increased over the period 2007-2013. The forecasted values for CIR of all diseases showed that they will increase over time. These findings provide insights for local control and prevention strategies.
Keywords
Statistical Analysis, Dubai, Infectious Diseases
Received: May 20, 2015
Accepted: June 3, 2015
Published online: August 2, 2015
@ 2015 The Authors. Published by American Institute of Science. This Open Access article is under the CC BY-NC license. http://creativecommons.org/licenses/by-nc/4.0/
1. Introduction
Due to high migration of expatriate workers and transient influx of tourists from all over the world, infectious diseases remain an important issue for public health in UAE. Infectious diseases surveillance, monitoring, and treating have become an international top priority due to the perceived risk of bioterrorism. Although the infectious diseases have been discussed in the prior literature; little research has been done in UAE during relatively a long period of time 1995-2013, that combines descriptive and inferential statistics. So, descriptive statistics and polynomial regression models were applied. The current study is an effort to promote health status and attempts to advance the literature by using a case study in Dubai. Many studies have discussed infectious diseases in terms of their spatial, temporal, or both, effects. For instance, Johnson (2008) stated in his study in New York State that infectious disease surveillance in general, can be improved by complementing spatial cluster detection of an outcome variable with predictive "risk mapping" that incorporates spatiotemporal data on the environment, climate and human population through the flexible class of generalized linear mixed models. In UAE, Loney et al. (2013) studied many non-communicable and few communicable diseases. They stated that major public health challenges posed by certain personal (e.g. ethnicity, family history), lifestyle, occupational, and environmental factors associated with the development of chronic disease are not isolated to the UAE; rather, they form part of a global health problem, which requires international collaboration and action. As stated by Statistical Analysis Section (2005), Socio-economic development in UAE accompanied by the characteristics cultural changes observed in developed societies elsewhere, improved sanitation and consequent reduction in the occurrence of communicable diseases has led to increasing life expectancy, changing nutritional habits, decreasing habitual physical activity and the emergency of non-communicable diseases as the dominant feature of ill health in the community. Out of the 5273 reported cases of infectious diseases in Dubai in 2004, 2183 (41.4%) were Emirates and 58.6% Expatriates (Statistical Analysis Section, 2005).
To the authors’ best knowledge no study has investigated the problem of infectious diseases over time in Dubai, UAE. Briefly, the present study found significant variation in infectious diseases over time. The findings of this study, combined with those of earlier works, can provide useful information for efficient risk management and health decision-making and to determine where the limited resources should be allocated. This manuscript attempts to advance the literature by using a case study in Dubai, UAE. In Europe Trends in communicable diseases, and preventable risk factors, present a mixed picture of progress and challenges across Europe. Throughout the life-course, individuals are exposed to various.
Risks, and face different threats to their health and well-being, Almost 3% of all new TB cases that occurred in Europe in the year 2000 were also co-infected with HIV. Approximately 28% of people living with AIDS in the WHO European Region in 2004 were also co-infected with TB. However, cases of dual infection are unevenly distributed through Europe. As an AIDS indicator disease among adolescent and adult cases, the TB rate among people living with HIV/AIDS was 24% in Western Europe, 19% in central Europe and 56% in the former Soviet Union (Veen and Godinho 2006). In USA 2013, A total of 9,582 TB cases (a rate of 3.0 cases per 100,000 persons) were reported in the. Both the number of TB cases reported and the case rate decreased; this represents a 3.6% and 4.3% decline, respectively, compared to 2012.* Health-care providers in the United States are required to report certain infectious diseases to a specified state or local authority. A disease is designated as modifiable if timely information about individual cases is considered necessary for prevention and control of the disease. Each year, CDC publishes a summary of the cases of notifiable disease reported for the most recent year for which data is available. This report presents a summary of notifiable diseases for 2012.
2. Materials & Methods
2.1. Data
Dubai was selected because of its importance as the famous emirate in both international trading and tourism region not only in UAE but also in the Gulf region; and because of the good quality and available data. Dubai has been facing several socioeconomic challenges, one of which is the large numbers of expatriates from many countries and the economic crisis in 2010. The data on 21 infectious diseases were obtained from preventive services and communicable disease Section in Dubai during the period 1995-2013. These diseases are: Amoebic Dysentery, Baccilary Dysentery, Bact Meningitis/TB Meningitis, Brucellosis, Chickenpox, Food Poisoning, Viral Hepatitis (A,B,C), Herpes Zoster, AIDS, HIV, Leprosy, Malaria, Measles, Mumps, Pertossis , Pulmonary TB, Rubella, Salmonellosis, Scarlet Fever, Typhoid, Viral Encephalitis, and Viral Meningitis. The crude incidence rate (CIR) of infectious disease was used in the analysis. Historically, in Dubai the total of CIR of all infectious diseases decreased remarkably from 1486.82 in 1995 to 307.43 in 2013. Crude rates are widely used, in part because they are summary measures and so are easily interpreted, and in part because their calculation requires relatively little information. The CIR can be calculated as follows:
Where,
Mid-year population =![]()
2.2. Analysis
Descriptive and inferential statistics were applied. Such analysis may help generate hypothesis and idea on when the population is at risk of infected by many infectious diseases. So, we identified how the progress of these diseases is going on over time in Dubai, UAE. The research design is a time series analysis using polynomial regression modeling. Five steps of analysis were conducted. In step one CIR was calculated for all and each disease. Step two involved descriptive statistics for all and each disease over the period 1995-2013 and in each year. In step three, polynomial regression model was investigated for all and each disease. The change in the mean of CIR associated with one year increase in time was examined, every 4 years starting by 1997 and ending by 2013, in the fourth step. In step five, forecasted values for CIR of all and each disease were estimated for next three years.
Polynomial regression was applied due to the relationship between infectious diseases and time is curvilinear. The PRM is a general linear regression model for fitting any relationship in the unknown parameters. PRMs are useful when the analyst knows that curvilinear effects are present in the response function and as approximating functions to unknown and possibly very complex nonlinear relationships. The bellow quadratic function is called a polynomial regression model (PRM) of degree 2:
![]()
Where,![]() , represents the CIR of a disease and
, represents the CIR of a disease and ![]() represents the time over 19 years, and
represents the time over 19 years, and ![]() represents the error term. The correlation between
represents the error term. The correlation between ![]() and
and ![]() equals .97, the time variable,
equals .97, the time variable, ![]() was centered. After centering, the correlation between
was centered. After centering, the correlation between ![]() and
and ![]() became. 00. The assumptions for PRM are: the behavior of a dependent variable y can be explained by a linear, or curvilinear, additive relationship between the dependent variable and a set of k independent variables; the relationship between the dependent variable y and any independent variable is linear or curvilinear (specifically polynomial); the independent variables are independent of each other; and the errors are independent, normally distributed with mean zero and a constant variance. All of us know that these assumptions may, or may not be true. In practice all model assumptions need to be tested, and, in practice, there will be no perfect model.
became. 00. The assumptions for PRM are: the behavior of a dependent variable y can be explained by a linear, or curvilinear, additive relationship between the dependent variable and a set of k independent variables; the relationship between the dependent variable y and any independent variable is linear or curvilinear (specifically polynomial); the independent variables are independent of each other; and the errors are independent, normally distributed with mean zero and a constant variance. All of us know that these assumptions may, or may not be true. In practice all model assumptions need to be tested, and, in practice, there will be no perfect model.
3. Results
Descriptive statistics are shown in Tables 1 and 2. The largest and smallest means of CIR of 345.68 and .77 were found in Chickenpox and leprosy respectively during the period 1995-2013. The largest and smallest standard deviations in CIR of 249.91 and .58 were found in Chickenpox and viral encephalitis respectively. The largest and smallest variations in CIR of 204.21 and 26.29 were found in Measles and Pulmonary TB respectively based on Coefficient of Variation (CV). The correlation coefficient between the CIR of all diseases and the time was found .87. The estimated PRM for CIR of all diseases can be shown as follows:
![]()
The intercept, ![]() of 371.04 represents the CIR at time, x = 10 which is the year 2004, in the range of the data. The
of 371.04 represents the CIR at time, x = 10 which is the year 2004, in the range of the data. The ![]() of -53.28 represents a difference in CIR for a one-year difference in time only at one point of time. As shown in Table 2, the largest and smallest means of CIR for all diseases of 84.89 and 14.64 and the largest and smallest SDs of CIR for all diseases of 224.73 and 25.00 were found in 1996 and 2013 respectively. The largest and smallest variations of CIR for all diseases of 308.43 and 170.79 were found in 2004 and 2013 respectively based on CV.
of -53.28 represents a difference in CIR for a one-year difference in time only at one point of time. As shown in Table 2, the largest and smallest means of CIR for all diseases of 84.89 and 14.64 and the largest and smallest SDs of CIR for all diseases of 224.73 and 25.00 were found in 1996 and 2013 respectively. The largest and smallest variations of CIR for all diseases of 308.43 and 170.79 were found in 2004 and 2013 respectively based on CV.
Table 1. Shows the CIR and descriptive statistics for each disease during the period 1995-2013.
| year | Amoebic Dysentery | Bacillary Dysentery | Bact Meningitis/TB Meningitis | Brucellosis | Chickenpox | Food Poisoning | viral hepatitis (A.B.C) | herpes zoster | aids | hiv+Ve | leprosy |
| 1995 | 3.28 | 18.60 | 12.58 | 3.28 | 882.35 | 6.56 | 107.22 | .55 | 2.74 | 12.58 | 2.74 |
| 1996 | 1.71 | 20.19 | 12.66 | 2.40 | 1030.79 | 29.43 | 111.57 | 6.50 | 4.11 | 10.61 | 1.03 |
| 1997 | 1.74 | 9.96 | 6.72 | 1.99 | 609.57 | 14.19 | 83.42 | 6.72 | 1.00 | 5.48 | 1.99 |
| 1998 | .78 | 13.31 | 7.05 | 3.52 | 504.70 | 8.02 | 62.23 | 5.09 | 1.37 | 6.46 | .59 |
| 1999 | .64 | 8.70 | 4.51 | .64 | 384.92 | 6.77 | 34.33 | 2.26 | .81 | 4.19 | .48 |
| 2000 | .26 | 3.12 | 3.77 | 1.69 | 209.56 | 3.12 | 25.11 | .91 | 1.69 | 10.80 | .39 |
| 2001 | .11 | 4.51 | 3.05 | .34 | 210.75 | 9.14 | 23.92 | 1.13 | .23 | 11.73 | 1.35 |
| 2002 | .11 | 3.74 | 3.53 | .43 | 205.42 | 9.41 | 32.92 | 2.24 | .53 | 13.79 | .43 |
| 2003 | .49 | 2.93 | 1.86 | 1.47 | 243.40 | 10.36 | 68.89 | 5.18 | .68 | 16.32 | .68 |
| 2004 | .35 | .61 | 2.19 | .35 | 299.61 | 16.80 | 45.94 | 4.55 | 1.66 | 16.01 | .26 |
| 2005 | 1.35 | .48 | 2.78 | .32 | 189.67 | 7.06 | 44.27 | 4.36 | 1.43 | 16.34 | .40 |
| 2006 | 2.55 | .73 | 2.77 | .15 | 253.13 | 7.14 | 43.96 | 7.80 | 2.77 | 15.09 | .22 |
| 2007 | 6.84 | .47 | 2.78 | .34 | 257.96 | 8.94 | 68.57 | 12.54 | 3.05 | 28.05 | .27 |
| 2008 | 9.32 | .63 | 2.96 | .44 | 417.85 | 5.10 | 78.03 | 13.23 | 2.08 | 19.96 | .25 |
| 2009 | 7.78 | 1.76 | 3.10 | .47 | 217.68 | 30.38 | 78.08 | 11.94 | 1.58 | 9.19 | .76 |
| 2010 | 11.97 | .82 | 1.96 | .44 | 173.75 | 43.57 | 83.50 | 14.85 | 4.90 | 7.13 | .87 |
| 2011 | 12.74 | .92 | 1.94 | .46 | 195.52 | 42.52 | 62.73 | 11.21 | 2.25 | 7.11 | .51 |
| 2012 | 13.14 | .34 | .92 | .88 | 178.83 | 22.63 | 70.04 | 14.26 | 3.46 | 4.04 | .49 |
| 2013 | 11.25 | .60 | 1.44 | .37 | 102.46 | 25.46 | 61.90 | 22.04 | 2.41 | 2.92 | .93 |
| Mean | 4.55 | 4.86 | 4.14 | 1.05 | 345.68 | 16.14 | 62.45 | 7.76 | 2.04 | 11.46 | .77 |
| SD | 4.90 | 6.31 | 3.38 | 1.05 | 249.91 | 12.56 | 25.18 | 5.87 | 1.25 | 6.33 | .65 |
| CV(%) | 107.76 | 129.61 | 81.65 | 99.60 | 72.29 | 77.85 | 40.31 | 75.70 | 61.14 | 55.23 | 84.05 |
Table 1. Continued.
| year | malaria | Measles | mumps | pulmonary TB | rubella | salmonellosis | Scarlet Fever | typhoid | viral encephalitis | viral meningitis |
| 1995 | 140.59 | 56.34 | 105.03 | 28.99 | 12.58 | 26.80 | 2.74 | 44.31 | 1.09 | 15.86 |
| 1996 | 146.82 | 39.01 | 239.22 | 18.48 | 4.11 | 46.89 | 5.13 | 42.78 | 1.37 | 7.87 |
| 1997 | 133.22 | 14.69 | 97.61 | 21.91 | 2.99 | 21.66 | 7.97 | 29.63 | 2.24 | 4.73 |
| 1998 | 71.63 | 9.78 | 457.74 | 13.89 | 1.57 | 15.26 | 8.81 | 12.92 | .59 | 6.26 |
| 1999 | 51.74 | 1.61 | 38.52 | 22.89 | .97 | 11.61 | 3.87 | 13.38 | .81 | 5.00 |
| 2000 | 26.15 | .91 | 25.11 | 25.63 | .78 | 6.63 | 3.25 | 9.24 | .39 | 7.28 |
| 2001 | 11.06 | .11 | 8.57 | 18.84 | .79 | 7.22 | 2.03 | 5.30 | .23 | 4.29 |
| 2002 | 14.43 | .75 | 6.73 | 16.35 | .53 | 10.47 | 2.99 | 7.59 | .21 | 3.10 |
| 2003 | 24.82 | 2.05 | 8.99 | 20.23 | 1.86 | 7.91 | 7.43 | 7.62 | .68 | 2.64 |
| 2004 | 14.96 | .26 | 3.59 | 17.94 | .96 | 3.76 | 2.36 | 5.51 | .70 | 2.36 |
| 2005 | 13.41 | .08 | 3.33 | 17.53 | .79 | 1.98 | 1.98 | 2.30 | 1.03 | 2.78 |
| 2006 | 10.72 | 1.53 | 5.25 | 22.75 | 1.31 | 2.41 | 1.82 | 4.59 | .87 | 2.41 |
| 2007 | 13.08 | 1.02 | 6.57 | 26.83 | 2.51 | 3.66 | 4.54 | 5.69 | .81 | 1.69 |
| 2008 | 12.47 | .25 | 13.35 | 32.12 | 2.65 | 5.54 | 4.35 | 9.13 | 1.01 | 1.39 |
| 2009 | 16.10 | .76 | 7.14 | 35.70 | 1.05 | 5.21 | 7.43 | 7.08 | .29 | 2.17 |
| 2010 | 16.97 | 1.85 | 6.80 | 33.18 | .54 | 10.77 | 5.00 | 9.30 | .65 | .98 |
| 2011 | 18.83 | 2.30 | 7.93 | 29.73 | 1.54 | 8.95 | 6.96 | 11.72 | .72 | 1.48 |
| 2012 | 24.19 | 1.17 | 6.23 | 30.37 | .44 | 6.77 | 5.40 | .00 | .68 | .54 |
| 2013 | 20.23 | 4.77 | 8.29 | 29.03 | .56 | 4.54 | 4.82 | .00 | 2.31 | 1.11 |
| Mean | 41.13 | 7.33 | 55.58 | 24.34 | 2.03 | 10.95 | 4.68 | 12.00 | .88 | 3.89 |
| SD | 46.61 | 14.97 | 113.40 | 6.40 | 2.74 | 10.81 | 2.19 | 12.81 | .58 | 3.60 |
| CV(%) | 113.34 | 204.21 | 204.03 | 26.29 | 135.18 | 98.67 | 46.80 | 106.72 | 65.58 | 92.60 |
Table 2. Shows the CIR of all diseases and descriptive statistics for the CIR of all 21 diseases in each year.
| year | CIR of all diseases | Mean | SD | CV(%) |
| 1995 | 1486.82 | 70.80 | 190.19 | 268.62 |
| 1996 | 1782.67 | 84.89 | 224.73 | 264.73 |
| 1997 | 1079.44 | 51.40 | 132.83 | 258.42 |
| 1998 | 1211.57 | 57.69 | 142.22 | 246.51 |
| 1999 | 598.66 | 28.51 | 82.91 | 290.84 |
| 2000 | 365.80 | 17.42 | 45.00 | 258.34 |
| 2001 | 324.70 | 15.46 | 45.21 | 292.38 |
| 2002 | 335.70 | 15.99 | 44.12 | 276.00 |
| 2003 | 436.47 | 20.78 | 53.21 | 256.01 |
| 2004 | 440.76 | 20.99 | 64.73 | 308.43 |
| 2005 | 313.67 | 14.94 | 41.30 | 276.53 |
| 2006 | 389.97 | 18.57 | 54.69 | 294.52 |
| 2007 | 456.23 | 21.73 | 56.32 | 259.23 |
| 2008 | 632.10 | 30.10 | 90.52 | 300.73 |
| 2009 | 445.66 | 21.22 | 48.46 | 228.36 |
| 2010 | 429.82 | 20.47 | 40.24 | 196.58 |
| 2011 | 428.08 | 20.38 | 43.11 | 211.48 |
| 2012 | 384.81 | 18.32 | 40.23 | 219.57 |
| 2013 | 307.43 | 14.64 | 25.00 | 170.79 |
Table 3. Shows the estimated parameters for the CIR of all diseases and each disease and their t ratio with its p-value between two parentheses, R2, adjusted R2, and the F statistic with its p-value between two parentheses.
| Estimated equations of CIR |
|
|
| t ratio (p-value) | R2 | Adjusted R2 | F (p-value) | ||
|
|
|
| |||||||
| All diseases | 371.04 | -53.28 | 8.42 | 4.77 (<.001) | -5.64 (<.001) | 4.35 (<.001) | .76 | .73 | 25.39 (<.001) |
| Amoebic Dysentery | 2.02 | .71 | .08 | 3.37 (.004) | 9.77 (<.001) | 5.65 (<.001) | .89 | .87 | 63.64 (<.001) |
| Bacillary Dysentery | 1.49 | -.92 | .11 | 2.20 (.043) | -11.18 (<.001) | 6.67 (<.001) | .91 | .90 | 84.73 (<.001) |
| Bacterial Meningitis/TB Meningitis | 2.42 | -.47 | .06 | 4.89 (<.001) | -7.89 (<.001) | 4.65 (<.001) | .84 | .82 | 41.95 (<.001) |
| Brucellosis | .52 | -.13 | .02 | 2.56 (.021) | -5.36 (<.001) | 3.52 (.003) | .72 | .69 | 20.58 (<.001) |
| Chickenpox | 222.70 | -32.52 | 4.10 | 4.77 (<.001) | -5.74 (<.001) | 3.53 (.003) | .74 | .71 | 22.67 (<.001) |
| Food Poisoning | 10.23 | 1.13 | .20 | 2.98 (.009) | 2.71 (.015) | 2.30 (.035) | .44 | .37 | 6.33 (.009) |
| viral hepatitis (A.B.C) | 45.11 | -.34 | .58 | 6.34 (<.001) | -.40 (.697) | 3.27 (.005) | .40 | .33 | 5.41 (.016) |
| herpes zoster | 5.35 | .86 | .08 | 5.761 (<.001) | 7.59 (<.001) | 3.47 (.003) | .81 | .79 | 34.81 (<.001) |
| Aids | 1.40 | .07 | .02 | 3.73 (.002) | 1.57 (.135) | 2.28 (.037) | .32 | .24 | 3.84 (.043) |
| HIV +Ve | 15.67 | -.02 | -.14 | 8.53 (<.001) | -.09 (.933) | -3.06 (.007) | .37 | .29 | 4.70 (.025) |
| Leprosy | .35 | -.06 | .01 | 2.32 (.034) | -3.10 (.007) | 3.73 (.002) | .60 | .55 | 11.76 (.001) |
| Malaria | 10.53 | -6.03 | 1.02 | 1.87 (.080) | -8.84 (<.001) | 7.29 (<.001) | .89 | .88 | 65.62 (<.001) |
| Measles | -3.05 | -1.59 | .35 | -1.14 (.272) | -4.88 (<.001) | 5.18 (<.001) | .76 | .73 | 25.31 (<.001) |
| Mumps | 17.86 | -11.03 | 1.26 | .55 (.588) | -2.81 (.013) | 1.56 (.138) | .39 | .32 | 5.16 (.019) |
| pulmonary TB | 21.74 | .68 | .09 | 13.13 (<.001) | 3.40 (.004) | 2.10 (.052) | .50 | .44 | 7.99 (.004) |
| Rubella | .61 | -.25 | .05 | .84 (.413) | -2.81 (.013) | 2.63 (.018) | .48 | .42 | 7.41 (.005) |
| Salmonellosis | 4.44 | -1.24 | .22 | 2.12 (.050) | -4.88 (<.001) | 4.17 (.001) | .72 | .69 | 20.59 (<.001) |
| Scarlet Fever | 3.93 | .02 | .03 | 5.17 (<.001) | .25 (.809) | 1.33 (.203) | .10 | -.01 | .91 (.422) |
| Typhoid | 4.77 | -1.63 | .24 | 2.17 (.045) | -6.13 (<.001) | 4.42 (<.001) | .78 | .75 | 28.54 (<.001) |
| Viral Encephalitis | .52 | <-.01 | .01 | 3.01 (.008) | -.13 (.900) | 2.75 (.014) | .32 | .24 | 3.80 (.045) |
| Viral Meningitis | 2.44 | -.51 | .05 | 3.94 (.001) | -6.84 (<.001) | 3.16 (.006) | .78 | .75 | 28.36 (<.001) |
Table 4. Shows the change in the mean of CIR associated with one year increase in time every 4 years starting by 1997 and ending by 2013.
| Change in CIR of | Change in time | |||
| 1997-1998 | 2002-2003 | 2007-2008 | 2012-2013 | |
| All diseases | -162.75 | -78.55 | 5.65 | 89.85 |
| Amoebic Dysentery | -.33 | .47 | 1.27 | 2.07 |
| Bacillary Dysentery | -2.35 | -1.25 | -.15 | .95 |
| Bact Meningitis/TB Meningitis | -1.25 | -.65 | -.05 | .55 |
| Brucellosis | -.39 | -.19 | .01 | .21 |
| Chickenpox | -85.82 | -44.82 | -3.82 | 37.18 |
| Food Poisoning | -1.47 | .53 | 2.53 | 4.53 |
| viral hepatitis (A.B.C) | -7.88 | -2.08 | 3.72 | 9.52 |
| herpes zoster | -.18 | .62 | 1.42 | 2.22 |
| Aids | -.19 | .01 | .21 | .41 |
| HIV +Ve | 1.8 | .40 | -1.00 | -2.40 |
| Leprosy | -.19 | -.09 | .01 | .11 |
| Malaria | -19.29 | -9.09 | 1.11 | 11.31 |
| Measles | -6.14 | -2.64 | .86 | 4.36 |
| Mumps | -27.41 | -14.81 | -2.21 | 10.39 |
| pulmonary TB | -.49 | .41 | 1.31 | 2.21 |
| Rubella | -.90 | -.40 | .10 | .60 |
| Salmonellosis | -4.10 | -1.90 | .30 | 2.50 |
| Scarlet Fever | -.37 | -.07 | .23 | .53 |
| Typhoid | -4.75 | -2.35 | .05 | 2.45 |
| viral encephalitis | -.14 | -.04 | .06 | .16 |
| viral meningitis | -1.16 | -.66 | -.16 | .34 |
Table 5. Shows forecasted values for CIR of all and each disease in selected years: 2014, 2015, and 2016.
| Forecasted values for CIR of | 2014 | 2015 | 2016 | |||
| All diseases | 680.24 | 803.78 | 944.16 | |||
| Amoebic Dysentery | 17.12 | 19.51 | 22.06 | |||
| Bacillary Dysentery | 3.29 | 4.68 | 6.29 | |||
| Bact Meningitis/TB Meningitis | 3.72 | 4.51 | 5.42 | |||
| Brucellosis | 1.22 | 1.51 | 1.84 | |||
| Chickenpox | 307.5 | 361.08 | 422.86 | |||
| Food Poisoning | 41.53 | 46.86 | 52.59 | |||
| viral hepatitis (A.B.C) | 99.71 | 111.55 | 124.55 | |||
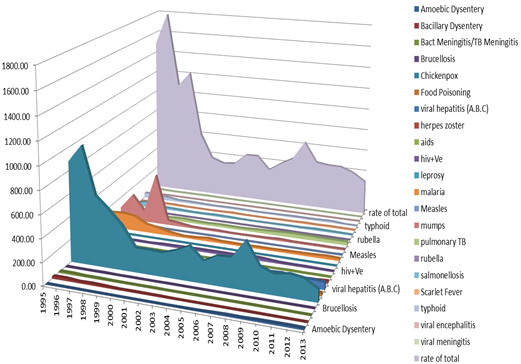
Figure 1. Shows area chart for the CIR for all 21 communicable diseases and for each disease during the period 1995-2013.
The estimated regression parameters for all disease and each disease are shown in Table 3. Most of these parameters were found significant at p ≤ .05. The adjusted R2 of most estimated regression models was found moderate to high which means most models are accepted for forecasting purposes. The F-statistic for all estimated models of diseases except Scarlet Fever was found significant with p ≤ .05. The change in the mean of CIR associated with one year increase in time can be summarized every 4 years starting by 1997 and ending by 2013 in Table 4. As shown in Table 4 the change in the mean of CIR of most diseases was in general decreased between 1995 and 2003 with different rates but was in general increased between 2007 and 2013 with also different rates.
Of course we can find forecasted values for CIR in multiple next years but we found them for just three selected years, 2014, 2015, and 2016 as shown in Table 5. Forecasted values show that there will be an increase in all and each disease with different rates over time. Figure 1 shows area chart for the CIR for all diseases and for each disease during the period 1995-2013.
4. Discussion
This study was limited in terms of the use of PRM. Dozens of regression models exist and it is possible that other models may be more successful to change in diseases over time. However, a main objective of this study was to apply well known model that is available in an open source environment. The authors were much careful in interpretation the results found in the current study. There are several confounding variables that are not accounted for in the analysis, because the necessary data were not available; therefore it is potentially dangerous to draw strong conclusions from the results found in the present study. Yet the figures concluded by this study can provide considerable evidences about the trends of communicable disease in Dubai and associated risk factors based on which policy and decision makers can mobilize the resources and provide better targeting strategies.
The question to ask here is why the analysis was periodically applied 4 times? Mathematically, the available data set for the period 1995-2013, including 19 years, is approximately divided by 5; the result equals approximately 4 times, where these times are distanced equally in 4 years. Hence, the analysis and comparison might be correct. Also, it is logically and in common sense to assume the CIR cannot be seen or happened every few years, where it can be seen over a couple of years. Nevertheless the data obtained is worthy clinical wise and policy developing wise, it gives baseline where to focus and how to more concerning communicable diseases profile changing overtime and the clinical implications of these changes.
Communicable diseases significantly contribute to morbidity, mortality, and economic losses in Dubai. In view of the population demographics of Dubai, future population-based public health initiatives should consider the sociocultural, religious, ethnic, and educational diversity in the design, development, and implementation of campaigns, interventions, and strategies. As current study talked all socio-demographic factors associated with communicable diseases events in Dubai throughout last 20 years , it prepare the floor for developing proper intervention in terms of prevention and control of the diseases and modifying the trend.
Regarding previous studies and reports, we are agree with the finding in the report conducted in Dubai stated that the linear trend for minimum attack rate of infectious diseases in 1994- 2004 was a steadily significantly decreased in the minimum attack rate to reach 5.1 per thousand in 2004 (Statistical Analysis Section, 2005). This finding reflecting the improvement in Dubai health care system capacity to encounter communicable diseases among Dubai population along the last decades and better understanding and addressing the gaps in preventive health programs. (Bader, 2011. MOH, 2011. GCC ,2013)
5. Conclusions & Recommendations
The conclusions can be summarized in at least five aspects: First, the CIR of most infectious diseases were decreased remarkably in some past periods of time, but some of them are still exist and highly variant over the time period covered by this study. Second, the Change in CIR of all diseases was decreased over the period 1995-2003 while increased over the period 2007-2013. However, the CIR of most diseases was decreased over the period 1995-2003 while increased over the period 2007-2013. Third, the forecasted values for CIR of all diseases showed that they will increase over time and for each disease will increase over time with different rates. Fourth, the highest change of decrease and increase in CIR were found in Chickenpox and Mumps over time; while the lowest change of decrease and increase in CIR were found in Viral Encephalitis and Herpes Zoster over time. Fifth, the largest and smallest variations in CIR were found in Measles and Pulmonary TB respectively. These findings provide insights for local control and prevention strategies.
Although the present paper could not study all infectious diseases and its relationship to the socioeconomic and demographic indicators, it was possible to highlight important issues raised in social and public health analyses. One of the main recommendations is to focus on creating social and awareness programs and services for the infected people for the purpose of improving their living conditions and their families and consequently their communities. Adopting government and private training strategies corresponding to the needs of health care centers can create health awareness and improvement. Finally, encouraging full uptake of immunization is another specific health protection that will further enhance the health status of the Dubai population. Further studies including the necessary need in studying the explanatory variables such as gender, age, race, socioeconomic, etc. that probably cause these diseases are required. Policies to improve health status need to monitor every time. It is very important to study these diseases in other emirates of UAE and make comparison between them.
References
- Bandar, Shar. (2011). Aids among workers in Gulf Region. Al Haya Digital News Paper. Retrieved from ttp://webcache.googleusercontent.com/search?q=cache:http://mobile.alhayat.com/content/1304115072181770500/Saudi
- Johnson, G. D. (2008) Prospective spatial prediction of infectious disease: experience of New York State (USA) with West Nile Virus and proposed directions for improved surveillance. Environmental Ecological Statistics, 15:293–311. Doi.10.1007/s10651-007-0057-5.
- Loney, T., Aw, T.C., Handysides, D. G., et al. (2013) An analysis of the health status of the United Arab Emirates: the ‘Big 4’ public health issues. Glob Health Action, 6: 1-8. http://dx.doi.org/10.3402/gha.v6i0.20100.
- Ministry of Health U.A.E. (2011) news release retrieved from http://www.moh.gov.ae/en/News/Pages/expats-labor-tests-press-conference.aspx - See more at: http://www.arabhealthonline.com/exhibitor/press-releases/urgent-need-for-effective-surveillance-and-control-of-emerging-infectious-diseases-in-gcc/#sthash.FqzHn3DF.dpuf
- Statistical Analysis Section (2005) Statistical News. Department of Medical and Health services, issue 4. http://www.dha.gov.ae/EN/SectorsDirectorates/Sectors/HealthPolicy/Documents/Listing-Feb%2026%202007%20%20551AM-132.pdf.
- Veen J, Godinho J (2006). HIV and TB: A critical co-infection. In: Matic S, Lazarus JV, Donoghoe MC (eds). HIV/AIDS in Europe. Moving from deathsentence to chronic disease management. Copenhagen, WHO Regional Office for Europe:155–170
- http://www.cdc.gov/tb/publications/factsheets/statistics/tbtrends.htm
- September 19, 2014 / Vol. 61 / No. 53 , Summary of Notifiable Diseases — United States, 2012
- http://www.cdc.gov/mmwr/.
- The Executive Board of Health Ministers Council for GCC states. 2013(n.d.). Expatriate workers Check-Up-Project. Retrieved fromhttp://sgh.org.sa/en-us/expatriates/abouttheprogram.aspx
- Ministry of Health U.A.E. (2011) news release retrieved from http://www.moh.gov.ae/en/News/Pages/expats-labor-tests-press-conference.aspx - See more at: http://www.arabhealthonline.com/exhibitor/press-releases/urgent-need-for-effective-surveillance-and-control-of-emerging-infectious-diseases-in-gcc/#sthash.FqzHn3DF.dpuf.


