
International Journal of Economics and Business Administration, Vol. 2, No. 5, September 2016 Publish Date: Nov. 2, 2016 Pages: 59-64
Hybrid Particle Swarm Optimization and Support Vector Regression Performance in Exchange Rate Prediction
Feng Jiang*, Wenjun Wu
School of Statistics and Mathematics, Zhongnan University of Economics and Law, Wuhan, China
Abstract
In this paper, we present a hybrid particle swarm optimization and support vector regression approach to predict exchange rate. This hybrid method examines the validity to optimize the parameters of penalty term and kernel function. For the experiments, the data of exchange rates (USD/CNY, EUR/CNY and CNY/JPY) are examined and optimized to be used for time series predictions with hybrid particle swarm optimization and support vector regression. Some experiments have been analyzed by using the hybrid regression model with four kernel functions including linear, radical basis, polynomial and sigmoid functions. The in-sample and out-of-sample results are compared with training ones. Empirical results show that the hybrid model has high accuracy and it is statistically effective for CNY exchange rate prediction.
Keywords
Particle Swarm Optimization, Support Vector Regression, Exchange Rate
Received: October 16, 2016
Accepted: October 25, 2016
Published online: November 2, 2016
@ 2016 The Authors. Published by American Institute of Science. This Open Access article is under the CC BY license. http://creativecommons.org/licenses/by/4.0/
Contents
1. Introduction 2. Methodology 2.1. Supporting Vector Regression 2.2. Cross Validation-Grid Search 2.3. Genetic Algorithm 2.4. Particle Swarm Optimization 3. Results and Discussions 3.1. Data Source and Pretreatment 3.2. Intuitive Performance 3.3. Statistical Performance 4. Conclusion Acknowledgement
1. Introduction
Exchange rate has been a hot topic in financial series prediction. In relevant literatures, support vector regression (SVR) model, extended by Cortes and Vapnik from support vector machine (SVM) [1], has received much attention. The previous work by Kwon & Moon [2] illustrated that SVR performed well in compromise between model complexity and interpretability. At the same time, it could converge to the best global solution instead of a local one. Ince and Trafalis [3] investigated the combination of ARIMA and SVR in EUR exchange rate prediction. Results showed that it outperformed the logistic model. The genetically optimized SVR proposed by Brandl [4] had higher accuracy than artificial neural network (ANN), ordinary least square (OLS) and conventional time series methods. The same goes for LS-SVM, a time series prediction methodology researched by Rubio [5]. Sermpinis et al [6] proposed a hybrid rolling genetic algorithms-support vector regression (GA-SVR) model to explore the performance of EUR exchange rates. Dunis and Williams [7] explored the performance of various models including neural network (NN), random walk (RW), autoregressive moving average (ARMA), autoregressive conditional heteroskedasticity ARCH, and a Logistic model using the dataset of EUR/USD exchange rate. Bissoondeeal [8] benchmarked a neural network model against three traditional models: RW, ARMA and generalized autoregressive conditional heteroskedasticity (GARCH) in the prediction of UK and US exchange rates. Besides, comparisons conducted by Abraham and Yeung [9], Härdle [10], Sapankevych and Sangar [11], Khandani [12], Öğüt [13] and Papadimitriou [14] verified that the SVR is a state-of-art methodology to predict exchange rate.
At the same time, particle Swarm Optimization (PSO) method has attracted increasing attention for its well-performance in financial series prediction. Sadaei H. J. et al [15] introduced PSO to prediction of long memory time series, which included two stock indexes and USD exchange rates. Results reflected the superiority of a hybrid model combining Auto Regressive Fractional Integrated Moving Average (ARFIMA) with Fuzzy Time Series (FTS) than classical methods. On the basis of predicted fuzzy trends in different granular, Deng Weihui et al [16] obtained the optimal weighting vector by PSO and found that the proposed multi-granular model is not only able to acquire higher forecasting accuracy than conventional methodologies but also capable of capturing and interpreting the fuzzy trends. Cheng Shou-Hsiung [17], Chen Shen-Wen [18] and Chen Shyi-Ming [19] obtained the optimal partition of the intervals in the universe of discourse by PSO techniques to forecast the Taiwan Stock Exchange Capitalization Weighted Stock Index (TAIEX). It was proved that introducing PSO to fuzzy logical relationship groups increased the forecasting accuracy rates of fuzzy time series. Chen, Mu-Yen [20] [21]] integrated PSO with the support vector machine (SVM) model to predict potential financial failures. Results indicated that PSO, applied in parameter selection, had higher accuracy than Grid-SVM, GA-SVM, SOM and SVR-SOM techniques.
In summary, the research on hybrid SVR approaches can be classified into two categories: parameter optimization and kernel function. Furthermore, in most study of financial series prediction, PSO is commonly introduced to conventional time series techniques and SVM method. Despite the recent progress of PSO applied in parameter optimization, experiments on PSO combined with SVR have not been performed. On the basis of the above literatures, we apply the particle swarm optimization (PSO) technique to the task of optimizing SVR parameters, and explore prediction performances of CNY exchange rates under various kernel functions.
The rest of this paper is organized as follows. Section 2 opens with methodology introduction. Section 3 develops the data source, empirical results and discussion, benchmarked with performance of genetically optimized model. Finally, a conclusion is given of CNY exchange rate prediction.
2. Methodology
2.1. Supporting Vector Regression
Support Vector Machine (SVM) constructs a range of hyper planes in high dimensional spaces. Hyper planes fulfill a good separation that has the largest distance to the nearest training data points of any class. Therefore constructed by support vectors, it is called functional margin. SVM distinguishes itself for minimizing the generalization error, that is, structural risk which includes empirical risk and confidential risk. Empirical risk refers to the error produced in given samples. Structural risk, however, not only consider errors in samples, but also errors out of samples. In general, the larger the functional margin is, the lower the generalization error of the classifier can be.
SVM for classification can be extended to solve regression problems. This method is called Support Vector Regression (SVR). It depends only on a subset of the training data, because the loss function for building the model does not concern training points that lie beyond the margin. Analogously, the model produced by SVR depends only on a subset of the training data, because the loss function for building the model ignores any training data close to the model prediction.
Given training vectors ![]() and
and ![]() , SVR solves an convex programming problem:
, SVR solves an convex programming problem:
![]() (1)
(1)
subject to 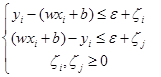
where ![]() is penalty term,
is penalty term, ![]() is the error tolerance,
is the error tolerance,![]() ,
,![]() are slack variables, and
are slack variables, and![]() in which
in which ![]() ,
,![]() are Lagrange multipliers.
are Lagrange multipliers.
The integration of kernel function enables SVR to solve nonlinear problem by projection to a higher-dimensional space. In our study, we explore four kernel functions: linear, polynomial, radical basis function (RBF), and Sigmoid function as follows:
Linear: ![]() (2)
(2)
Polynomial: ![]() ,
,![]() (3)
(3)
RBF: ![]() ,
,![]() (4)
(4)
Sigmoid: ![]() (5)
(5)
2.2. Cross Validation-Grid Search
Cross validation is a state-of-art technique to validate the performance of classifier. Samples are divided into train set and validation set with a range of ways. This process makes full use of the given dataset, which is helpful for generalization. In our exploration, we use 5-fold Cross Validation (5-CV) method integrating the grid search (GS) method. With CV-GS technique, parameters with the highest validation accuracy produce the best global solution. Considering large scale of samples and long searching time of parameters, we commonly introduce inspiration algorithms like genetic algorithm and particle swarm optimization to reduce searching time.
2.3. Genetic Algorithm
Genetic algorithm (GA), inspired from biological simulation technology is created by Holland from University of Michigan. This self-adaptive optimization technique is constructed based on the genetic and evolutional mechanism in the nature. With efficient and robust property, the GA algorithm is commonly used for application in optimization problems. Its combination with SVR has been proved a state-of-art technique in CNY exchange rate prediction.
2.4. Particle Swarm Optimization
Particle Swarm Optimization (PSO), proposed by Kennedy and Eberhart in 1995, origins from the predatory behavior of artificial life and bird flock. Compared to genetic algorithm, PSO doesn’t have the operation of selection, cross and mutation. Its particles follow the best examples to search in the solution space. The procedure of PSO is depicted as follows (Fig. 1).
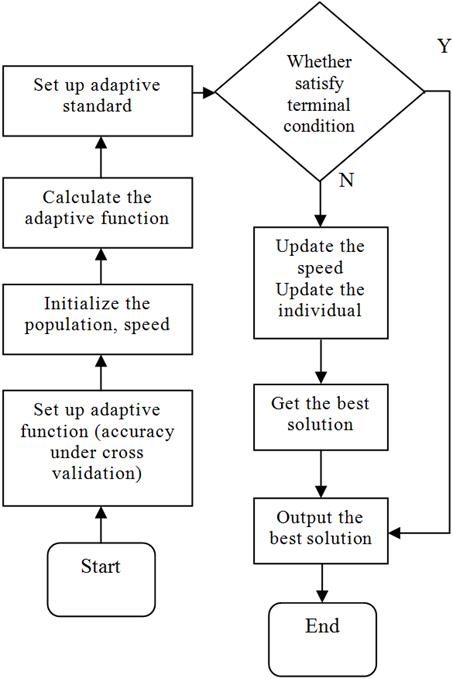
Fig. 1. The procedure of PSO.
3. Results and Discussions
3.1. Data Source and Pretreatment
Daily average exchange rates of USD/CNY, EUR/CNY and CNY/JPY come from the websites http://fx.sauder.ubc.ca/ and Wind Database. Time ranges from 1 January 2015 to 30 December 2015. The total sample capacity is 250, 195 of which are set as the trained set and 30 sample points are assigned to test set. With the rolling prediction method, we predict a certain value with five days of exchange rates before. In other words, there are five values as input and one value as output.
3.2. Intuitive Performance
Radial basis function (RBF) is the most popular kernel function in the existing research. Therefore, we make it the first function to observe the performances. With exchange rate data of USD/CNY, EUR/CNY and JPY/CNY in daily steps, the prediction values of GA-SVR are plotted in Fig. 1~3 respectively. As can be seen in the figures, prediction of GA-SVR performs well in the whole sample, especially for USD/CNY. In Figs. 2 and 3, the out of sample prediction of GA-SVR for daily exchange rate of EUR/CNY and JPY/CNY seems to be less accurate than USD/CNY.
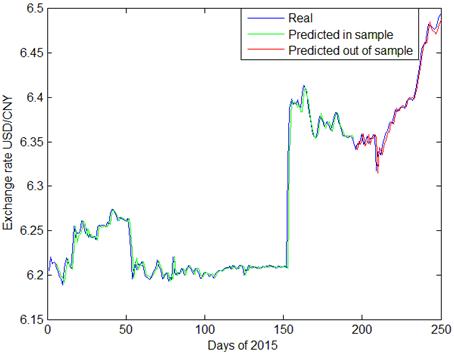
Fig. 2. GA-SVR prediction of daily exchange rate USD/CNY.
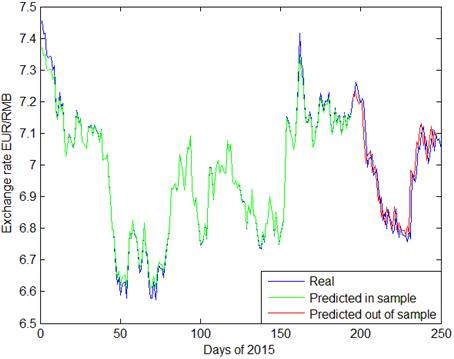
Fig. 3. GA-SVR prediction of daily exchange rate EUR/CNY.
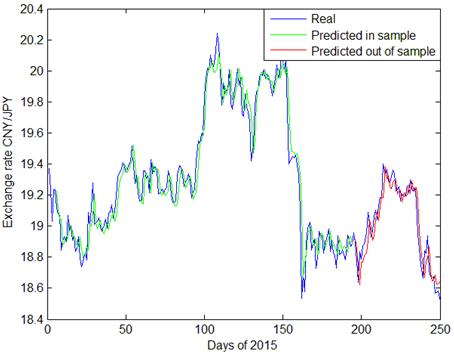
Fig. 4. GA-SVR prediction of daily exchange rate CNY/JPY.
Predictions made by GA-SVR are presented in Figs 2~4, with daily exchange rate USD/CNY, EUR/CNY and JPY/CNY. From Figs. 2 and 5, we see that PSO-SVR prediction of daily exchange rate USD/CNY is as effective as GA-SVR. From Figs. 6~7, the daily exchange rate EUR/CNY and JPY/CNY, PSO-SVR seems to be more accurate than GA-SVR.
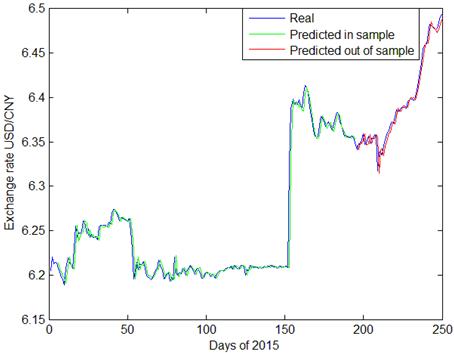
Fig. 5. PSO-SVR prediction of daily exchange rate USD/CNY.
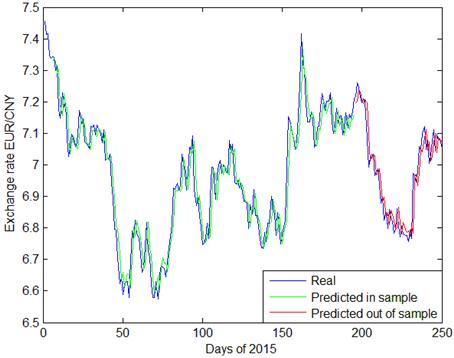
Fig. 6. PSO-SVR prediction of daily exchange rate EUR/CNY.
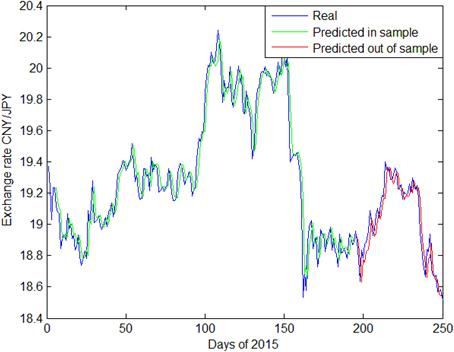
Fig. 7. PSO-SVR prediction of daily exchange rate CNY/JPY.
In terms of prediction for volatility, both GA-SVR and PSO-SVR have good prediction performance. As shown in the plots, CNY exchange rates have tremendous fluctuations during 2015. Specifically, since August 11th, the 150th day of this year, there is a fast depreciation of CNY exchange rate, followed by increasing fluctuations since with the first two quarters. This phenomenon is probably owing to the exchange rate reforming policy proposed in China on 2015 August 11th. Comparing Fig. 3, Fig. 4 and Fig. 5 with other graphs, the PSO-SVR not only catches the tendency of exchange rates, but also captures the details of waves as well.
As for out-of-sample data, the distinctions between PSO-SVR and GA-SVR are not obvious. Both models perform well in the prediction of USD/CNY, EUR/CNY and CNY/JPY exchange rate. In the next section, statistical results of PSO-SVR benchmarked with GA-SVR are presented with more kernel functions.
3.3. Statistical Performance
With in-sample and out-of-sample data, the statistical performances of linear kernel (PSO-L-SVR), polynomial kernel (PSO-P-SVR), RBF (PSO-R-SVR) and sigmoid function (PSO- S-SVR) are presented benchmarked with genetically optimized SVR.
Mean Squared Errors (MSEs) of USD/CNY, EUR/CNY and CNY/JPY exchange rate with optimized SVR models are listed as follows, with in-sample results in Table 1 and out-of-sample ones in Table 2.
Table 1. MSE of GA/PSO-SVR in sample.
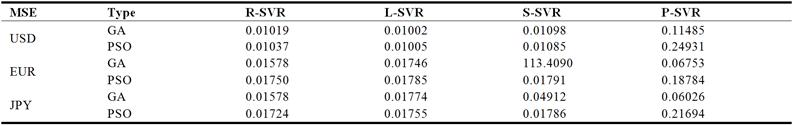
Table 2. MSE of GA/PSO-SVR out of sample.
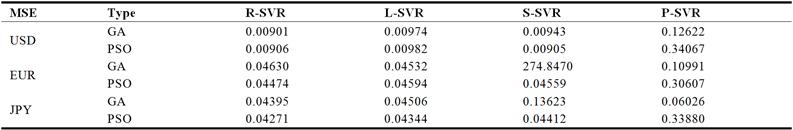
For USD/CNY prediction, GA outperforms PSO in general. In samples, performance of GA-L-SVR is the best followed by PSO-L-SVR. GA-R-SVR is the most accurate out of sample with PSO-S-SVR in the second place. For both GA-SVR and PSO-SVR, P-SVR has the largest prediction error. The above results indicate that for in sample prediction, linear kernel function has the best performance, but for out of sample forecasting, RBF for GA or sigmoid function for PSO would be the best choices. However the sample is, polynomial kernel function has the worst performance.
To predict EUR/CNY, PSO outperforms GA in general. Figures show that with in-sample data, both GA and PSO perform best under RBF. With out-of-sample data, however, GA-L-SVR is the most accurate out of sample with PSO-R-SVR in the second place in contrast of USD/CNY. Performance of polynomial kernel function is still the worst for PSO. Furthermore, it is impressive that the sigmoid kernel function with genetically optimized model has tremendous errors, making GA-SVR fairly unstable in EUR/CNY prediction.
In the prediction of CNY/JPY, the overall performance of PSO is also better than GA techniques. Both in sample and out of sample errors demonstrate that RBF has the highest accuracy. In addition, the polynomial one has the lowest accuracy for PSO with all samples and GA in samples, while the sigmoid function is the worst choice for GA out of sample.
In summary, PSO distinguishes itself in prediction for Euro and Japanese Yen with RBF kernel function. In US dollars prediction, both PSO and GA performs well.
4. Conclusion
In the paper, the hybrid particle swarm optimization and SVR with linear kernel, polynomial kernel, RBF and sigmoid function have been discussed to predict daily CNY exchange rates. The statistical performances with in-sample and out-of-sample data show that PSO-SVR with RBF kernel function performances pretty well in CNY exchange rate prediction, especially for Euro and Japanese Yen. Study on the improvement of parameter optimization technique could be developed to improve the accuracy. Furthermore, PSO on fuzzy time series prediction can be discussed in the future.
Acknowledgement
The work is supported by the National Natural Science Foundation of China under Grant 61304067 and the Natural Science Foundation of Hubei Province of China under Grant 2013CFB443.
References
- Cortes, C., V. Vapnik (1995). Support-vector networks, Machine Learning, 20, 273-297.
- Kwon, Y., B. R. Y. K. Moon (2007). A hybrid neurogenetic approach for stock forecasting, IEEE Trans. Neural Netw., 18, 851-864.
- Ince, H., T. Trafalis (2006). A hybrid model for exchange rate prediction,Decision Support Systems, 42, 1054-1062.
- Brandl, B., U. Wildburger, S. Pickl (2009). Increasing of the fitness of fundamental exchange rate forecast models, International Journal of Contemporary Mathematical Sciences, 4, 779-798.
- Rubio, G., H. Pomares, I. Rojas, L. Herrera (2011). A heuristic method for parameter selection in LS-SVM: application to time series prediction, International Journal of Forecasting, 27, 725-739.
- Sermpinis, G., C. Stasinakis, K. Theofilatos, A. Karathanasopoulos (2015). Modeling, forecasting and trading the EUR exchange rates with hybrid rolling genetical gorithms—Support vector regression forecast combinations,Euro. J. Oper. Res., 247, 831–846.
- Dunis, C., M. Williams (2002). Modeling and trading the EUR/USD exchange rate: do neural network models perform better?,Derivatives Use, Trading and Reg., 8, 211–239.
- Bissoondeeal, R., M. Karoglou, A. M. Gazely (2011). Forecasting the UK/US exchange rate with divisia monetary models and neural networks,Scott. J. Political Econ., 58, 127–152.
- Abraham, A., A. Yeung (2003).Integrating ensemble of intelligence systems for stock exchange prediction,Notes on Computational Science, 2687, 774-781.
- Härdle, W., W. Lee, D. Schäfer, Y. Yeh (2009). Variable selection and oversampling in the use of smooth support vector machines for predicting the default risk of companies,Journal of Forecasting, 28, 512-534.
- Sapankevych, N., R. Sangar (2009).Time series prediction using support vector machines: a survey,IEEE Computational Intelligence Magazine, 4, 24-38.
- Khandani, A., A. Kim, A. Lo (2010). Consumer credit-risk models via machine-learning algorithms,J. Bank. Finance, 34, 2767-2787.
- Öğüt, H., Doğanay, M., Ceylan, N., Aktaş R. (2012). Prediction of bank financial strength ratings: the case of Turkey,Economic Modelling, 29, 632-640.
- Papadimitriou, T., P. Gogas, M. Matthaiou, E. Chrysanthidou (2015). Yield curve and recession forecasting in a machine learning framework,Computational Economics, 45, 635-645.
- Sadaei H. J., Enayatifar R., Guimaraes, F. G., Mahmud M., Alzamil, Z. A. (2016). Combining ARFIMA models and fuzzy time series for the forecast of long memory time series,Neuralcomputing, 175, 782-796.
- Deng W. H., Wang G. Y., Zhang X. R., Xu J., Li G. D. (2016). A multi-granularity combined prediction model based on fuzzy trend forecasting and particle swarm techniques,Neuralcomputing, 173, 1671-1682.
- Cheng S., Chen S., Jian W. (2016). Fuzzy time series forecasting based on fuzzy logical relationships and similarity measures,Information Sciences, 327, 272-287.
- Chen S., Ch en S. (2015). Fuzzy Forecasting Based on Two-Factors Second-Order Fuzzy-Trend Logical Relationship Groups and the Probabilities of Trends of Fuzzy Logical Relationships, IEEE Transactions on Cybernetics, 45, 40 5-415.
- Chen Shyi-Ming, M analu Gandhi Maruli Tua, Pan Jeng-Shyang, Liu Hsiang-Chuan (2013) Fuzzy Forecasting Based on Two-Factors Second-Order Fuzzy-Trend Logical Relationship Groups and Particle Swarm Optimization Techniques, IEEE Transactions onCybernetics, 43, 1102-1117.
- Chen M. (2012). A Hybird Model forBusiness Failure Prediction - Utiliazation of Particle Swarm Optimizaition and Support Vector Machines, Neural Network World, 21, 129-152.
- Chen M. (2014). Using a hybrid evolution approach to forecast financial failures for Taiwan-listed companies, Quantitavie Finance, 14, 1047-1058.


